

Key Insights
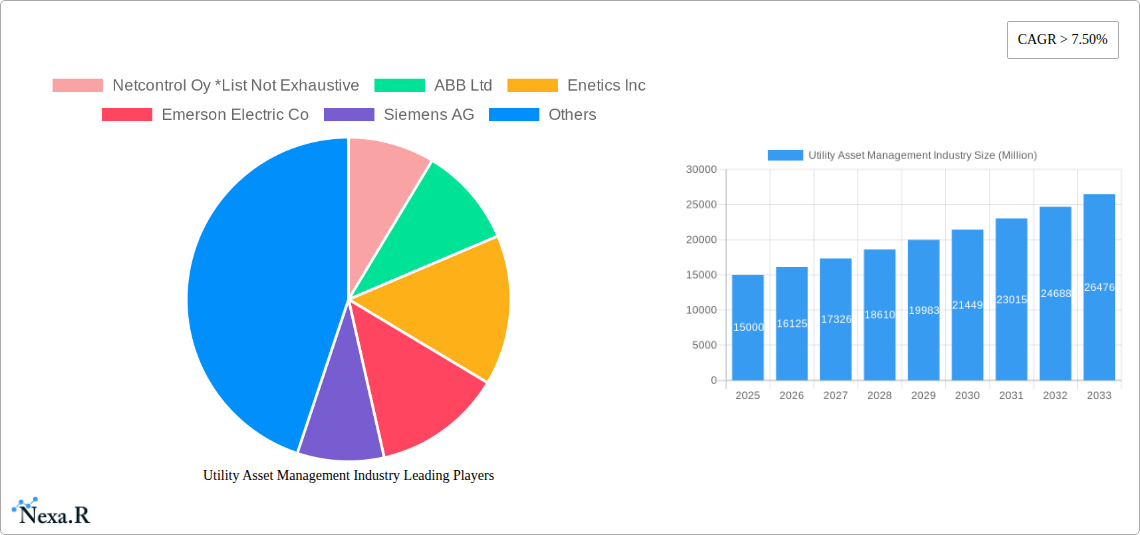
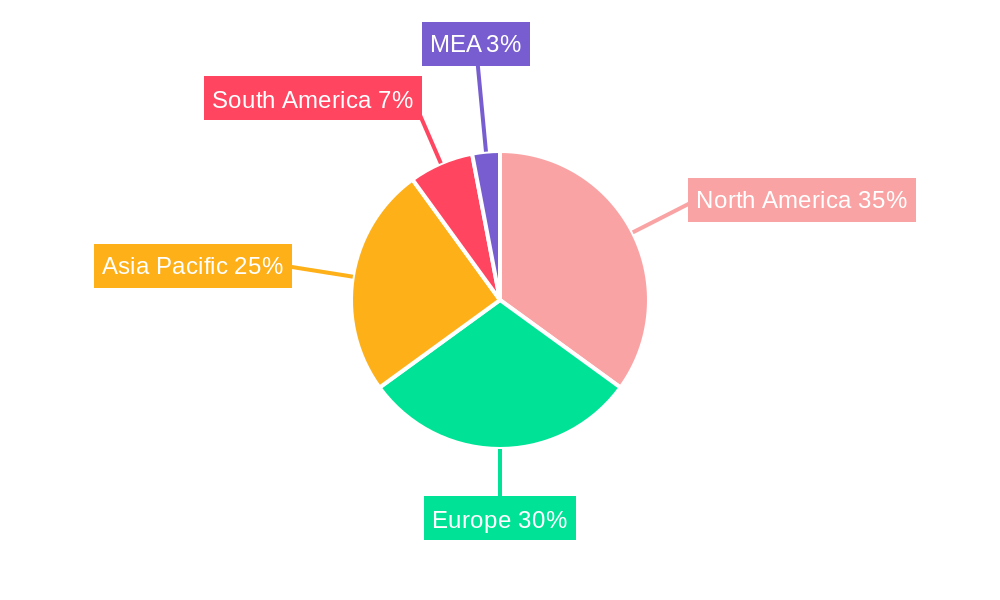
The Utility Asset Management (UAM) market is experiencing robust growth, driven by the aging infrastructure of power grids globally and the increasing need for efficient and reliable energy delivery. The market, estimated at $XX million in 2025, is projected to maintain a Compound Annual Growth Rate (CAGR) exceeding 7.50% through 2033. This expansion is fueled by several key factors. Firstly, the escalating demand for electricity, particularly in rapidly developing economies across Asia-Pacific and South America, necessitates proactive asset management to prevent outages and ensure grid stability. Secondly, the integration of smart grid technologies and the adoption of advanced analytics are transforming UAM, enabling predictive maintenance, improved operational efficiency, and reduced operational expenditures. Finally, regulatory pressures and increasing focus on environmental sustainability are compelling utility companies to optimize asset performance and minimize environmental impact, further stimulating market growth. The market is segmented by utility type (public and private) and application (transformers, substations, transmission & distribution networks). North America and Europe currently hold significant market share, but the Asia-Pacific region is anticipated to witness substantial growth due to large-scale infrastructure development projects and increasing investments in renewable energy sources. Leading players like ABB, Siemens, and General Electric are driving innovation through advanced solutions such as sensor technologies, data analytics platforms, and specialized software. Competition is expected to remain intense as companies strive to offer comprehensive and integrated UAM solutions.
The segmentation within the UAM market presents opportunities for specialized providers. Public utilities, often facing budgetary constraints, may prioritize cost-effective solutions, while private utilities may focus on advanced analytics and predictive maintenance for enhanced operational efficiency. Similarly, the application-specific focus allows vendors to tailor solutions for the unique challenges of each segment (transformers, substations, etc.). The competitive landscape is characterized by a blend of established players and emerging technology providers. Established players leverage their extensive experience and global reach, while innovative startups introduce cutting-edge technologies and agile solutions. Strategic partnerships and mergers and acquisitions are likely to play a crucial role in shaping the market's future landscape, particularly in integrating advanced technologies such as AI and IoT. This integration promises to significantly improve operational efficiency, reduce downtime, and enhance the overall reliability of power grids worldwide.
Utility Asset Management Industry: Market Report 2019-2033
This comprehensive report provides a detailed analysis of the Utility Asset Management (UAM) industry, encompassing market dynamics, growth trends, regional performance, and key players. With a study period spanning 2019-2033, a base year of 2025, and a forecast period of 2025-2033, this report offers invaluable insights for industry professionals, investors, and strategic decision-makers. The report analyzes both parent and child markets, including Public and Private Utilities, and applications across Transformers, Substations, and Transmission & Distribution Networks. Market values are presented in millions of units.
Utility Asset Management Industry Market Dynamics & Structure
The Utility Asset Management market is experiencing significant growth driven by increasing electricity demand, aging infrastructure, and the need for improved grid reliability. Market concentration is moderate, with several large players and numerous smaller, specialized companies competing. Technological innovation, particularly in areas like AI, IoT, and advanced analytics, is a key driver. Regulatory frameworks, varying significantly by region, play a crucial role in shaping market dynamics. Competitive substitutes are limited, although optimizing existing assets through improved operational efficiency presents a challenge. End-user demographics are largely shaped by the utility sector itself, with public and private utilities forming the primary customer base. M&A activity is consistent, with an estimated xx number of deals in the past 5 years, representing a xx% increase year-on-year.
- Market Concentration: Moderate, with top 5 players holding approximately xx% market share (2024).
- Technological Innovation: Strong driver, focused on AI, IoT, predictive maintenance, and digital twins.
- Regulatory Landscape: Significant regional variations impact investment and deployment strategies.
- Competitive Substitutes: Limited direct substitutes, but operational efficiency improvements present indirect competition.
- M&A Activity: xx deals in the past 5 years (2020-2024), averaging xx million USD per deal.
- Innovation Barriers: High initial investment costs, integration challenges with legacy systems, and data security concerns.
Utility Asset Management Industry Growth Trends & Insights
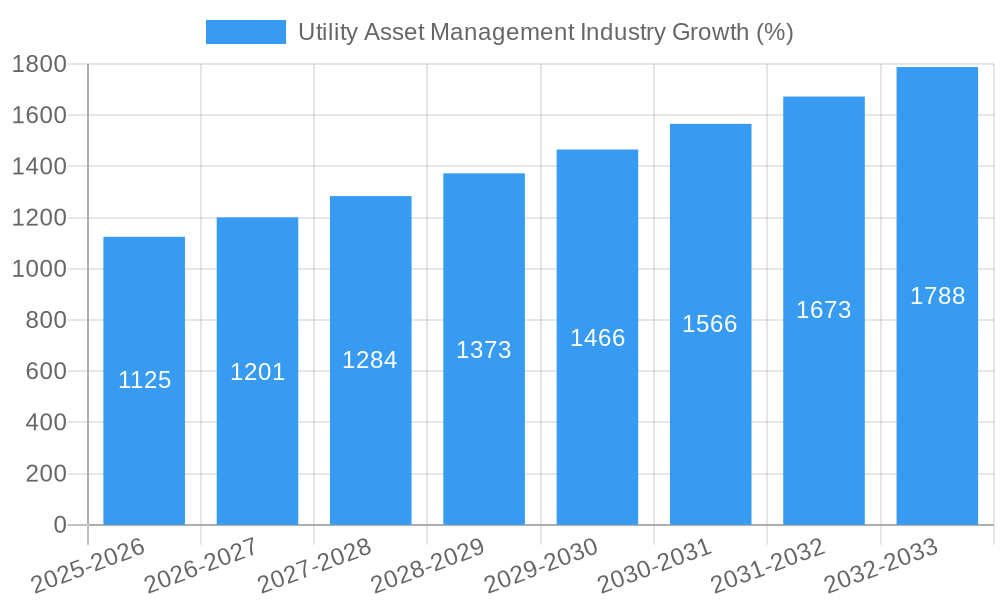
The UAM market is experiencing robust growth, with a projected Compound Annual Growth Rate (CAGR) of xx% during the forecast period (2025-2033). Market size is estimated at xx million in 2025 and is expected to reach xx million by 2033. Adoption rates are increasing as utilities recognize the value proposition of improved asset management in enhancing operational efficiency, reducing costs, and improving grid resilience. Technological disruptions, such as the increasing adoption of smart grid technologies and the rise of digital twins, are accelerating market growth. Consumer behavior shifts are subtle but significant, with greater emphasis on environmental sustainability and reliable service driving demand for improved grid management.
Dominant Regions, Countries, or Segments in Utility Asset Management Industry
North America currently holds the largest market share in the UAM industry, driven by significant investment in grid modernization and increasing adoption of smart grid technologies. Europe follows closely behind, exhibiting substantial growth potential due to stringent regulatory requirements and increasing focus on renewable energy integration. Within the UAM market, public utilities represent a larger segment than private utilities, owing to the larger scale of their operations and greater investment capacity. The Transmission & Distribution Network segment dominates, followed by Substations and Transformers.
- Key Drivers: Government incentives, aging infrastructure, increasing demand for reliable power, renewable energy integration.
- Dominant Region: North America (xx% market share in 2024) followed by Europe (xx% market share in 2024).
- Dominant Segment: Transmission & Distribution Network (xx% market share in 2024)
- Growth Potential: Significant untapped potential in developing economies and emerging markets.
Utility Asset Management Industry Product Landscape
The UAM product landscape is characterized by a wide range of software and hardware solutions, including SCADA systems, outage management systems, GIS mapping software, AMI technology, and various data analytics tools. These solutions are increasingly integrated and leverage AI and machine learning to provide advanced predictive maintenance capabilities and optimize asset performance. Unique selling propositions include improved accuracy of predictions, reduced downtime, and enhanced grid visibility. Technological advancements are focused on cloud-based platforms, improved data security, and seamless integration with other utility systems.
Key Drivers, Barriers & Challenges in Utility Asset Management Industry
Key Drivers: Increasing electricity demand, aging infrastructure requiring upgrades, regulatory mandates for grid modernization, and the integration of renewable energy sources. The transition to smart grids and the need for improved grid resilience are crucial drivers.
Key Challenges: High initial investment costs associated with implementing UAM solutions, concerns about data security and privacy, complexity of integrating new technologies with legacy systems, and a shortage of skilled workforce. Supply chain disruptions can cause significant delays and cost overruns. Regulatory hurdles vary by region. Competition amongst vendors can be intense.
Emerging Opportunities in Utility Asset Management Industry
Emerging opportunities exist in the development and deployment of AI-powered predictive maintenance solutions, the integration of IoT sensors for real-time asset monitoring, and the use of blockchain technology to enhance data security and transparency. Untapped markets exist in developing countries where infrastructure modernization is a high priority. The increasing integration of distributed energy resources (DERs) is creating new opportunities for UAM solutions to manage and optimize the operation of these resources. The development of advanced analytics tools to improve grid management is expected to drive significant growth.
Growth Accelerators in the Utility Asset Management Industry Industry
Technological breakthroughs in areas such as AI, machine learning, and IoT are driving significant growth. Strategic partnerships between UAM solution providers and utility companies are accelerating adoption rates. Expansion into new geographic markets, particularly in developing economies, offers substantial growth potential. The increasing demand for reliable and sustainable energy is creating a favorable market environment for the adoption of UAM solutions.
Key Players Shaping the Utility Asset Management Industry Market
- Netcontrol Oy
- ABB Ltd
- Enetics Inc
- Emerson Electric Co
- Siemens AG
- Aclara Technologies LLC
- Lindsey Manufacturing Co
- Sentient Energy Inc
- General Electric Company
- S&C Electric Company
Notable Milestones in Utility Asset Management Industry Sector
- September 2022: An electricity utility in Seguin, Texas, installed a complete monitoring and control system including SCADA, OMS, AMI, GIS mapping, and energy efficiency software, significantly improving reliability and network management capabilities.
- May 2022: GE Digital launched its DERMS (Distributed Energy Resource Management System), providing utilities with tools to safely and efficiently integrate DERs into the grid.
In-Depth Utility Asset Management Industry Market Outlook
The future of the UAM market looks bright. Continued technological advancements, coupled with increasing regulatory pressure and the growing need for grid modernization, will drive significant growth in the coming years. Strategic partnerships and market expansion strategies will play a critical role in shaping the industry landscape. The focus on sustainable and resilient energy systems will create many opportunities for innovative UAM solutions, leading to substantial market expansion and further technological development.
Utility Asset Management Industry Segmentation
-
1. Application
- 1.1. Transformer
- 1.2. Sub-Station
- 1.3. Transimission & Distribution Network
-
2. Utility Type
- 2.1. Public Utility
- 2.2. Private Utility
Utility Asset Management Industry Segmentation By Geography
- 1. North America
- 2. Asia Pacific
- 3. Europe
- 4. South America
- 5. Middle East and Africa
Utility Asset Management Industry REPORT HIGHLIGHTS
| Aspects | Details |
|---|---|
| Study Period | 2019-2033 |
| Base Year | 2024 |
| Estimated Year | 2025 |
| Forecast Period | 2025-2033 |
| Historical Period | 2019-2024 |
| Growth Rate | CAGR of > 7.50% from 2019-2033 |
| Segmentation |
|
Table of Contents
- 1. Introduction
- 1.1. Research Scope
- 1.2. Market Segmentation
- 1.3. Research Methodology
- 1.4. Definitions and Assumptions
- 2. Executive Summary
- 2.1. Introduction
- 3. Market Dynamics
- 3.1. Introduction
- 3.2. Market Drivers
- 3.2.1. 4.; Several Government Plans for the Energy Transition in the Region
- 3.3. Market Restrains
- 3.3.1. 4.; Increasing Adoption of Self-generated Renewable Power in the Residential and Commercial Sectors
- 3.4. Market Trends
- 3.4.1. Transformer to Witness Significant Growth
- 4. Market Factor Analysis
- 4.1. Porters Five Forces
- 4.2. Supply/Value Chain
- 4.3. PESTEL analysis
- 4.4. Market Entropy
- 4.5. Patent/Trademark Analysis
- 5. Global Utility Asset Management Industry Analysis, Insights and Forecast, 2019-2031
- 5.1. Market Analysis, Insights and Forecast - by Application
- 5.1.1. Transformer
- 5.1.2. Sub-Station
- 5.1.3. Transimission & Distribution Network
- 5.2. Market Analysis, Insights and Forecast - by Utility Type
- 5.2.1. Public Utility
- 5.2.2. Private Utility
- 5.3. Market Analysis, Insights and Forecast - by Region
- 5.3.1. North America
- 5.3.2. Asia Pacific
- 5.3.3. Europe
- 5.3.4. South America
- 5.3.5. Middle East and Africa
- 5.1. Market Analysis, Insights and Forecast - by Application
- 6. North America Utility Asset Management Industry Analysis, Insights and Forecast, 2019-2031
- 6.1. Market Analysis, Insights and Forecast - by Application
- 6.1.1. Transformer
- 6.1.2. Sub-Station
- 6.1.3. Transimission & Distribution Network
- 6.2. Market Analysis, Insights and Forecast - by Utility Type
- 6.2.1. Public Utility
- 6.2.2. Private Utility
- 6.1. Market Analysis, Insights and Forecast - by Application
- 7. Asia Pacific Utility Asset Management Industry Analysis, Insights and Forecast, 2019-2031
- 7.1. Market Analysis, Insights and Forecast - by Application
- 7.1.1. Transformer
- 7.1.2. Sub-Station
- 7.1.3. Transimission & Distribution Network
- 7.2. Market Analysis, Insights and Forecast - by Utility Type
- 7.2.1. Public Utility
- 7.2.2. Private Utility
- 7.1. Market Analysis, Insights and Forecast - by Application
- 8. Europe Utility Asset Management Industry Analysis, Insights and Forecast, 2019-2031
- 8.1. Market Analysis, Insights and Forecast - by Application
- 8.1.1. Transformer
- 8.1.2. Sub-Station
- 8.1.3. Transimission & Distribution Network
- 8.2. Market Analysis, Insights and Forecast - by Utility Type
- 8.2.1. Public Utility
- 8.2.2. Private Utility
- 8.1. Market Analysis, Insights and Forecast - by Application
- 9. South America Utility Asset Management Industry Analysis, Insights and Forecast, 2019-2031
- 9.1. Market Analysis, Insights and Forecast - by Application
- 9.1.1. Transformer
- 9.1.2. Sub-Station
- 9.1.3. Transimission & Distribution Network
- 9.2. Market Analysis, Insights and Forecast - by Utility Type
- 9.2.1. Public Utility
- 9.2.2. Private Utility
- 9.1. Market Analysis, Insights and Forecast - by Application
- 10. Middle East and Africa Utility Asset Management Industry Analysis, Insights and Forecast, 2019-2031
- 10.1. Market Analysis, Insights and Forecast - by Application
- 10.1.1. Transformer
- 10.1.2. Sub-Station
- 10.1.3. Transimission & Distribution Network
- 10.2. Market Analysis, Insights and Forecast - by Utility Type
- 10.2.1. Public Utility
- 10.2.2. Private Utility
- 10.1. Market Analysis, Insights and Forecast - by Application
- 11. North America Utility Asset Management Industry Analysis, Insights and Forecast, 2019-2031
- 11.1. Market Analysis, Insights and Forecast - By Country/Sub-region
- 11.1.1 United States
- 11.1.2 Canada
- 11.1.3 Mexico
- 12. Europe Utility Asset Management Industry Analysis, Insights and Forecast, 2019-2031
- 12.1. Market Analysis, Insights and Forecast - By Country/Sub-region
- 12.1.1 Germany
- 12.1.2 United Kingdom
- 12.1.3 France
- 12.1.4 Spain
- 12.1.5 Italy
- 12.1.6 Spain
- 12.1.7 Belgium
- 12.1.8 Netherland
- 12.1.9 Nordics
- 12.1.10 Rest of Europe
- 13. Asia Pacific Utility Asset Management Industry Analysis, Insights and Forecast, 2019-2031
- 13.1. Market Analysis, Insights and Forecast - By Country/Sub-region
- 13.1.1 China
- 13.1.2 Japan
- 13.1.3 India
- 13.1.4 South Korea
- 13.1.5 Southeast Asia
- 13.1.6 Australia
- 13.1.7 Indonesia
- 13.1.8 Phillipes
- 13.1.9 Singapore
- 13.1.10 Thailandc
- 13.1.11 Rest of Asia Pacific
- 14. South America Utility Asset Management Industry Analysis, Insights and Forecast, 2019-2031
- 14.1. Market Analysis, Insights and Forecast - By Country/Sub-region
- 14.1.1 Brazil
- 14.1.2 Argentina
- 14.1.3 Peru
- 14.1.4 Chile
- 14.1.5 Colombia
- 14.1.6 Ecuador
- 14.1.7 Venezuela
- 14.1.8 Rest of South America
- 15. North America Utility Asset Management Industry Analysis, Insights and Forecast, 2019-2031
- 15.1. Market Analysis, Insights and Forecast - By Country/Sub-region
- 15.1.1 United States
- 15.1.2 Canada
- 15.1.3 Mexico
- 16. MEA Utility Asset Management Industry Analysis, Insights and Forecast, 2019-2031
- 16.1. Market Analysis, Insights and Forecast - By Country/Sub-region
- 16.1.1 United Arab Emirates
- 16.1.2 Saudi Arabia
- 16.1.3 South Africa
- 16.1.4 Rest of Middle East and Africa
- 17. Competitive Analysis
- 17.1. Global Market Share Analysis 2024
- 17.2. Company Profiles
- 17.2.1 Netcontrol Oy *List Not Exhaustive
- 17.2.1.1. Overview
- 17.2.1.2. Products
- 17.2.1.3. SWOT Analysis
- 17.2.1.4. Recent Developments
- 17.2.1.5. Financials (Based on Availability)
- 17.2.2 ABB Ltd
- 17.2.2.1. Overview
- 17.2.2.2. Products
- 17.2.2.3. SWOT Analysis
- 17.2.2.4. Recent Developments
- 17.2.2.5. Financials (Based on Availability)
- 17.2.3 Enetics Inc
- 17.2.3.1. Overview
- 17.2.3.2. Products
- 17.2.3.3. SWOT Analysis
- 17.2.3.4. Recent Developments
- 17.2.3.5. Financials (Based on Availability)
- 17.2.4 Emerson Electric Co
- 17.2.4.1. Overview
- 17.2.4.2. Products
- 17.2.4.3. SWOT Analysis
- 17.2.4.4. Recent Developments
- 17.2.4.5. Financials (Based on Availability)
- 17.2.5 Siemens AG
- 17.2.5.1. Overview
- 17.2.5.2. Products
- 17.2.5.3. SWOT Analysis
- 17.2.5.4. Recent Developments
- 17.2.5.5. Financials (Based on Availability)
- 17.2.6 Aclara Technologies LLC
- 17.2.6.1. Overview
- 17.2.6.2. Products
- 17.2.6.3. SWOT Analysis
- 17.2.6.4. Recent Developments
- 17.2.6.5. Financials (Based on Availability)
- 17.2.7 Lindsey Manufacturing Co
- 17.2.7.1. Overview
- 17.2.7.2. Products
- 17.2.7.3. SWOT Analysis
- 17.2.7.4. Recent Developments
- 17.2.7.5. Financials (Based on Availability)
- 17.2.8 Sentient Energy Inc
- 17.2.8.1. Overview
- 17.2.8.2. Products
- 17.2.8.3. SWOT Analysis
- 17.2.8.4. Recent Developments
- 17.2.8.5. Financials (Based on Availability)
- 17.2.9 General Electric Company
- 17.2.9.1. Overview
- 17.2.9.2. Products
- 17.2.9.3. SWOT Analysis
- 17.2.9.4. Recent Developments
- 17.2.9.5. Financials (Based on Availability)
- 17.2.10 S&C Electric Company
- 17.2.10.1. Overview
- 17.2.10.2. Products
- 17.2.10.3. SWOT Analysis
- 17.2.10.4. Recent Developments
- 17.2.10.5. Financials (Based on Availability)
- 17.2.1 Netcontrol Oy *List Not Exhaustive
List of Figures
- Figure 1: Global Utility Asset Management Industry Revenue Breakdown (Million, %) by Region 2024 & 2032
- Figure 2: North America Utility Asset Management Industry Revenue (Million), by Country 2024 & 2032
- Figure 3: North America Utility Asset Management Industry Revenue Share (%), by Country 2024 & 2032
- Figure 4: Europe Utility Asset Management Industry Revenue (Million), by Country 2024 & 2032
- Figure 5: Europe Utility Asset Management Industry Revenue Share (%), by Country 2024 & 2032
- Figure 6: Asia Pacific Utility Asset Management Industry Revenue (Million), by Country 2024 & 2032
- Figure 7: Asia Pacific Utility Asset Management Industry Revenue Share (%), by Country 2024 & 2032
- Figure 8: South America Utility Asset Management Industry Revenue (Million), by Country 2024 & 2032
- Figure 9: South America Utility Asset Management Industry Revenue Share (%), by Country 2024 & 2032
- Figure 10: North America Utility Asset Management Industry Revenue (Million), by Country 2024 & 2032
- Figure 11: North America Utility Asset Management Industry Revenue Share (%), by Country 2024 & 2032
- Figure 12: MEA Utility Asset Management Industry Revenue (Million), by Country 2024 & 2032
- Figure 13: MEA Utility Asset Management Industry Revenue Share (%), by Country 2024 & 2032
- Figure 14: North America Utility Asset Management Industry Revenue (Million), by Application 2024 & 2032
- Figure 15: North America Utility Asset Management Industry Revenue Share (%), by Application 2024 & 2032
- Figure 16: North America Utility Asset Management Industry Revenue (Million), by Utility Type 2024 & 2032
- Figure 17: North America Utility Asset Management Industry Revenue Share (%), by Utility Type 2024 & 2032
- Figure 18: North America Utility Asset Management Industry Revenue (Million), by Country 2024 & 2032
- Figure 19: North America Utility Asset Management Industry Revenue Share (%), by Country 2024 & 2032
- Figure 20: Asia Pacific Utility Asset Management Industry Revenue (Million), by Application 2024 & 2032
- Figure 21: Asia Pacific Utility Asset Management Industry Revenue Share (%), by Application 2024 & 2032
- Figure 22: Asia Pacific Utility Asset Management Industry Revenue (Million), by Utility Type 2024 & 2032
- Figure 23: Asia Pacific Utility Asset Management Industry Revenue Share (%), by Utility Type 2024 & 2032
- Figure 24: Asia Pacific Utility Asset Management Industry Revenue (Million), by Country 2024 & 2032
- Figure 25: Asia Pacific Utility Asset Management Industry Revenue Share (%), by Country 2024 & 2032
- Figure 26: Europe Utility Asset Management Industry Revenue (Million), by Application 2024 & 2032
- Figure 27: Europe Utility Asset Management Industry Revenue Share (%), by Application 2024 & 2032
- Figure 28: Europe Utility Asset Management Industry Revenue (Million), by Utility Type 2024 & 2032
- Figure 29: Europe Utility Asset Management Industry Revenue Share (%), by Utility Type 2024 & 2032
- Figure 30: Europe Utility Asset Management Industry Revenue (Million), by Country 2024 & 2032
- Figure 31: Europe Utility Asset Management Industry Revenue Share (%), by Country 2024 & 2032
- Figure 32: South America Utility Asset Management Industry Revenue (Million), by Application 2024 & 2032
- Figure 33: South America Utility Asset Management Industry Revenue Share (%), by Application 2024 & 2032
- Figure 34: South America Utility Asset Management Industry Revenue (Million), by Utility Type 2024 & 2032
- Figure 35: South America Utility Asset Management Industry Revenue Share (%), by Utility Type 2024 & 2032
- Figure 36: South America Utility Asset Management Industry Revenue (Million), by Country 2024 & 2032
- Figure 37: South America Utility Asset Management Industry Revenue Share (%), by Country 2024 & 2032
- Figure 38: Middle East and Africa Utility Asset Management Industry Revenue (Million), by Application 2024 & 2032
- Figure 39: Middle East and Africa Utility Asset Management Industry Revenue Share (%), by Application 2024 & 2032
- Figure 40: Middle East and Africa Utility Asset Management Industry Revenue (Million), by Utility Type 2024 & 2032
- Figure 41: Middle East and Africa Utility Asset Management Industry Revenue Share (%), by Utility Type 2024 & 2032
- Figure 42: Middle East and Africa Utility Asset Management Industry Revenue (Million), by Country 2024 & 2032
- Figure 43: Middle East and Africa Utility Asset Management Industry Revenue Share (%), by Country 2024 & 2032
List of Tables
- Table 1: Global Utility Asset Management Industry Revenue Million Forecast, by Region 2019 & 2032
- Table 2: Global Utility Asset Management Industry Revenue Million Forecast, by Application 2019 & 2032
- Table 3: Global Utility Asset Management Industry Revenue Million Forecast, by Utility Type 2019 & 2032
- Table 4: Global Utility Asset Management Industry Revenue Million Forecast, by Region 2019 & 2032
- Table 5: Global Utility Asset Management Industry Revenue Million Forecast, by Country 2019 & 2032
- Table 6: United States Utility Asset Management Industry Revenue (Million) Forecast, by Application 2019 & 2032
- Table 7: Canada Utility Asset Management Industry Revenue (Million) Forecast, by Application 2019 & 2032
- Table 8: Mexico Utility Asset Management Industry Revenue (Million) Forecast, by Application 2019 & 2032
- Table 9: Global Utility Asset Management Industry Revenue Million Forecast, by Country 2019 & 2032
- Table 10: Germany Utility Asset Management Industry Revenue (Million) Forecast, by Application 2019 & 2032
- Table 11: United Kingdom Utility Asset Management Industry Revenue (Million) Forecast, by Application 2019 & 2032
- Table 12: France Utility Asset Management Industry Revenue (Million) Forecast, by Application 2019 & 2032
- Table 13: Spain Utility Asset Management Industry Revenue (Million) Forecast, by Application 2019 & 2032
- Table 14: Italy Utility Asset Management Industry Revenue (Million) Forecast, by Application 2019 & 2032
- Table 15: Spain Utility Asset Management Industry Revenue (Million) Forecast, by Application 2019 & 2032
- Table 16: Belgium Utility Asset Management Industry Revenue (Million) Forecast, by Application 2019 & 2032
- Table 17: Netherland Utility Asset Management Industry Revenue (Million) Forecast, by Application 2019 & 2032
- Table 18: Nordics Utility Asset Management Industry Revenue (Million) Forecast, by Application 2019 & 2032
- Table 19: Rest of Europe Utility Asset Management Industry Revenue (Million) Forecast, by Application 2019 & 2032
- Table 20: Global Utility Asset Management Industry Revenue Million Forecast, by Country 2019 & 2032
- Table 21: China Utility Asset Management Industry Revenue (Million) Forecast, by Application 2019 & 2032
- Table 22: Japan Utility Asset Management Industry Revenue (Million) Forecast, by Application 2019 & 2032
- Table 23: India Utility Asset Management Industry Revenue (Million) Forecast, by Application 2019 & 2032
- Table 24: South Korea Utility Asset Management Industry Revenue (Million) Forecast, by Application 2019 & 2032
- Table 25: Southeast Asia Utility Asset Management Industry Revenue (Million) Forecast, by Application 2019 & 2032
- Table 26: Australia Utility Asset Management Industry Revenue (Million) Forecast, by Application 2019 & 2032
- Table 27: Indonesia Utility Asset Management Industry Revenue (Million) Forecast, by Application 2019 & 2032
- Table 28: Phillipes Utility Asset Management Industry Revenue (Million) Forecast, by Application 2019 & 2032
- Table 29: Singapore Utility Asset Management Industry Revenue (Million) Forecast, by Application 2019 & 2032
- Table 30: Thailandc Utility Asset Management Industry Revenue (Million) Forecast, by Application 2019 & 2032
- Table 31: Rest of Asia Pacific Utility Asset Management Industry Revenue (Million) Forecast, by Application 2019 & 2032
- Table 32: Global Utility Asset Management Industry Revenue Million Forecast, by Country 2019 & 2032
- Table 33: Brazil Utility Asset Management Industry Revenue (Million) Forecast, by Application 2019 & 2032
- Table 34: Argentina Utility Asset Management Industry Revenue (Million) Forecast, by Application 2019 & 2032
- Table 35: Peru Utility Asset Management Industry Revenue (Million) Forecast, by Application 2019 & 2032
- Table 36: Chile Utility Asset Management Industry Revenue (Million) Forecast, by Application 2019 & 2032
- Table 37: Colombia Utility Asset Management Industry Revenue (Million) Forecast, by Application 2019 & 2032
- Table 38: Ecuador Utility Asset Management Industry Revenue (Million) Forecast, by Application 2019 & 2032
- Table 39: Venezuela Utility Asset Management Industry Revenue (Million) Forecast, by Application 2019 & 2032
- Table 40: Rest of South America Utility Asset Management Industry Revenue (Million) Forecast, by Application 2019 & 2032
- Table 41: Global Utility Asset Management Industry Revenue Million Forecast, by Country 2019 & 2032
- Table 42: United States Utility Asset Management Industry Revenue (Million) Forecast, by Application 2019 & 2032
- Table 43: Canada Utility Asset Management Industry Revenue (Million) Forecast, by Application 2019 & 2032
- Table 44: Mexico Utility Asset Management Industry Revenue (Million) Forecast, by Application 2019 & 2032
- Table 45: Global Utility Asset Management Industry Revenue Million Forecast, by Country 2019 & 2032
- Table 46: United Arab Emirates Utility Asset Management Industry Revenue (Million) Forecast, by Application 2019 & 2032
- Table 47: Saudi Arabia Utility Asset Management Industry Revenue (Million) Forecast, by Application 2019 & 2032
- Table 48: South Africa Utility Asset Management Industry Revenue (Million) Forecast, by Application 2019 & 2032
- Table 49: Rest of Middle East and Africa Utility Asset Management Industry Revenue (Million) Forecast, by Application 2019 & 2032
- Table 50: Global Utility Asset Management Industry Revenue Million Forecast, by Application 2019 & 2032
- Table 51: Global Utility Asset Management Industry Revenue Million Forecast, by Utility Type 2019 & 2032
- Table 52: Global Utility Asset Management Industry Revenue Million Forecast, by Country 2019 & 2032
- Table 53: Global Utility Asset Management Industry Revenue Million Forecast, by Application 2019 & 2032
- Table 54: Global Utility Asset Management Industry Revenue Million Forecast, by Utility Type 2019 & 2032
- Table 55: Global Utility Asset Management Industry Revenue Million Forecast, by Country 2019 & 2032
- Table 56: Global Utility Asset Management Industry Revenue Million Forecast, by Application 2019 & 2032
- Table 57: Global Utility Asset Management Industry Revenue Million Forecast, by Utility Type 2019 & 2032
- Table 58: Global Utility Asset Management Industry Revenue Million Forecast, by Country 2019 & 2032
- Table 59: Global Utility Asset Management Industry Revenue Million Forecast, by Application 2019 & 2032
- Table 60: Global Utility Asset Management Industry Revenue Million Forecast, by Utility Type 2019 & 2032
- Table 61: Global Utility Asset Management Industry Revenue Million Forecast, by Country 2019 & 2032
- Table 62: Global Utility Asset Management Industry Revenue Million Forecast, by Application 2019 & 2032
- Table 63: Global Utility Asset Management Industry Revenue Million Forecast, by Utility Type 2019 & 2032
- Table 64: Global Utility Asset Management Industry Revenue Million Forecast, by Country 2019 & 2032
Frequently Asked Questions
1. What is the projected Compound Annual Growth Rate (CAGR) of the Utility Asset Management Industry?
The projected CAGR is approximately > 7.50%.
2. Which companies are prominent players in the Utility Asset Management Industry?
Key companies in the market include Netcontrol Oy *List Not Exhaustive, ABB Ltd, Enetics Inc, Emerson Electric Co, Siemens AG, Aclara Technologies LLC, Lindsey Manufacturing Co, Sentient Energy Inc, General Electric Company, S&C Electric Company.
3. What are the main segments of the Utility Asset Management Industry?
The market segments include Application, Utility Type.
4. Can you provide details about the market size?
The market size is estimated to be USD XX Million as of 2022.
5. What are some drivers contributing to market growth?
4.; Several Government Plans for the Energy Transition in the Region.
6. What are the notable trends driving market growth?
Transformer to Witness Significant Growth.
7. Are there any restraints impacting market growth?
4.; Increasing Adoption of Self-generated Renewable Power in the Residential and Commercial Sectors.
8. Can you provide examples of recent developments in the market?
September 2022: An electricity utility in Seguin, Texas, installed a complete monitoring and control system. The utility installed a SCADA system and integrated it with Outage Management System software, Advanced Metering Infrastructure (AMI) technology, GIS Mapping, and energy efficiency software to improve customer reliability. This system would help the utility to manage the vast and dispersed networks.
9. What pricing options are available for accessing the report?
Pricing options include single-user, multi-user, and enterprise licenses priced at USD 4750, USD 5250, and USD 8750 respectively.
10. Is the market size provided in terms of value or volume?
The market size is provided in terms of value, measured in Million.
11. Are there any specific market keywords associated with the report?
Yes, the market keyword associated with the report is "Utility Asset Management Industry," which aids in identifying and referencing the specific market segment covered.
12. How do I determine which pricing option suits my needs best?
The pricing options vary based on user requirements and access needs. Individual users may opt for single-user licenses, while businesses requiring broader access may choose multi-user or enterprise licenses for cost-effective access to the report.
13. Are there any additional resources or data provided in the Utility Asset Management Industry report?
While the report offers comprehensive insights, it's advisable to review the specific contents or supplementary materials provided to ascertain if additional resources or data are available.
14. How can I stay updated on further developments or reports in the Utility Asset Management Industry?
To stay informed about further developments, trends, and reports in the Utility Asset Management Industry, consider subscribing to industry newsletters, following relevant companies and organizations, or regularly checking reputable industry news sources and publications.
Methodology
Step 1 - Identification of Relevant Samples Size from Population Database


Step 2 - Approaches for Defining Global Market Size (Value, Volume* & Price*)

Note*: In applicable scenarios
Step 3 - Data Sources
Primary Research
- Web Analytics
- Survey Reports
- Research Institute
- Latest Research Reports
- Opinion Leaders
Secondary Research
- Annual Reports
- White Paper
- Latest Press Release
- Industry Association
- Paid Database
- Investor Presentations

Step 4 - Data Triangulation
Involves using different sources of information in order to increase the validity of a study
These sources are likely to be stakeholders in a program - participants, other researchers, program staff, other community members, and so on.
Then we put all data in single framework & apply various statistical tools to find out the dynamic on the market.
During the analysis stage, feedback from the stakeholder groups would be compared to determine areas of agreement as well as areas of divergence
