

Key Insights
The global Water Treatment Chemicals market for the Oil and Gas industry is experiencing robust growth, projected to maintain a Compound Annual Growth Rate (CAGR) exceeding 4% from 2025 to 2033. This expansion is driven by several key factors. Firstly, stringent environmental regulations worldwide are compelling oil and gas companies to adopt advanced water treatment technologies to minimize their environmental footprint. This includes reducing water consumption, treating produced water effectively, and preventing pollution. Secondly, the increasing complexity of oil and gas extraction processes, particularly in challenging environments like deepwater and unconventional resources, necessitate the use of specialized and high-performance water treatment chemicals. Furthermore, the growing demand for enhanced oil recovery (EOR) techniques, which often involve water injection, further fuels the market's expansion. Finally, technological advancements leading to the development of more efficient and eco-friendly water treatment chemicals are contributing to market growth. The market is segmented by chemical type, including scale and corrosion inhibitors, biocides, defoamers, flocculants, demulsifiers, and oxygen scavengers, each catering to specific needs within the oil and gas production lifecycle.
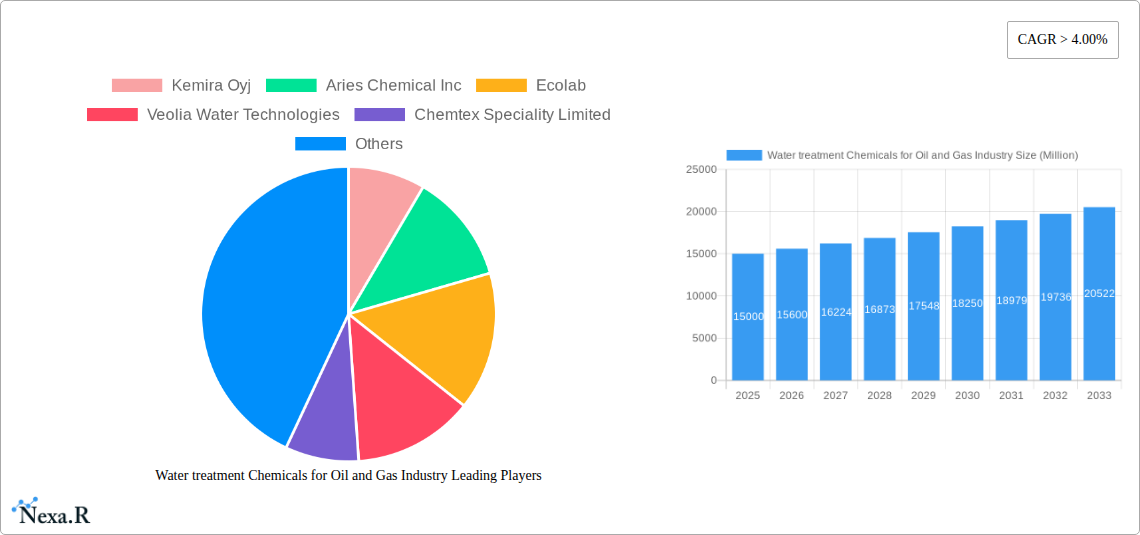
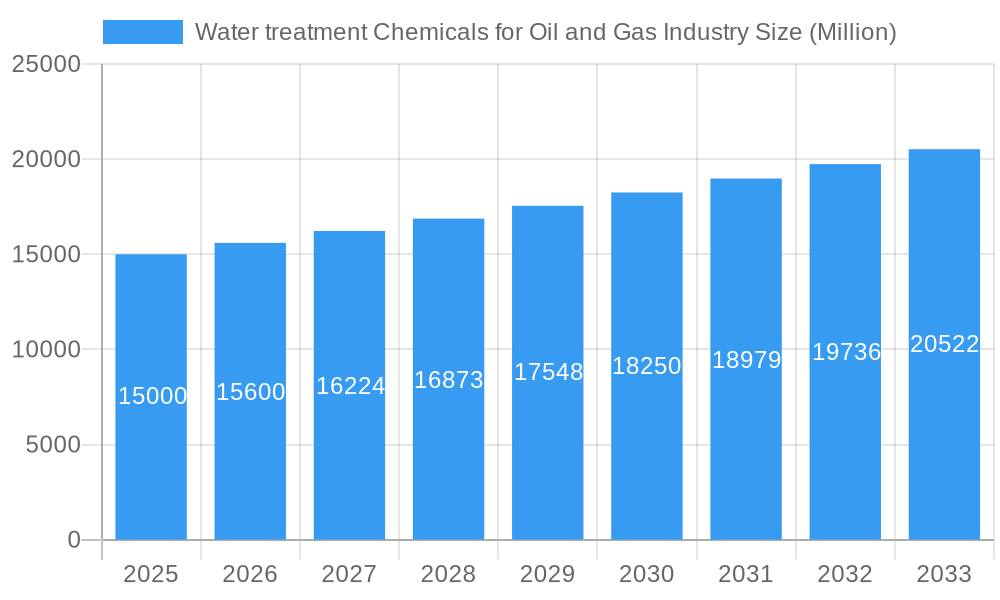
Water treatment Chemicals for Oil and Gas Industry Market Size (In Billion)
Major players in this market include established chemical giants and specialized water treatment companies. Competition is fierce, with companies focusing on product innovation, strategic partnerships, and geographical expansion to gain market share. Regional variations exist, with regions like Asia-Pacific (driven by rapid industrialization and increasing oil and gas production in countries like China and India) exhibiting significant growth potential. North America and Europe, while mature markets, continue to contribute substantially due to established oil and gas operations and a strong focus on environmental compliance. The market’s future trajectory hinges on continued investment in research and development, stricter environmental regulations, fluctuating oil prices, and the overall growth of the oil and gas industry itself. The market's evolution will likely see a shift towards more sustainable and environmentally responsible water treatment solutions, further driving innovation and adoption within the sector.
Water treatment Chemicals for Oil and Gas Industry Company Market Share
Water Treatment Chemicals for Oil and Gas Industry: A Comprehensive Market Report (2019-2033)
This comprehensive report provides an in-depth analysis of the Water Treatment Chemicals market for the Oil and Gas industry, offering invaluable insights for industry professionals, investors, and strategic decision-makers. The report covers the period from 2019 to 2033, with a focus on the forecast period from 2025 to 2033 and a base year of 2025. The market is segmented by type, revealing key growth drivers and challenges across various regions.
Water treatment Chemicals for Oil and Gas Industry Market Dynamics & Structure
This section analyzes the competitive landscape, technological advancements, and regulatory influences shaping the water treatment chemicals market within the oil and gas sector. We examine market concentration, highlighting the key players and their respective market shares (estimated at xx Million units in 2025). Technological innovation, particularly in sustainable and environmentally friendly solutions, is a crucial driver. Regulatory frameworks concerning water discharge and environmental protection significantly influence market dynamics. The report explores the prevalence of mergers and acquisitions (M&A) activities and their impact on market consolidation. Substitute products and their competitive pressures are also assessed. End-user demographics within the oil and gas industry, including exploration & production, refining, and transportation, are analyzed to understand demand patterns.
- Market Concentration: Highly concentrated with top 10 players holding an estimated xx% market share in 2025.
- Technological Innovation: Driven by the need for more efficient, environmentally friendly, and cost-effective solutions. Barriers to innovation include high R&D costs and stringent regulatory approvals.
- Regulatory Framework: Stringent environmental regulations are driving demand for eco-friendly water treatment chemicals. Compliance costs represent a significant challenge for smaller players.
- M&A Activity: Significant M&A activity observed in recent years, with a total deal volume estimated at xx Million units between 2019 and 2024. This consolidation trend is expected to continue.
- Competitive Substitutes: Limited direct substitutes, but alternative treatment technologies (e.g., membrane filtration) pose indirect competition.
Water treatment Chemicals for Oil and Gas Industry Growth Trends & Insights
The global oil and gas industry is undergoing a significant transformation, with water management and treatment emerging as critical components for both operational efficiency and environmental stewardship. This section provides an in-depth analysis of the market dynamics, examining the evolution of market size, the pace of adoption of advanced water treatment solutions, and the impact of technological innovations and shifting consumer preferences. By leveraging comprehensive data and expert industry insights, we offer a holistic view of past, present, and anticipated future market trends within the oil and gas water treatment chemicals sector.
Our analysis meticulously considers key influencing factors such as the escalating global demand for oil and gas, the increasing imperative to adhere to stringent environmental regulations, and the continuous drive for technological advancements that promise enhanced operational efficiency and greater sustainability. We present specific metrics, including the Compound Annual Growth Rate (CAGR) and market penetration rates, to furnish quantifiable insights into the market's forward trajectory. The overall market size is projected to reach [Insert Specific Number] Million units by 2033, demonstrating a robust CAGR of [Insert Specific Percentage]% during the forecast period.
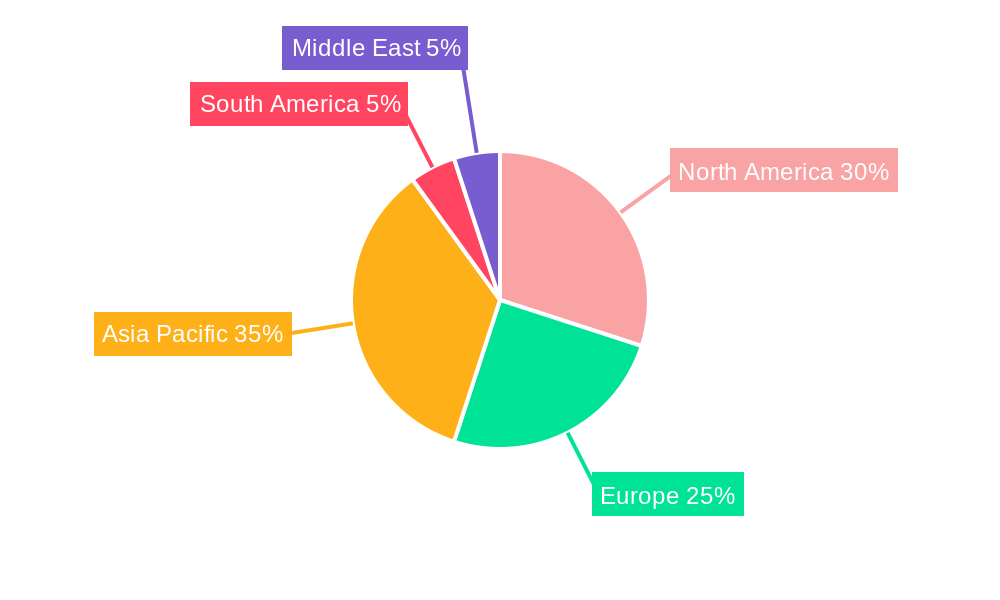
Dominant Regions, Countries, or Segments in Water treatment Chemicals for Oil and Gas Industry
This section identifies the leading geographic regions and product segments within the oil and gas water treatment chemicals market. Analysis focuses on market share, growth potential, and key drivers specific to each region and segment. We examine the dominance of various segments, including: Scale and Corrosion Inhibitors, Biocides and Disinfectants, Defoamers and Defoaming Agents, Flocculants and Coagulants, Demulsifiers, Oxygen Scavengers, and Other Types (Emulsion Breakers, Flow Enhancers, Deoilers, etc.). Factors driving regional dominance include economic growth, infrastructure development, and regulatory policies. (600 words of detailed analysis would follow here.) North America and the Middle East are expected to be the leading regions, driven by significant oil and gas production activities. Scale and Corrosion Inhibitors are projected to remain the largest segment.
- Key Drivers for North America: Strong oil and gas production, stringent environmental regulations, and technological advancements.
- Key Drivers for the Middle East: Large-scale oil and gas projects, rapid industrialization, and government investments in infrastructure.
Water treatment Chemicals for Oil and Gas Industry Product Landscape
This section details product innovations, highlighting unique selling propositions (USPs) and technological advancements in water treatment chemicals for the oil and gas industry. The analysis covers applications and performance metrics of various chemicals, focusing on their efficiency, cost-effectiveness, and environmental impact. New product developments are characterized by enhanced performance, improved sustainability, and reduced environmental footprint. (100-150 words of detailed analysis would follow here.)
Key Drivers, Barriers & Challenges in Water treatment Chemicals for Oil and Gas Industry
The expansion of the water treatment chemicals market within the oil and gas sector is shaped by a complex interplay of growth stimulants and restraining forces. Understanding these elements is crucial for strategic planning and market navigation.
Key Drivers:
- Increased Exploration and Production Activities: Growing global energy demand fuels higher oil and gas production, necessitating more robust water management strategies.
- Environmental Stewardship and Regulatory Compliance: A heightened global awareness of environmental impact and increasingly stringent regulations worldwide are pushing the industry towards advanced, sustainable water treatment solutions.
- Technological Innovations and Enhanced Efficiency: Continuous research and development in chemical formulations are leading to more effective, cost-efficient, and environmentally benign treatment solutions.
- Growth in Offshore and Unconventional Resources: The expansion of operations in challenging offshore environments and unconventional extraction methods (like fracking) requires specialized and high-performance water treatment chemicals.
- Water Scarcity and Reuse Initiatives: In water-stressed regions, the focus on water conservation and recycling further amplifies the demand for effective water treatment chemicals.
Challenges:
- Oil Price Volatility: Fluctuations in crude oil prices directly impact investment decisions and capital expenditure in the oil and gas sector, affecting the demand for related services and products.
- Supply Chain Complexities and Raw Material Costs: Global supply chain disruptions and the inherent volatility in the prices of key raw materials can impact the cost and availability of water treatment chemicals.
- Stringent and Evolving Regulatory Landscapes: Navigating and complying with diverse and often changing environmental and safety regulations across different jurisdictions can increase operational costs and complexity.
- Intense Market Competition: The market is characterized by a mix of established global players and agile emerging companies, leading to significant competitive pressures on pricing and innovation.
- Economic Downturns and Geopolitical Instability: Broader economic slowdowns or geopolitical events can dampen energy demand and investment, indirectly affecting the water treatment chemicals market.
Emerging Opportunities in Water treatment Chemicals for Oil and Gas Industry
This section highlights promising avenues for future growth, including untapped markets, innovative applications, and evolving consumer preferences. Opportunities lie in the development of environmentally friendly and sustainable chemicals, the expansion into emerging markets, and the application of advanced technologies for improved water treatment efficiency. (150 words of detailed analysis would follow here.)
Growth Accelerators in the Water treatment Chemicals for Oil and Gas Industry Industry
The trajectory of the water treatment chemicals market in the oil and gas sector is set to be significantly influenced by several forward-looking developments. Technological advancements will play a pivotal role, with ongoing research focused on developing next-generation chemical formulations that not only deliver superior performance in complex operational environments but also minimize environmental footprints. Innovations in areas like smart chemicals, biodegradable options, and low-toxicity formulations will gain prominence. Furthermore, strategic collaborations and partnerships between leading chemical manufacturers and major oil and gas companies will be crucial. These alliances will foster the co-development of bespoke treatment solutions tailored to specific operational needs and challenges, driving deeper integration and mutual benefit. Geographic expansion into emerging markets with substantial oil and gas exploration and production activities, particularly in regions undergoing significant energy infrastructure development, will also serve as a key growth accelerator.
Key Players Shaping the Water treatment Chemicals for Oil and Gas Industry Market
- Kemira Oyj
- Aries Chemical Inc
- Ecolab
- Veolia Water Technologies
- Chemtex Speciality Limited
- Thermax Limited
- Metito
- Kurita Water Industries Ltd
- Buckman
- Italmatch Chemicals SpA
- AECI Water
- BASF SE
- SUEZ
- DuPont
- Ion Exchange
- ChemTreat Inc
- WETICO
- Ovivo
- Solenis
- AES Arabia Ltd
- Avista Technologies Inc
Notable Milestones in Water treatment Chemicals for Oil and Gas Industry Sector
- November 2020: Ovivo's acquisition of ALAR significantly broadened its product offerings and enhanced its market penetration across key regions.
- October 2019: Italmatch Chemicals SpA strengthened its presence in the North American market through the strategic acquisition of Water Science Technologies.
- [Insert Recent Milestone 1]: [Brief description of the milestone and its impact.]
- [Insert Recent Milestone 2]: [Brief description of the milestone and its impact.]
In-Depth Water treatment Chemicals for Oil and Gas Industry Market Outlook
The future of the water treatment chemicals market for the oil and gas industry is promising, driven by sustained growth in oil and gas production, increasing focus on environmental sustainability, and technological innovation. Strategic partnerships, mergers and acquisitions, and expansion into emerging markets will shape the competitive landscape. The market is poised for significant growth in the coming years, presenting lucrative opportunities for both established and emerging players. (150 words of detailed analysis would follow here.)
Water treatment Chemicals for Oil and Gas Industry Segmentation
-
1. Type
- 1.1. Scale and Corrosion Inhibitors
- 1.2. Biocides and Disinfectants
- 1.3. Defoamers and Defoaming Agents
- 1.4. Flocculants and Coagulants
- 1.5. Demulsifiers
- 1.6. Oxygen Scavengers
- 1.7. Other Ty
Water treatment Chemicals for Oil and Gas Industry Segmentation By Geography
-
1. Asia Pacific
- 1.1. China
- 1.2. India
- 1.3. Japan
- 1.4. South Korea
- 1.5. ASEAN Countries
- 1.6. Rest of Asia Pacific
-
2. North America
- 2.1. United States
- 2.2. Canada
- 2.3. Mexico
-
3. Europe
- 3.1. Germany
- 3.2. France
- 3.3. United Kingdom
- 3.4. Italy
- 3.5. Rest of the Europe
-
4. South America
- 4.1. Brazil
- 4.2. Argentina
- 4.3. Rest of South America
- 5. Middle East
-
6. Saudi Arabia
- 6.1. South Africa
- 6.2. Rest of Middle East
Water treatment Chemicals for Oil and Gas Industry Regional Market Share
Geographic Coverage of Water treatment Chemicals for Oil and Gas Industry
Water treatment Chemicals for Oil and Gas Industry REPORT HIGHLIGHTS
| Aspects | Details |
|---|---|
| Study Period | 2020-2034 |
| Base Year | 2025 |
| Estimated Year | 2026 |
| Forecast Period | 2026-2034 |
| Historical Period | 2020-2025 |
| Growth Rate | CAGR of 4.2% from 2020-2034 |
| Segmentation |
|
Table of Contents
- 1. Introduction
- 1.1. Research Scope
- 1.2. Market Segmentation
- 1.3. Research Objective
- 1.4. Definitions and Assumptions
- 2. Executive Summary
- 2.1. Market Snapshot
- 3. Market Dynamics
- 3.1. Market Drivers
- 3.2. Market Restrains
- 3.3. Market Trends
- 3.4. Market Opportunities
- 4. Market Factor Analysis
- 4.1. Porters Five Forces
- 4.1.1. Bargaining Power of Suppliers
- 4.1.2. Bargaining Power of Buyers
- 4.1.3. Threat of New Entrants
- 4.1.4. Threat of Substitutes
- 4.1.5. Competitive Rivalry
- 4.2. PESTEL analysis
- 4.3. BCG Analysis
- 4.3.1. Stars (High Growth, High Market Share)
- 4.3.2. Cash Cows (Low Growth, High Market Share)
- 4.3.3. Question Mark (High Growth, Low Market Share)
- 4.3.4. Dogs (Low Growth, Low Market Share)
- 4.4. Ansoff Matrix Analysis
- 4.5. Supply Chain Analysis
- 4.6. Regulatory Landscape
- 4.7. Current Market Potential and Opportunity Assessment (TAM–SAM–SOM Framework)
- 4.8. NRP Analyst Note
- 4.1. Porters Five Forces
- 5. Market Analysis, Insights and Forecast 2021-2033
- 5.1. Market Analysis, Insights and Forecast - by Type
- 5.1.1. Scale and Corrosion Inhibitors
- 5.1.2. Biocides and Disinfectants
- 5.1.3. Defoamers and Defoaming Agents
- 5.1.4. Flocculants and Coagulants
- 5.1.5. Demulsifiers
- 5.1.6. Oxygen Scavengers
- 5.1.7. Other Ty
- 5.2. Market Analysis, Insights and Forecast - by Region
- 5.2.1. Asia Pacific
- 5.2.2. North America
- 5.2.3. Europe
- 5.2.4. South America
- 5.2.5. Middle East
- 5.2.6. Saudi Arabia
- 5.1. Market Analysis, Insights and Forecast - by Type
- 6. Global Water treatment Chemicals for Oil and Gas Industry Analysis, Insights and Forecast, 2021-2033
- 6.1. Market Analysis, Insights and Forecast - by Type
- 6.1.1. Scale and Corrosion Inhibitors
- 6.1.2. Biocides and Disinfectants
- 6.1.3. Defoamers and Defoaming Agents
- 6.1.4. Flocculants and Coagulants
- 6.1.5. Demulsifiers
- 6.1.6. Oxygen Scavengers
- 6.1.7. Other Ty
- 6.1. Market Analysis, Insights and Forecast - by Type
- 7. Asia Pacific Water treatment Chemicals for Oil and Gas Industry Analysis, Insights and Forecast, 2020-2032
- 7.1. Market Analysis, Insights and Forecast - by Type
- 7.1.1. Scale and Corrosion Inhibitors
- 7.1.2. Biocides and Disinfectants
- 7.1.3. Defoamers and Defoaming Agents
- 7.1.4. Flocculants and Coagulants
- 7.1.5. Demulsifiers
- 7.1.6. Oxygen Scavengers
- 7.1.7. Other Ty
- 7.1. Market Analysis, Insights and Forecast - by Type
- 8. North America Water treatment Chemicals for Oil and Gas Industry Analysis, Insights and Forecast, 2020-2032
- 8.1. Market Analysis, Insights and Forecast - by Type
- 8.1.1. Scale and Corrosion Inhibitors
- 8.1.2. Biocides and Disinfectants
- 8.1.3. Defoamers and Defoaming Agents
- 8.1.4. Flocculants and Coagulants
- 8.1.5. Demulsifiers
- 8.1.6. Oxygen Scavengers
- 8.1.7. Other Ty
- 8.1. Market Analysis, Insights and Forecast - by Type
- 9. Europe Water treatment Chemicals for Oil and Gas Industry Analysis, Insights and Forecast, 2020-2032
- 9.1. Market Analysis, Insights and Forecast - by Type
- 9.1.1. Scale and Corrosion Inhibitors
- 9.1.2. Biocides and Disinfectants
- 9.1.3. Defoamers and Defoaming Agents
- 9.1.4. Flocculants and Coagulants
- 9.1.5. Demulsifiers
- 9.1.6. Oxygen Scavengers
- 9.1.7. Other Ty
- 9.1. Market Analysis, Insights and Forecast - by Type
- 10. South America Water treatment Chemicals for Oil and Gas Industry Analysis, Insights and Forecast, 2020-2032
- 10.1. Market Analysis, Insights and Forecast - by Type
- 10.1.1. Scale and Corrosion Inhibitors
- 10.1.2. Biocides and Disinfectants
- 10.1.3. Defoamers and Defoaming Agents
- 10.1.4. Flocculants and Coagulants
- 10.1.5. Demulsifiers
- 10.1.6. Oxygen Scavengers
- 10.1.7. Other Ty
- 10.1. Market Analysis, Insights and Forecast - by Type
- 11. Middle East Water treatment Chemicals for Oil and Gas Industry Analysis, Insights and Forecast, 2020-2032
- 11.1. Market Analysis, Insights and Forecast - by Type
- 11.1.1. Scale and Corrosion Inhibitors
- 11.1.2. Biocides and Disinfectants
- 11.1.3. Defoamers and Defoaming Agents
- 11.1.4. Flocculants and Coagulants
- 11.1.5. Demulsifiers
- 11.1.6. Oxygen Scavengers
- 11.1.7. Other Ty
- 11.1. Market Analysis, Insights and Forecast - by Type
- 12. Saudi Arabia Water treatment Chemicals for Oil and Gas Industry Analysis, Insights and Forecast, 2020-2032
- 12.1. Market Analysis, Insights and Forecast - by Type
- 12.1.1. Scale and Corrosion Inhibitors
- 12.1.2. Biocides and Disinfectants
- 12.1.3. Defoamers and Defoaming Agents
- 12.1.4. Flocculants and Coagulants
- 12.1.5. Demulsifiers
- 12.1.6. Oxygen Scavengers
- 12.1.7. Other Ty
- 12.1. Market Analysis, Insights and Forecast - by Type
- 13. Competitive Analysis
- 13.1. Company Profiles
- 13.1.1 Kemira Oyj
- 13.1.1.1. Company Overview
- 13.1.1.2. Products
- 13.1.1.3. Company Financials
- 13.1.1.4. SWOT Analysis
- 13.1.2 Aries Chemical Inc
- 13.1.2.1. Company Overview
- 13.1.2.2. Products
- 13.1.2.3. Company Financials
- 13.1.2.4. SWOT Analysis
- 13.1.3 Ecolab
- 13.1.3.1. Company Overview
- 13.1.3.2. Products
- 13.1.3.3. Company Financials
- 13.1.3.4. SWOT Analysis
- 13.1.4 Veolia Water Technologies
- 13.1.4.1. Company Overview
- 13.1.4.2. Products
- 13.1.4.3. Company Financials
- 13.1.4.4. SWOT Analysis
- 13.1.5 Chemtex Speciality Limited
- 13.1.5.1. Company Overview
- 13.1.5.2. Products
- 13.1.5.3. Company Financials
- 13.1.5.4. SWOT Analysis
- 13.1.6 Thermax Limited
- 13.1.6.1. Company Overview
- 13.1.6.2. Products
- 13.1.6.3. Company Financials
- 13.1.6.4. SWOT Analysis
- 13.1.7 Metito
- 13.1.7.1. Company Overview
- 13.1.7.2. Products
- 13.1.7.3. Company Financials
- 13.1.7.4. SWOT Analysis
- 13.1.8 Kurita Water Industries Ltd
- 13.1.8.1. Company Overview
- 13.1.8.2. Products
- 13.1.8.3. Company Financials
- 13.1.8.4. SWOT Analysis
- 13.1.9 Buckman
- 13.1.9.1. Company Overview
- 13.1.9.2. Products
- 13.1.9.3. Company Financials
- 13.1.9.4. SWOT Analysis
- 13.1.10 Italmatch Chemicals SpA
- 13.1.10.1. Company Overview
- 13.1.10.2. Products
- 13.1.10.3. Company Financials
- 13.1.10.4. SWOT Analysis
- 13.1.11 AECI Water
- 13.1.11.1. Company Overview
- 13.1.11.2. Products
- 13.1.11.3. Company Financials
- 13.1.11.4. SWOT Analysis
- 13.1.12 BASF SE
- 13.1.12.1. Company Overview
- 13.1.12.2. Products
- 13.1.12.3. Company Financials
- 13.1.12.4. SWOT Analysis
- 13.1.13 SUEZ
- 13.1.13.1. Company Overview
- 13.1.13.2. Products
- 13.1.13.3. Company Financials
- 13.1.13.4. SWOT Analysis
- 13.1.14 DuPont
- 13.1.14.1. Company Overview
- 13.1.14.2. Products
- 13.1.14.3. Company Financials
- 13.1.14.4. SWOT Analysis
- 13.1.15 Ion Exchange
- 13.1.15.1. Company Overview
- 13.1.15.2. Products
- 13.1.15.3. Company Financials
- 13.1.15.4. SWOT Analysis
- 13.1.16 ChemTreat Inc
- 13.1.16.1. Company Overview
- 13.1.16.2. Products
- 13.1.16.3. Company Financials
- 13.1.16.4. SWOT Analysis
- 13.1.17 WETICO*List Not Exhaustive
- 13.1.17.1. Company Overview
- 13.1.17.2. Products
- 13.1.17.3. Company Financials
- 13.1.17.4. SWOT Analysis
- 13.1.18 Ovivo
- 13.1.18.1. Company Overview
- 13.1.18.2. Products
- 13.1.18.3. Company Financials
- 13.1.18.4. SWOT Analysis
- 13.1.19 Solenis
- 13.1.19.1. Company Overview
- 13.1.19.2. Products
- 13.1.19.3. Company Financials
- 13.1.19.4. SWOT Analysis
- 13.1.20 AES Arabia Ltd
- 13.1.20.1. Company Overview
- 13.1.20.2. Products
- 13.1.20.3. Company Financials
- 13.1.20.4. SWOT Analysis
- 13.1.21 Avista Technologies Inc
- 13.1.21.1. Company Overview
- 13.1.21.2. Products
- 13.1.21.3. Company Financials
- 13.1.21.4. SWOT Analysis
- 13.1.1 Kemira Oyj
- 13.2. Market Entropy
- 13.2.1 Company's Key Areas Served
- 13.2.2 Recent Developments
- 13.3. Company Market Share Analysis 2025
- 13.3.1 Top 5 Companies Market Share Analysis
- 13.3.2 Top 3 Companies Market Share Analysis
- 13.4. List of Potential Customers
- 14. Research Methodology
List of Figures
- Figure 1: Global Water treatment Chemicals for Oil and Gas Industry Revenue Breakdown (billion, %) by Region 2025 & 2033
- Figure 2: Asia Pacific Water treatment Chemicals for Oil and Gas Industry Revenue (billion), by Type 2025 & 2033
- Figure 3: Asia Pacific Water treatment Chemicals for Oil and Gas Industry Revenue Share (%), by Type 2025 & 2033
- Figure 4: Asia Pacific Water treatment Chemicals for Oil and Gas Industry Revenue (billion), by Country 2025 & 2033
- Figure 5: Asia Pacific Water treatment Chemicals for Oil and Gas Industry Revenue Share (%), by Country 2025 & 2033
- Figure 6: North America Water treatment Chemicals for Oil and Gas Industry Revenue (billion), by Type 2025 & 2033
- Figure 7: North America Water treatment Chemicals for Oil and Gas Industry Revenue Share (%), by Type 2025 & 2033
- Figure 8: North America Water treatment Chemicals for Oil and Gas Industry Revenue (billion), by Country 2025 & 2033
- Figure 9: North America Water treatment Chemicals for Oil and Gas Industry Revenue Share (%), by Country 2025 & 2033
- Figure 10: Europe Water treatment Chemicals for Oil and Gas Industry Revenue (billion), by Type 2025 & 2033
- Figure 11: Europe Water treatment Chemicals for Oil and Gas Industry Revenue Share (%), by Type 2025 & 2033
- Figure 12: Europe Water treatment Chemicals for Oil and Gas Industry Revenue (billion), by Country 2025 & 2033
- Figure 13: Europe Water treatment Chemicals for Oil and Gas Industry Revenue Share (%), by Country 2025 & 2033
- Figure 14: South America Water treatment Chemicals for Oil and Gas Industry Revenue (billion), by Type 2025 & 2033
- Figure 15: South America Water treatment Chemicals for Oil and Gas Industry Revenue Share (%), by Type 2025 & 2033
- Figure 16: South America Water treatment Chemicals for Oil and Gas Industry Revenue (billion), by Country 2025 & 2033
- Figure 17: South America Water treatment Chemicals for Oil and Gas Industry Revenue Share (%), by Country 2025 & 2033
- Figure 18: Middle East Water treatment Chemicals for Oil and Gas Industry Revenue (billion), by Type 2025 & 2033
- Figure 19: Middle East Water treatment Chemicals for Oil and Gas Industry Revenue Share (%), by Type 2025 & 2033
- Figure 20: Middle East Water treatment Chemicals for Oil and Gas Industry Revenue (billion), by Country 2025 & 2033
- Figure 21: Middle East Water treatment Chemicals for Oil and Gas Industry Revenue Share (%), by Country 2025 & 2033
- Figure 22: Saudi Arabia Water treatment Chemicals for Oil and Gas Industry Revenue (billion), by Type 2025 & 2033
- Figure 23: Saudi Arabia Water treatment Chemicals for Oil and Gas Industry Revenue Share (%), by Type 2025 & 2033
- Figure 24: Saudi Arabia Water treatment Chemicals for Oil and Gas Industry Revenue (billion), by Country 2025 & 2033
- Figure 25: Saudi Arabia Water treatment Chemicals for Oil and Gas Industry Revenue Share (%), by Country 2025 & 2033
List of Tables
- Table 1: Global Water treatment Chemicals for Oil and Gas Industry Revenue billion Forecast, by Type 2020 & 2033
- Table 2: Global Water treatment Chemicals for Oil and Gas Industry Revenue billion Forecast, by Region 2020 & 2033
- Table 3: Global Water treatment Chemicals for Oil and Gas Industry Revenue billion Forecast, by Type 2020 & 2033
- Table 4: Global Water treatment Chemicals for Oil and Gas Industry Revenue billion Forecast, by Country 2020 & 2033
- Table 5: China Water treatment Chemicals for Oil and Gas Industry Revenue (billion) Forecast, by Application 2020 & 2033
- Table 6: India Water treatment Chemicals for Oil and Gas Industry Revenue (billion) Forecast, by Application 2020 & 2033
- Table 7: Japan Water treatment Chemicals for Oil and Gas Industry Revenue (billion) Forecast, by Application 2020 & 2033
- Table 8: South Korea Water treatment Chemicals for Oil and Gas Industry Revenue (billion) Forecast, by Application 2020 & 2033
- Table 9: ASEAN Countries Water treatment Chemicals for Oil and Gas Industry Revenue (billion) Forecast, by Application 2020 & 2033
- Table 10: Rest of Asia Pacific Water treatment Chemicals for Oil and Gas Industry Revenue (billion) Forecast, by Application 2020 & 2033
- Table 11: Global Water treatment Chemicals for Oil and Gas Industry Revenue billion Forecast, by Type 2020 & 2033
- Table 12: Global Water treatment Chemicals for Oil and Gas Industry Revenue billion Forecast, by Country 2020 & 2033
- Table 13: United States Water treatment Chemicals for Oil and Gas Industry Revenue (billion) Forecast, by Application 2020 & 2033
- Table 14: Canada Water treatment Chemicals for Oil and Gas Industry Revenue (billion) Forecast, by Application 2020 & 2033
- Table 15: Mexico Water treatment Chemicals for Oil and Gas Industry Revenue (billion) Forecast, by Application 2020 & 2033
- Table 16: Global Water treatment Chemicals for Oil and Gas Industry Revenue billion Forecast, by Type 2020 & 2033
- Table 17: Global Water treatment Chemicals for Oil and Gas Industry Revenue billion Forecast, by Country 2020 & 2033
- Table 18: Germany Water treatment Chemicals for Oil and Gas Industry Revenue (billion) Forecast, by Application 2020 & 2033
- Table 19: France Water treatment Chemicals for Oil and Gas Industry Revenue (billion) Forecast, by Application 2020 & 2033
- Table 20: United Kingdom Water treatment Chemicals for Oil and Gas Industry Revenue (billion) Forecast, by Application 2020 & 2033
- Table 21: Italy Water treatment Chemicals for Oil and Gas Industry Revenue (billion) Forecast, by Application 2020 & 2033
- Table 22: Rest of the Europe Water treatment Chemicals for Oil and Gas Industry Revenue (billion) Forecast, by Application 2020 & 2033
- Table 23: Global Water treatment Chemicals for Oil and Gas Industry Revenue billion Forecast, by Type 2020 & 2033
- Table 24: Global Water treatment Chemicals for Oil and Gas Industry Revenue billion Forecast, by Country 2020 & 2033
- Table 25: Brazil Water treatment Chemicals for Oil and Gas Industry Revenue (billion) Forecast, by Application 2020 & 2033
- Table 26: Argentina Water treatment Chemicals for Oil and Gas Industry Revenue (billion) Forecast, by Application 2020 & 2033
- Table 27: Rest of South America Water treatment Chemicals for Oil and Gas Industry Revenue (billion) Forecast, by Application 2020 & 2033
- Table 28: Global Water treatment Chemicals for Oil and Gas Industry Revenue billion Forecast, by Type 2020 & 2033
- Table 29: Global Water treatment Chemicals for Oil and Gas Industry Revenue billion Forecast, by Country 2020 & 2033
- Table 30: Global Water treatment Chemicals for Oil and Gas Industry Revenue billion Forecast, by Type 2020 & 2033
- Table 31: Global Water treatment Chemicals for Oil and Gas Industry Revenue billion Forecast, by Country 2020 & 2033
- Table 32: South Africa Water treatment Chemicals for Oil and Gas Industry Revenue (billion) Forecast, by Application 2020 & 2033
- Table 33: Rest of Middle East Water treatment Chemicals for Oil and Gas Industry Revenue (billion) Forecast, by Application 2020 & 2033
Frequently Asked Questions
1. What is the projected Compound Annual Growth Rate (CAGR) of the Water treatment Chemicals for Oil and Gas Industry?
The projected CAGR is approximately 4.2%.
2. Which companies are prominent players in the Water treatment Chemicals for Oil and Gas Industry?
Key companies in the market include Kemira Oyj, Aries Chemical Inc, Ecolab, Veolia Water Technologies, Chemtex Speciality Limited, Thermax Limited, Metito, Kurita Water Industries Ltd, Buckman, Italmatch Chemicals SpA, AECI Water, BASF SE, SUEZ, DuPont, Ion Exchange, ChemTreat Inc, WETICO*List Not Exhaustive, Ovivo, Solenis, AES Arabia Ltd, Avista Technologies Inc.
3. What are the main segments of the Water treatment Chemicals for Oil and Gas Industry?
The market segments include Type.
4. Can you provide details about the market size?
The market size is estimated to be USD 35.8 billion as of 2022.
5. What are some drivers contributing to market growth?
Rising Shale Gas Extraction Leading to Water Contamination; Expansion of Oil Refineries Across the World.
6. What are the notable trends driving market growth?
Scale and Corrosion Inhibitors to Dominate the Market.
7. Are there any restraints impacting market growth?
Availability of Technological Alternatives for Water Treatment; Unfavorable Conditions Arising due to the Impact of COVID-19.
8. Can you provide examples of recent developments in the market?
In November 2020, Ovivo announced the acquisition of ALAR, a manufacturer and provider of wastewater treatment chemicals and systems, enhancing its product portfolio and business.
9. What pricing options are available for accessing the report?
Pricing options include single-user, multi-user, and enterprise licenses priced at USD 4750, USD 5250, and USD 8750 respectively.
10. Is the market size provided in terms of value or volume?
The market size is provided in terms of value, measured in billion.
11. Are there any specific market keywords associated with the report?
Yes, the market keyword associated with the report is "Water treatment Chemicals for Oil and Gas Industry," which aids in identifying and referencing the specific market segment covered.
12. How do I determine which pricing option suits my needs best?
The pricing options vary based on user requirements and access needs. Individual users may opt for single-user licenses, while businesses requiring broader access may choose multi-user or enterprise licenses for cost-effective access to the report.
13. Are there any additional resources or data provided in the Water treatment Chemicals for Oil and Gas Industry report?
While the report offers comprehensive insights, it's advisable to review the specific contents or supplementary materials provided to ascertain if additional resources or data are available.
14. How can I stay updated on further developments or reports in the Water treatment Chemicals for Oil and Gas Industry?
To stay informed about further developments, trends, and reports in the Water treatment Chemicals for Oil and Gas Industry, consider subscribing to industry newsletters, following relevant companies and organizations, or regularly checking reputable industry news sources and publications.
Methodology
Step 1 - Identification of Relevant Samples Size from Population Database


Step 2 - Approaches for Defining Global Market Size (Value, Volume* & Price*)

Note*: In applicable scenarios
Step 3 - Data Sources
Primary Research
- Web Analytics
- Survey Reports
- Research Institute
- Latest Research Reports
- Opinion Leaders
Secondary Research
- Annual Reports
- White Paper
- Latest Press Release
- Industry Association
- Paid Database
- Investor Presentations

Step 4 - Data Triangulation
Involves using different sources of information in order to increase the validity of a study
These sources are likely to be stakeholders in a program - participants, other researchers, program staff, other community members, and so on.
Then we put all data in single framework & apply various statistical tools to find out the dynamic on the market.
During the analysis stage, feedback from the stakeholder groups would be compared to determine areas of agreement as well as areas of divergence