

Key Insights
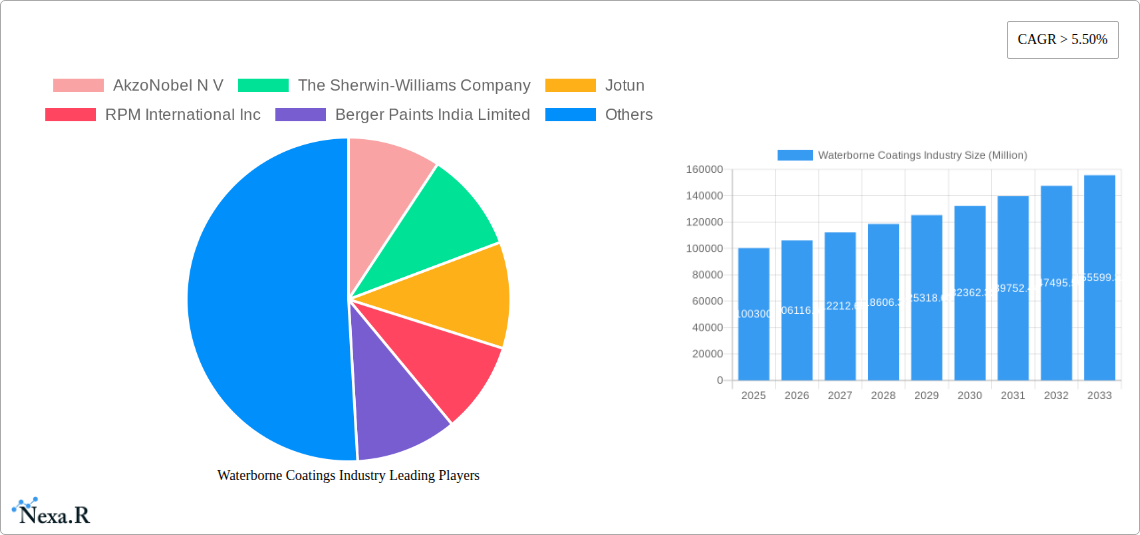
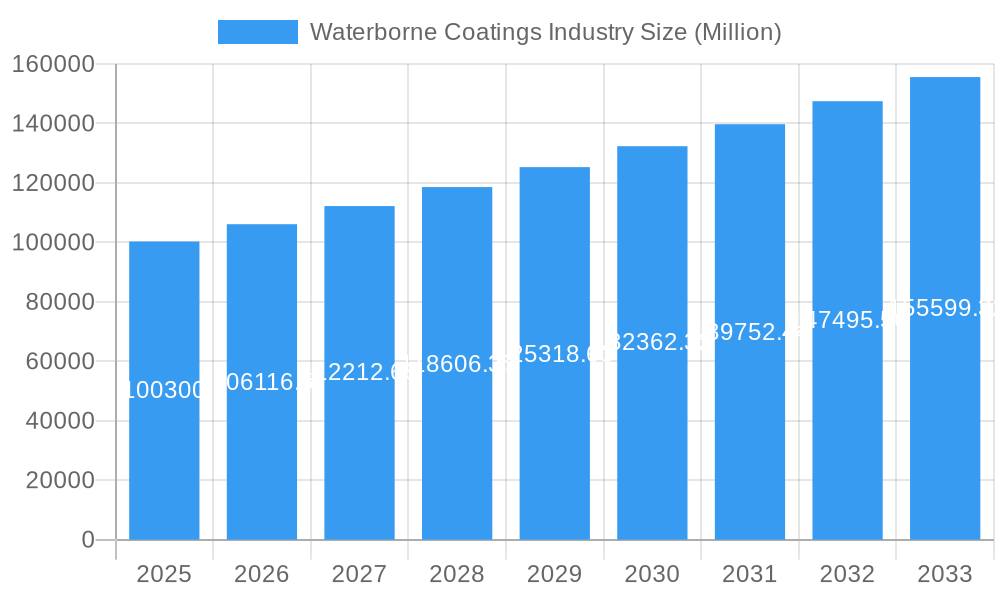
The global waterborne coatings market, valued at $100,300 million in 2025, is projected to experience robust growth, driven by a Compound Annual Growth Rate (CAGR) exceeding 5.50% from 2025 to 2033. This expansion is fueled by several key factors. The increasing demand for eco-friendly and sustainable coatings across various end-use industries, including building and construction, automotive, and industrial applications, is a major catalyst. Stringent environmental regulations globally are pushing the adoption of low-VOC (volatile organic compound) waterborne coatings, further boosting market growth. Technological advancements leading to improved performance characteristics, such as enhanced durability, faster drying times, and better color retention, are also contributing to increased market penetration. Acrylic resins currently dominate the resin type segment due to their versatility and cost-effectiveness, although epoxy, polyurethane, and polyester resins are experiencing significant growth due to their superior performance properties in specific applications. Geographically, the Asia Pacific region, particularly China and India, is expected to lead the market expansion due to rapid infrastructure development and increasing industrialization. North America and Europe also contribute significantly, driven by renovation projects and robust automotive sectors.
Waterborne Coatings Industry Market Size (In Billion)
The market, however, faces certain restraints. Fluctuations in raw material prices, particularly for resins and pigments, can impact profitability. Competition from solvent-based coatings, particularly in niche applications requiring exceptional durability or chemical resistance, remains a challenge. Furthermore, ensuring consistent quality and performance across diverse climate conditions and applications requires continuous innovation and investment in research and development. Despite these challenges, the long-term outlook for the waterborne coatings market remains positive, with continuous growth anticipated throughout the forecast period, driven by the aforementioned growth drivers and the increasing focus on environmental sustainability. The market's diverse segmentations, catering to the varied requirements of different industries and applications, positions it for sustained expansion in the coming years.
Waterborne Coatings Industry Company Market Share
Waterborne Coatings Industry Market Report: 2019-2033
This comprehensive report provides an in-depth analysis of the global waterborne coatings market, offering invaluable insights for industry professionals, investors, and strategic decision-makers. Covering the period from 2019 to 2033, with a base year of 2025, this report meticulously examines market dynamics, growth trends, regional dominance, product landscapes, and key players shaping this dynamic sector. The report utilizes robust data and qualitative analysis to provide a clear and actionable understanding of this crucial market segment.
Waterborne Coatings Industry Market Dynamics & Structure
This section analyzes the intricate dynamics of the waterborne coatings market, encompassing market concentration, technological advancements, regulatory landscapes, competitive dynamics, and end-user trends. We delve into the impact of mergers and acquisitions (M&A) activities on market consolidation and future growth projections. The global market size in 2025 is estimated at $XX Billion.
- Market Concentration: The waterborne coatings industry is characterized by a moderately concentrated market structure, with several major players holding significant market share. The top five players account for approximately xx% of the global market.
- Technological Innovation: Continuous innovation in resin technology, particularly in acrylics and polyurethanes, is a key driver. However, barriers to entry for new technologies remain, particularly related to high R&D costs and regulatory approvals.
- Regulatory Frameworks: Stringent environmental regulations regarding VOC emissions are driving the adoption of waterborne coatings, while differing regulations across regions present both opportunities and challenges.
- Competitive Product Substitutes: Solvent-borne coatings remain a significant competitor, but the environmental benefits and performance improvements of waterborne coatings are steadily eroding this advantage.
- End-User Demographics: Growth is driven by increasing construction activity, particularly in developing economies, and the expanding automotive and industrial sectors.
- M&A Trends: The industry has witnessed a significant number of M&A activities in recent years (XX deals in the past five years), primarily driven by strategic expansion and access to new technologies and markets.
Waterborne Coatings Industry Growth Trends & Insights
This section examines the historical and projected growth trajectory of the waterborne coatings market. We analyze factors contributing to market expansion, adoption rates across different segments, and shifts in consumer preferences. Our analysis reveals a strong growth potential for the waterborne coatings market, particularly in emerging economies. The market is expected to witness a CAGR of xx% during the forecast period (2025-2033).
The analysis considers macro-economic factors, evolving regulatory standards, shifting consumer expectations regarding eco-friendly products, and technological advancements that influence market size, consumer preference, and long-term growth. Specific metrics such as CAGR and market penetration are provided to showcase market evolution, technology adoption, and consumer behavior. The projected market size for 2033 is estimated at $XX Billion.
Dominant Regions, Countries, or Segments in Waterborne Coatings Industry
This section identifies the key regions, countries, and market segments within the waterborne coatings industry exhibiting the most significant growth. Asia Pacific is currently the leading region, driven by robust infrastructure development and industrial expansion. The building and construction sector is the largest end-user industry. Within resin types, acrylics hold the largest market share.
- Key Drivers:
- Asia-Pacific: Rapid urbanization, infrastructure development, and industrial growth are driving demand.
- Building & Construction: High construction activity globally fuels demand.
- Acrylic Resins: Cost-effectiveness, versatility, and superior performance characteristics contribute to their dominance.
- Dominance Factors:
- Strong economic growth and infrastructure development in Asia-Pacific contribute to the region's market leadership.
- The extensive use of waterborne coatings in building and construction projects accounts for the end-user segment's dominance.
- The performance characteristics and cost-effectiveness of acrylic resins establish their significant market share within the resin type segment.
Waterborne Coatings Industry Product Landscape
Waterborne coatings exhibit a diverse product landscape, incorporating a variety of resin types (acrylic, epoxy, polyurethane, etc.), each designed for specific applications (automotive, industrial, wood coatings). Ongoing innovations focus on improved durability, enhanced aesthetics, and reduced environmental impact. New formulations offer superior gloss retention, improved UV resistance, and enhanced scratch resistance. This section details specific product innovations and related performance parameters.
Key Drivers, Barriers & Challenges in Waterborne Coatings Industry
Key Drivers: Stringent environmental regulations limiting volatile organic compounds (VOCs), increasing demand from the construction and automotive industries, and ongoing innovations leading to improved performance and cost-effectiveness are primary drivers of market expansion.
Key Challenges: Fluctuations in raw material prices, intense competition, and the potential for substitution by other coating technologies represent key challenges. Supply chain disruptions caused by geopolitical instability also pose a significant risk, potentially impacting production and pricing.
Emerging Opportunities in Waterborne Coatings Industry
Emerging opportunities lie in expanding into untapped markets, particularly in developing economies, and exploring new applications within existing markets. The focus on sustainable and environmentally friendly solutions presents a significant opportunity, driving the development of bio-based waterborne coatings.
Growth Accelerators in the Waterborne Coatings Industry Industry
Strategic partnerships, collaborative R&D efforts, and technological breakthroughs in resin formulations and application technologies are key growth catalysts. Expanding into high-growth markets and focusing on niche applications (e.g., high-performance coatings) will also fuel market expansion.
Key Players Shaping the Waterborne Coatings Industry Market
- AkzoNobel N V
- The Sherwin-Williams Company
- Jotun
- RPM International Inc
- Berger Paints India Limited
- Kansai Paint Co Ltd
- Hempel
- PPG Industries Inc
- Masco Corporation
- Benjamin Moore & Co
- Tikkurila
- Nippon Paint Holdings Co Ltd
- BASF SE
- Arkema Group
- Dow
- Asian Paints Limited
- Sika AG
- Axalta Coating Systems LLC
- Shawcor
- KCC Corporation
Notable Milestones in Waterborne Coatings Industry Sector
- 2020: Introduction of a new generation of low-VOC acrylic resin by PPG Industries.
- 2021: Merger between two regional players in the Asian market.
- 2022: Launch of a bio-based waterborne coating by AkzoNobel.
- 2023: Implementation of stricter environmental regulations in the EU.
In-Depth Waterborne Coatings Industry Market Outlook
The waterborne coatings market is poised for substantial growth over the next decade, driven by technological innovation, expanding applications, and supportive regulatory frameworks. Strategic investments in R&D, focusing on sustainability and performance improvements, will be crucial for success. Companies adopting flexible manufacturing strategies and efficient supply chains will be best positioned to capture market share.
Waterborne Coatings Industry Segmentation
-
1. Resin Type
- 1.1. Acrylic
- 1.2. Epoxy
- 1.3. Polyurethane
- 1.4. Polyester
- 1.5. Alkyd
- 1.6. Polyvinylidene Chloride (PVDC)
- 1.7. Polyvinylidene Fluoride (PVDF)
- 1.8. Other Resin Types
-
2. End-user Industry
- 2.1. Building and Construction
- 2.2. Automotive
- 2.3. Industrial
- 2.4. Wood
- 2.5. Other End-user Industries
Waterborne Coatings Industry Segmentation By Geography
-
1. Asia Pacific
- 1.1. China
- 1.2. India
- 1.3. Japan
- 1.4. South Korea
- 1.5. Rest of Asia Pacific
-
2. North America
- 2.1. United States
- 2.2. Canada
- 2.3. Mexico
-
3. Europe
- 3.1. Germany
- 3.2. United Kingdom
- 3.3. Italy
- 3.4. France
- 3.5. Rest of Europe
-
4. South America
- 4.1. Brazil
- 4.2. Argentina
- 4.3. Rest of South America
-
5. Middle East and Africa
- 5.1. Saudi Arabia
- 5.2. South Africa
- 5.3. Rest of Middle East and Africa
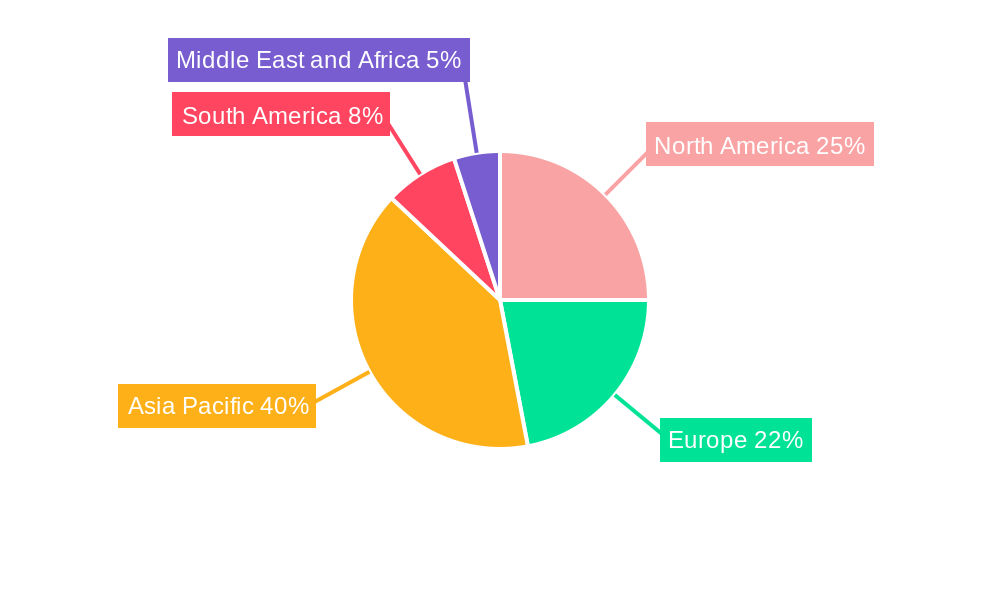
Waterborne Coatings Industry Regional Market Share
Geographic Coverage of Waterborne Coatings Industry
Waterborne Coatings Industry REPORT HIGHLIGHTS
| Aspects | Details |
|---|---|
| Study Period | 2020-2034 |
| Base Year | 2025 |
| Estimated Year | 2026 |
| Forecast Period | 2026-2034 |
| Historical Period | 2020-2025 |
| Growth Rate | CAGR of > 5.50% from 2020-2034 |
| Segmentation |
|
Table of Contents
- 1. Introduction
- 1.1. Research Scope
- 1.2. Market Segmentation
- 1.3. Research Objective
- 1.4. Definitions and Assumptions
- 2. Executive Summary
- 2.1. Market Snapshot
- 3. Market Dynamics
- 3.1. Market Drivers
- 3.2. Market Restrains
- 3.3. Market Trends
- 3.4. Market Opportunities
- 4. Market Factor Analysis
- 4.1. Porters Five Forces
- 4.1.1. Bargaining Power of Suppliers
- 4.1.2. Bargaining Power of Buyers
- 4.1.3. Threat of New Entrants
- 4.1.4. Threat of Substitutes
- 4.1.5. Competitive Rivalry
- 4.2. PESTEL analysis
- 4.3. BCG Analysis
- 4.3.1. Stars (High Growth, High Market Share)
- 4.3.2. Cash Cows (Low Growth, High Market Share)
- 4.3.3. Question Mark (High Growth, Low Market Share)
- 4.3.4. Dogs (Low Growth, Low Market Share)
- 4.4. Ansoff Matrix Analysis
- 4.5. Supply Chain Analysis
- 4.6. Regulatory Landscape
- 4.7. Current Market Potential and Opportunity Assessment (TAM–SAM–SOM Framework)
- 4.8. NRP Analyst Note
- 4.1. Porters Five Forces
- 5. Market Analysis, Insights and Forecast 2021-2033
- 5.1. Market Analysis, Insights and Forecast - by Resin Type
- 5.1.1. Acrylic
- 5.1.2. Epoxy
- 5.1.3. Polyurethane
- 5.1.4. Polyester
- 5.1.5. Alkyd
- 5.1.6. Polyvinylidene Chloride (PVDC)
- 5.1.7. Polyvinylidene Fluoride (PVDF)
- 5.1.8. Other Resin Types
- 5.2. Market Analysis, Insights and Forecast - by End-user Industry
- 5.2.1. Building and Construction
- 5.2.2. Automotive
- 5.2.3. Industrial
- 5.2.4. Wood
- 5.2.5. Other End-user Industries
- 5.3. Market Analysis, Insights and Forecast - by Region
- 5.3.1. Asia Pacific
- 5.3.2. North America
- 5.3.3. Europe
- 5.3.4. South America
- 5.3.5. Middle East and Africa
- 5.1. Market Analysis, Insights and Forecast - by Resin Type
- 6. Global Waterborne Coatings Industry Analysis, Insights and Forecast, 2021-2033
- 6.1. Market Analysis, Insights and Forecast - by Resin Type
- 6.1.1. Acrylic
- 6.1.2. Epoxy
- 6.1.3. Polyurethane
- 6.1.4. Polyester
- 6.1.5. Alkyd
- 6.1.6. Polyvinylidene Chloride (PVDC)
- 6.1.7. Polyvinylidene Fluoride (PVDF)
- 6.1.8. Other Resin Types
- 6.2. Market Analysis, Insights and Forecast - by End-user Industry
- 6.2.1. Building and Construction
- 6.2.2. Automotive
- 6.2.3. Industrial
- 6.2.4. Wood
- 6.2.5. Other End-user Industries
- 6.1. Market Analysis, Insights and Forecast - by Resin Type
- 7. Asia Pacific Waterborne Coatings Industry Analysis, Insights and Forecast, 2020-2032
- 7.1. Market Analysis, Insights and Forecast - by Resin Type
- 7.1.1. Acrylic
- 7.1.2. Epoxy
- 7.1.3. Polyurethane
- 7.1.4. Polyester
- 7.1.5. Alkyd
- 7.1.6. Polyvinylidene Chloride (PVDC)
- 7.1.7. Polyvinylidene Fluoride (PVDF)
- 7.1.8. Other Resin Types
- 7.2. Market Analysis, Insights and Forecast - by End-user Industry
- 7.2.1. Building and Construction
- 7.2.2. Automotive
- 7.2.3. Industrial
- 7.2.4. Wood
- 7.2.5. Other End-user Industries
- 7.1. Market Analysis, Insights and Forecast - by Resin Type
- 8. North America Waterborne Coatings Industry Analysis, Insights and Forecast, 2020-2032
- 8.1. Market Analysis, Insights and Forecast - by Resin Type
- 8.1.1. Acrylic
- 8.1.2. Epoxy
- 8.1.3. Polyurethane
- 8.1.4. Polyester
- 8.1.5. Alkyd
- 8.1.6. Polyvinylidene Chloride (PVDC)
- 8.1.7. Polyvinylidene Fluoride (PVDF)
- 8.1.8. Other Resin Types
- 8.2. Market Analysis, Insights and Forecast - by End-user Industry
- 8.2.1. Building and Construction
- 8.2.2. Automotive
- 8.2.3. Industrial
- 8.2.4. Wood
- 8.2.5. Other End-user Industries
- 8.1. Market Analysis, Insights and Forecast - by Resin Type
- 9. Europe Waterborne Coatings Industry Analysis, Insights and Forecast, 2020-2032
- 9.1. Market Analysis, Insights and Forecast - by Resin Type
- 9.1.1. Acrylic
- 9.1.2. Epoxy
- 9.1.3. Polyurethane
- 9.1.4. Polyester
- 9.1.5. Alkyd
- 9.1.6. Polyvinylidene Chloride (PVDC)
- 9.1.7. Polyvinylidene Fluoride (PVDF)
- 9.1.8. Other Resin Types
- 9.2. Market Analysis, Insights and Forecast - by End-user Industry
- 9.2.1. Building and Construction
- 9.2.2. Automotive
- 9.2.3. Industrial
- 9.2.4. Wood
- 9.2.5. Other End-user Industries
- 9.1. Market Analysis, Insights and Forecast - by Resin Type
- 10. South America Waterborne Coatings Industry Analysis, Insights and Forecast, 2020-2032
- 10.1. Market Analysis, Insights and Forecast - by Resin Type
- 10.1.1. Acrylic
- 10.1.2. Epoxy
- 10.1.3. Polyurethane
- 10.1.4. Polyester
- 10.1.5. Alkyd
- 10.1.6. Polyvinylidene Chloride (PVDC)
- 10.1.7. Polyvinylidene Fluoride (PVDF)
- 10.1.8. Other Resin Types
- 10.2. Market Analysis, Insights and Forecast - by End-user Industry
- 10.2.1. Building and Construction
- 10.2.2. Automotive
- 10.2.3. Industrial
- 10.2.4. Wood
- 10.2.5. Other End-user Industries
- 10.1. Market Analysis, Insights and Forecast - by Resin Type
- 11. Middle East and Africa Waterborne Coatings Industry Analysis, Insights and Forecast, 2020-2032
- 11.1. Market Analysis, Insights and Forecast - by Resin Type
- 11.1.1. Acrylic
- 11.1.2. Epoxy
- 11.1.3. Polyurethane
- 11.1.4. Polyester
- 11.1.5. Alkyd
- 11.1.6. Polyvinylidene Chloride (PVDC)
- 11.1.7. Polyvinylidene Fluoride (PVDF)
- 11.1.8. Other Resin Types
- 11.2. Market Analysis, Insights and Forecast - by End-user Industry
- 11.2.1. Building and Construction
- 11.2.2. Automotive
- 11.2.3. Industrial
- 11.2.4. Wood
- 11.2.5. Other End-user Industries
- 11.1. Market Analysis, Insights and Forecast - by Resin Type
- 12. Competitive Analysis
- 12.1. Company Profiles
- 12.1.1 AkzoNobel N V
- 12.1.1.1. Company Overview
- 12.1.1.2. Products
- 12.1.1.3. Company Financials
- 12.1.1.4. SWOT Analysis
- 12.1.2 The Sherwin-Williams Company
- 12.1.2.1. Company Overview
- 12.1.2.2. Products
- 12.1.2.3. Company Financials
- 12.1.2.4. SWOT Analysis
- 12.1.3 Jotun
- 12.1.3.1. Company Overview
- 12.1.3.2. Products
- 12.1.3.3. Company Financials
- 12.1.3.4. SWOT Analysis
- 12.1.4 RPM International Inc
- 12.1.4.1. Company Overview
- 12.1.4.2. Products
- 12.1.4.3. Company Financials
- 12.1.4.4. SWOT Analysis
- 12.1.5 Berger Paints India Limited
- 12.1.5.1. Company Overview
- 12.1.5.2. Products
- 12.1.5.3. Company Financials
- 12.1.5.4. SWOT Analysis
- 12.1.6 Kansai Paint Co Ltd
- 12.1.6.1. Company Overview
- 12.1.6.2. Products
- 12.1.6.3. Company Financials
- 12.1.6.4. SWOT Analysis
- 12.1.7 Hempel
- 12.1.7.1. Company Overview
- 12.1.7.2. Products
- 12.1.7.3. Company Financials
- 12.1.7.4. SWOT Analysis
- 12.1.8 PPG Industries Inc
- 12.1.8.1. Company Overview
- 12.1.8.2. Products
- 12.1.8.3. Company Financials
- 12.1.8.4. SWOT Analysis
- 12.1.9 Masco Corporation
- 12.1.9.1. Company Overview
- 12.1.9.2. Products
- 12.1.9.3. Company Financials
- 12.1.9.4. SWOT Analysis
- 12.1.10 Benjamin Moore & Co
- 12.1.10.1. Company Overview
- 12.1.10.2. Products
- 12.1.10.3. Company Financials
- 12.1.10.4. SWOT Analysis
- 12.1.11 Tikkurila*List Not Exhaustive
- 12.1.11.1. Company Overview
- 12.1.11.2. Products
- 12.1.11.3. Company Financials
- 12.1.11.4. SWOT Analysis
- 12.1.12 Nippon Paint Holdings Co Ltd
- 12.1.12.1. Company Overview
- 12.1.12.2. Products
- 12.1.12.3. Company Financials
- 12.1.12.4. SWOT Analysis
- 12.1.13 BASF SE
- 12.1.13.1. Company Overview
- 12.1.13.2. Products
- 12.1.13.3. Company Financials
- 12.1.13.4. SWOT Analysis
- 12.1.14 Arkema Group
- 12.1.14.1. Company Overview
- 12.1.14.2. Products
- 12.1.14.3. Company Financials
- 12.1.14.4. SWOT Analysis
- 12.1.15 Dow
- 12.1.15.1. Company Overview
- 12.1.15.2. Products
- 12.1.15.3. Company Financials
- 12.1.15.4. SWOT Analysis
- 12.1.16 Asian Paints Limited
- 12.1.16.1. Company Overview
- 12.1.16.2. Products
- 12.1.16.3. Company Financials
- 12.1.16.4. SWOT Analysis
- 12.1.17 Sika AG
- 12.1.17.1. Company Overview
- 12.1.17.2. Products
- 12.1.17.3. Company Financials
- 12.1.17.4. SWOT Analysis
- 12.1.18 Axalta Coating Systems LLC
- 12.1.18.1. Company Overview
- 12.1.18.2. Products
- 12.1.18.3. Company Financials
- 12.1.18.4. SWOT Analysis
- 12.1.19 Shawcor
- 12.1.19.1. Company Overview
- 12.1.19.2. Products
- 12.1.19.3. Company Financials
- 12.1.19.4. SWOT Analysis
- 12.1.20 KCC Corporation
- 12.1.20.1. Company Overview
- 12.1.20.2. Products
- 12.1.20.3. Company Financials
- 12.1.20.4. SWOT Analysis
- 12.1.1 AkzoNobel N V
- 12.2. Market Entropy
- 12.2.1 Company's Key Areas Served
- 12.2.2 Recent Developments
- 12.3. Company Market Share Analysis 2025
- 12.3.1 Top 5 Companies Market Share Analysis
- 12.3.2 Top 3 Companies Market Share Analysis
- 12.4. List of Potential Customers
- 13. Research Methodology
List of Figures
- Figure 1: Global Waterborne Coatings Industry Revenue Breakdown (Million, %) by Region 2025 & 2033
- Figure 2: Global Waterborne Coatings Industry Volume Breakdown (liter , %) by Region 2025 & 2033
- Figure 3: Asia Pacific Waterborne Coatings Industry Revenue (Million), by Resin Type 2025 & 2033
- Figure 4: Asia Pacific Waterborne Coatings Industry Volume (liter ), by Resin Type 2025 & 2033
- Figure 5: Asia Pacific Waterborne Coatings Industry Revenue Share (%), by Resin Type 2025 & 2033
- Figure 6: Asia Pacific Waterborne Coatings Industry Volume Share (%), by Resin Type 2025 & 2033
- Figure 7: Asia Pacific Waterborne Coatings Industry Revenue (Million), by End-user Industry 2025 & 2033
- Figure 8: Asia Pacific Waterborne Coatings Industry Volume (liter ), by End-user Industry 2025 & 2033
- Figure 9: Asia Pacific Waterborne Coatings Industry Revenue Share (%), by End-user Industry 2025 & 2033
- Figure 10: Asia Pacific Waterborne Coatings Industry Volume Share (%), by End-user Industry 2025 & 2033
- Figure 11: Asia Pacific Waterborne Coatings Industry Revenue (Million), by Country 2025 & 2033
- Figure 12: Asia Pacific Waterborne Coatings Industry Volume (liter ), by Country 2025 & 2033
- Figure 13: Asia Pacific Waterborne Coatings Industry Revenue Share (%), by Country 2025 & 2033
- Figure 14: Asia Pacific Waterborne Coatings Industry Volume Share (%), by Country 2025 & 2033
- Figure 15: North America Waterborne Coatings Industry Revenue (Million), by Resin Type 2025 & 2033
- Figure 16: North America Waterborne Coatings Industry Volume (liter ), by Resin Type 2025 & 2033
- Figure 17: North America Waterborne Coatings Industry Revenue Share (%), by Resin Type 2025 & 2033
- Figure 18: North America Waterborne Coatings Industry Volume Share (%), by Resin Type 2025 & 2033
- Figure 19: North America Waterborne Coatings Industry Revenue (Million), by End-user Industry 2025 & 2033
- Figure 20: North America Waterborne Coatings Industry Volume (liter ), by End-user Industry 2025 & 2033
- Figure 21: North America Waterborne Coatings Industry Revenue Share (%), by End-user Industry 2025 & 2033
- Figure 22: North America Waterborne Coatings Industry Volume Share (%), by End-user Industry 2025 & 2033
- Figure 23: North America Waterborne Coatings Industry Revenue (Million), by Country 2025 & 2033
- Figure 24: North America Waterborne Coatings Industry Volume (liter ), by Country 2025 & 2033
- Figure 25: North America Waterborne Coatings Industry Revenue Share (%), by Country 2025 & 2033
- Figure 26: North America Waterborne Coatings Industry Volume Share (%), by Country 2025 & 2033
- Figure 27: Europe Waterborne Coatings Industry Revenue (Million), by Resin Type 2025 & 2033
- Figure 28: Europe Waterborne Coatings Industry Volume (liter ), by Resin Type 2025 & 2033
- Figure 29: Europe Waterborne Coatings Industry Revenue Share (%), by Resin Type 2025 & 2033
- Figure 30: Europe Waterborne Coatings Industry Volume Share (%), by Resin Type 2025 & 2033
- Figure 31: Europe Waterborne Coatings Industry Revenue (Million), by End-user Industry 2025 & 2033
- Figure 32: Europe Waterborne Coatings Industry Volume (liter ), by End-user Industry 2025 & 2033
- Figure 33: Europe Waterborne Coatings Industry Revenue Share (%), by End-user Industry 2025 & 2033
- Figure 34: Europe Waterborne Coatings Industry Volume Share (%), by End-user Industry 2025 & 2033
- Figure 35: Europe Waterborne Coatings Industry Revenue (Million), by Country 2025 & 2033
- Figure 36: Europe Waterborne Coatings Industry Volume (liter ), by Country 2025 & 2033
- Figure 37: Europe Waterborne Coatings Industry Revenue Share (%), by Country 2025 & 2033
- Figure 38: Europe Waterborne Coatings Industry Volume Share (%), by Country 2025 & 2033
- Figure 39: South America Waterborne Coatings Industry Revenue (Million), by Resin Type 2025 & 2033
- Figure 40: South America Waterborne Coatings Industry Volume (liter ), by Resin Type 2025 & 2033
- Figure 41: South America Waterborne Coatings Industry Revenue Share (%), by Resin Type 2025 & 2033
- Figure 42: South America Waterborne Coatings Industry Volume Share (%), by Resin Type 2025 & 2033
- Figure 43: South America Waterborne Coatings Industry Revenue (Million), by End-user Industry 2025 & 2033
- Figure 44: South America Waterborne Coatings Industry Volume (liter ), by End-user Industry 2025 & 2033
- Figure 45: South America Waterborne Coatings Industry Revenue Share (%), by End-user Industry 2025 & 2033
- Figure 46: South America Waterborne Coatings Industry Volume Share (%), by End-user Industry 2025 & 2033
- Figure 47: South America Waterborne Coatings Industry Revenue (Million), by Country 2025 & 2033
- Figure 48: South America Waterborne Coatings Industry Volume (liter ), by Country 2025 & 2033
- Figure 49: South America Waterborne Coatings Industry Revenue Share (%), by Country 2025 & 2033
- Figure 50: South America Waterborne Coatings Industry Volume Share (%), by Country 2025 & 2033
- Figure 51: Middle East and Africa Waterborne Coatings Industry Revenue (Million), by Resin Type 2025 & 2033
- Figure 52: Middle East and Africa Waterborne Coatings Industry Volume (liter ), by Resin Type 2025 & 2033
- Figure 53: Middle East and Africa Waterborne Coatings Industry Revenue Share (%), by Resin Type 2025 & 2033
- Figure 54: Middle East and Africa Waterborne Coatings Industry Volume Share (%), by Resin Type 2025 & 2033
- Figure 55: Middle East and Africa Waterborne Coatings Industry Revenue (Million), by End-user Industry 2025 & 2033
- Figure 56: Middle East and Africa Waterborne Coatings Industry Volume (liter ), by End-user Industry 2025 & 2033
- Figure 57: Middle East and Africa Waterborne Coatings Industry Revenue Share (%), by End-user Industry 2025 & 2033
- Figure 58: Middle East and Africa Waterborne Coatings Industry Volume Share (%), by End-user Industry 2025 & 2033
- Figure 59: Middle East and Africa Waterborne Coatings Industry Revenue (Million), by Country 2025 & 2033
- Figure 60: Middle East and Africa Waterborne Coatings Industry Volume (liter ), by Country 2025 & 2033
- Figure 61: Middle East and Africa Waterborne Coatings Industry Revenue Share (%), by Country 2025 & 2033
- Figure 62: Middle East and Africa Waterborne Coatings Industry Volume Share (%), by Country 2025 & 2033
List of Tables
- Table 1: Global Waterborne Coatings Industry Revenue Million Forecast, by Resin Type 2020 & 2033
- Table 2: Global Waterborne Coatings Industry Volume liter Forecast, by Resin Type 2020 & 2033
- Table 3: Global Waterborne Coatings Industry Revenue Million Forecast, by End-user Industry 2020 & 2033
- Table 4: Global Waterborne Coatings Industry Volume liter Forecast, by End-user Industry 2020 & 2033
- Table 5: Global Waterborne Coatings Industry Revenue Million Forecast, by Region 2020 & 2033
- Table 6: Global Waterborne Coatings Industry Volume liter Forecast, by Region 2020 & 2033
- Table 7: Global Waterborne Coatings Industry Revenue Million Forecast, by Resin Type 2020 & 2033
- Table 8: Global Waterborne Coatings Industry Volume liter Forecast, by Resin Type 2020 & 2033
- Table 9: Global Waterborne Coatings Industry Revenue Million Forecast, by End-user Industry 2020 & 2033
- Table 10: Global Waterborne Coatings Industry Volume liter Forecast, by End-user Industry 2020 & 2033
- Table 11: Global Waterborne Coatings Industry Revenue Million Forecast, by Country 2020 & 2033
- Table 12: Global Waterborne Coatings Industry Volume liter Forecast, by Country 2020 & 2033
- Table 13: China Waterborne Coatings Industry Revenue (Million) Forecast, by Application 2020 & 2033
- Table 14: China Waterborne Coatings Industry Volume (liter ) Forecast, by Application 2020 & 2033
- Table 15: India Waterborne Coatings Industry Revenue (Million) Forecast, by Application 2020 & 2033
- Table 16: India Waterborne Coatings Industry Volume (liter ) Forecast, by Application 2020 & 2033
- Table 17: Japan Waterborne Coatings Industry Revenue (Million) Forecast, by Application 2020 & 2033
- Table 18: Japan Waterborne Coatings Industry Volume (liter ) Forecast, by Application 2020 & 2033
- Table 19: South Korea Waterborne Coatings Industry Revenue (Million) Forecast, by Application 2020 & 2033
- Table 20: South Korea Waterborne Coatings Industry Volume (liter ) Forecast, by Application 2020 & 2033
- Table 21: Rest of Asia Pacific Waterborne Coatings Industry Revenue (Million) Forecast, by Application 2020 & 2033
- Table 22: Rest of Asia Pacific Waterborne Coatings Industry Volume (liter ) Forecast, by Application 2020 & 2033
- Table 23: Global Waterborne Coatings Industry Revenue Million Forecast, by Resin Type 2020 & 2033
- Table 24: Global Waterborne Coatings Industry Volume liter Forecast, by Resin Type 2020 & 2033
- Table 25: Global Waterborne Coatings Industry Revenue Million Forecast, by End-user Industry 2020 & 2033
- Table 26: Global Waterborne Coatings Industry Volume liter Forecast, by End-user Industry 2020 & 2033
- Table 27: Global Waterborne Coatings Industry Revenue Million Forecast, by Country 2020 & 2033
- Table 28: Global Waterborne Coatings Industry Volume liter Forecast, by Country 2020 & 2033
- Table 29: United States Waterborne Coatings Industry Revenue (Million) Forecast, by Application 2020 & 2033
- Table 30: United States Waterborne Coatings Industry Volume (liter ) Forecast, by Application 2020 & 2033
- Table 31: Canada Waterborne Coatings Industry Revenue (Million) Forecast, by Application 2020 & 2033
- Table 32: Canada Waterborne Coatings Industry Volume (liter ) Forecast, by Application 2020 & 2033
- Table 33: Mexico Waterborne Coatings Industry Revenue (Million) Forecast, by Application 2020 & 2033
- Table 34: Mexico Waterborne Coatings Industry Volume (liter ) Forecast, by Application 2020 & 2033
- Table 35: Global Waterborne Coatings Industry Revenue Million Forecast, by Resin Type 2020 & 2033
- Table 36: Global Waterborne Coatings Industry Volume liter Forecast, by Resin Type 2020 & 2033
- Table 37: Global Waterborne Coatings Industry Revenue Million Forecast, by End-user Industry 2020 & 2033
- Table 38: Global Waterborne Coatings Industry Volume liter Forecast, by End-user Industry 2020 & 2033
- Table 39: Global Waterborne Coatings Industry Revenue Million Forecast, by Country 2020 & 2033
- Table 40: Global Waterborne Coatings Industry Volume liter Forecast, by Country 2020 & 2033
- Table 41: Germany Waterborne Coatings Industry Revenue (Million) Forecast, by Application 2020 & 2033
- Table 42: Germany Waterborne Coatings Industry Volume (liter ) Forecast, by Application 2020 & 2033
- Table 43: United Kingdom Waterborne Coatings Industry Revenue (Million) Forecast, by Application 2020 & 2033
- Table 44: United Kingdom Waterborne Coatings Industry Volume (liter ) Forecast, by Application 2020 & 2033
- Table 45: Italy Waterborne Coatings Industry Revenue (Million) Forecast, by Application 2020 & 2033
- Table 46: Italy Waterborne Coatings Industry Volume (liter ) Forecast, by Application 2020 & 2033
- Table 47: France Waterborne Coatings Industry Revenue (Million) Forecast, by Application 2020 & 2033
- Table 48: France Waterborne Coatings Industry Volume (liter ) Forecast, by Application 2020 & 2033
- Table 49: Rest of Europe Waterborne Coatings Industry Revenue (Million) Forecast, by Application 2020 & 2033
- Table 50: Rest of Europe Waterborne Coatings Industry Volume (liter ) Forecast, by Application 2020 & 2033
- Table 51: Global Waterborne Coatings Industry Revenue Million Forecast, by Resin Type 2020 & 2033
- Table 52: Global Waterborne Coatings Industry Volume liter Forecast, by Resin Type 2020 & 2033
- Table 53: Global Waterborne Coatings Industry Revenue Million Forecast, by End-user Industry 2020 & 2033
- Table 54: Global Waterborne Coatings Industry Volume liter Forecast, by End-user Industry 2020 & 2033
- Table 55: Global Waterborne Coatings Industry Revenue Million Forecast, by Country 2020 & 2033
- Table 56: Global Waterborne Coatings Industry Volume liter Forecast, by Country 2020 & 2033
- Table 57: Brazil Waterborne Coatings Industry Revenue (Million) Forecast, by Application 2020 & 2033
- Table 58: Brazil Waterborne Coatings Industry Volume (liter ) Forecast, by Application 2020 & 2033
- Table 59: Argentina Waterborne Coatings Industry Revenue (Million) Forecast, by Application 2020 & 2033
- Table 60: Argentina Waterborne Coatings Industry Volume (liter ) Forecast, by Application 2020 & 2033
- Table 61: Rest of South America Waterborne Coatings Industry Revenue (Million) Forecast, by Application 2020 & 2033
- Table 62: Rest of South America Waterborne Coatings Industry Volume (liter ) Forecast, by Application 2020 & 2033
- Table 63: Global Waterborne Coatings Industry Revenue Million Forecast, by Resin Type 2020 & 2033
- Table 64: Global Waterborne Coatings Industry Volume liter Forecast, by Resin Type 2020 & 2033
- Table 65: Global Waterborne Coatings Industry Revenue Million Forecast, by End-user Industry 2020 & 2033
- Table 66: Global Waterborne Coatings Industry Volume liter Forecast, by End-user Industry 2020 & 2033
- Table 67: Global Waterborne Coatings Industry Revenue Million Forecast, by Country 2020 & 2033
- Table 68: Global Waterborne Coatings Industry Volume liter Forecast, by Country 2020 & 2033
- Table 69: Saudi Arabia Waterborne Coatings Industry Revenue (Million) Forecast, by Application 2020 & 2033
- Table 70: Saudi Arabia Waterborne Coatings Industry Volume (liter ) Forecast, by Application 2020 & 2033
- Table 71: South Africa Waterborne Coatings Industry Revenue (Million) Forecast, by Application 2020 & 2033
- Table 72: South Africa Waterborne Coatings Industry Volume (liter ) Forecast, by Application 2020 & 2033
- Table 73: Rest of Middle East and Africa Waterborne Coatings Industry Revenue (Million) Forecast, by Application 2020 & 2033
- Table 74: Rest of Middle East and Africa Waterborne Coatings Industry Volume (liter ) Forecast, by Application 2020 & 2033
Frequently Asked Questions
1. What is the projected Compound Annual Growth Rate (CAGR) of the Waterborne Coatings Industry?
The projected CAGR is approximately > 5.50%.
2. Which companies are prominent players in the Waterborne Coatings Industry?
Key companies in the market include AkzoNobel N V, The Sherwin-Williams Company, Jotun, RPM International Inc, Berger Paints India Limited, Kansai Paint Co Ltd, Hempel, PPG Industries Inc, Masco Corporation, Benjamin Moore & Co, Tikkurila*List Not Exhaustive, Nippon Paint Holdings Co Ltd, BASF SE, Arkema Group, Dow, Asian Paints Limited, Sika AG, Axalta Coating Systems LLC, Shawcor, KCC Corporation.
3. What are the main segments of the Waterborne Coatings Industry?
The market segments include Resin Type, End-user Industry.
4. Can you provide details about the market size?
The market size is estimated to be USD 100300 Million as of 2022.
5. What are some drivers contributing to market growth?
; Increasing Demand for Building and Construction; Other Drivers.
6. What are the notable trends driving market growth?
Acrylics Segment to Dominate the Market.
7. Are there any restraints impacting market growth?
Price Hikes of Raw Materials; Other Restraints.
8. Can you provide examples of recent developments in the market?
N/A
9. What pricing options are available for accessing the report?
Pricing options include single-user, multi-user, and enterprise licenses priced at USD 4750, USD 5250, and USD 8750 respectively.
10. Is the market size provided in terms of value or volume?
The market size is provided in terms of value, measured in Million and volume, measured in liter .
11. Are there any specific market keywords associated with the report?
Yes, the market keyword associated with the report is "Waterborne Coatings Industry," which aids in identifying and referencing the specific market segment covered.
12. How do I determine which pricing option suits my needs best?
The pricing options vary based on user requirements and access needs. Individual users may opt for single-user licenses, while businesses requiring broader access may choose multi-user or enterprise licenses for cost-effective access to the report.
13. Are there any additional resources or data provided in the Waterborne Coatings Industry report?
While the report offers comprehensive insights, it's advisable to review the specific contents or supplementary materials provided to ascertain if additional resources or data are available.
14. How can I stay updated on further developments or reports in the Waterborne Coatings Industry?
To stay informed about further developments, trends, and reports in the Waterborne Coatings Industry, consider subscribing to industry newsletters, following relevant companies and organizations, or regularly checking reputable industry news sources and publications.
Methodology
Step 1 - Identification of Relevant Samples Size from Population Database


Step 2 - Approaches for Defining Global Market Size (Value, Volume* & Price*)

Note*: In applicable scenarios
Step 3 - Data Sources
Primary Research
- Web Analytics
- Survey Reports
- Research Institute
- Latest Research Reports
- Opinion Leaders
Secondary Research
- Annual Reports
- White Paper
- Latest Press Release
- Industry Association
- Paid Database
- Investor Presentations

Step 4 - Data Triangulation
Involves using different sources of information in order to increase the validity of a study
These sources are likely to be stakeholders in a program - participants, other researchers, program staff, other community members, and so on.
Then we put all data in single framework & apply various statistical tools to find out the dynamic on the market.
During the analysis stage, feedback from the stakeholder groups would be compared to determine areas of agreement as well as areas of divergence