

Key Insights
The global waterproofing admixture market is experiencing robust growth, driven by an expanding construction sector and escalating demand for durable, long-lasting infrastructure. Projections indicate a Compound Annual Growth Rate (CAGR) of 7.52%, signifying a substantial upward trajectory. Key market drivers include the increasing incidence of extreme weather events, necessitating enhanced building protection, stringent building codes emphasizing water resistance, and a growing preference for sustainable construction practices. The market is segmented by type (crystalline, pore-blocking, and others) and application (residential, commercial, infrastructure, and industrial/institutional). Crystalline admixtures are anticipated to lead due to their proven effectiveness and enduring durability. Geographically, the Asia-Pacific region, particularly rapidly developing economies like China and India, showcases strong growth fueled by significant infrastructure development. North America and Europe also contribute considerably, driven by renovation and retrofitting initiatives. Potential restraints include fluctuating raw material prices and economic downturns. Leading companies are investing in R&D to introduce innovative and eco-friendly admixtures, actively shaping the market landscape. The competitive environment features established multinational corporations and regional players, fostering innovation and price competitiveness.
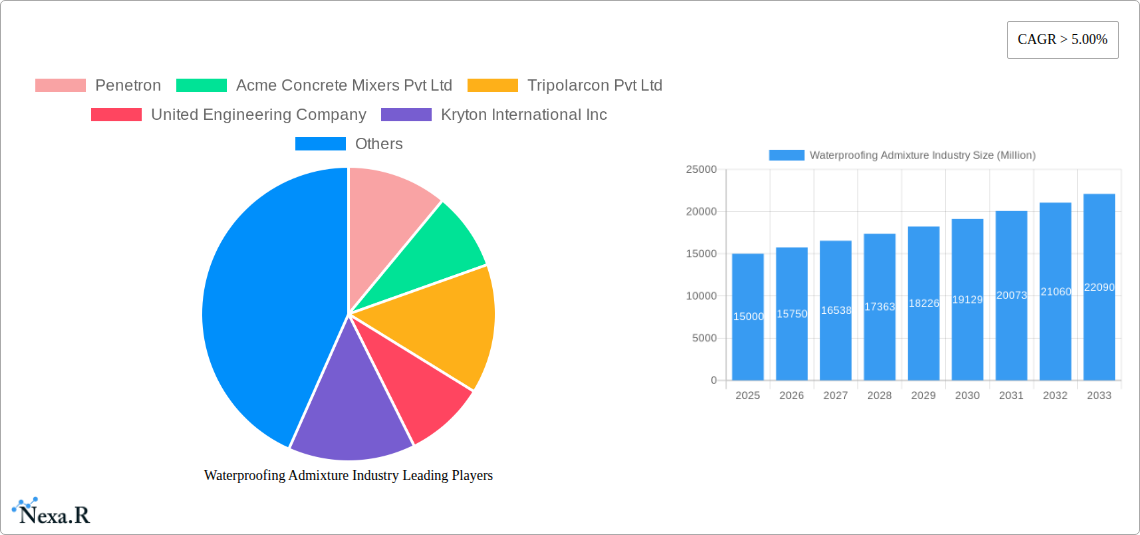
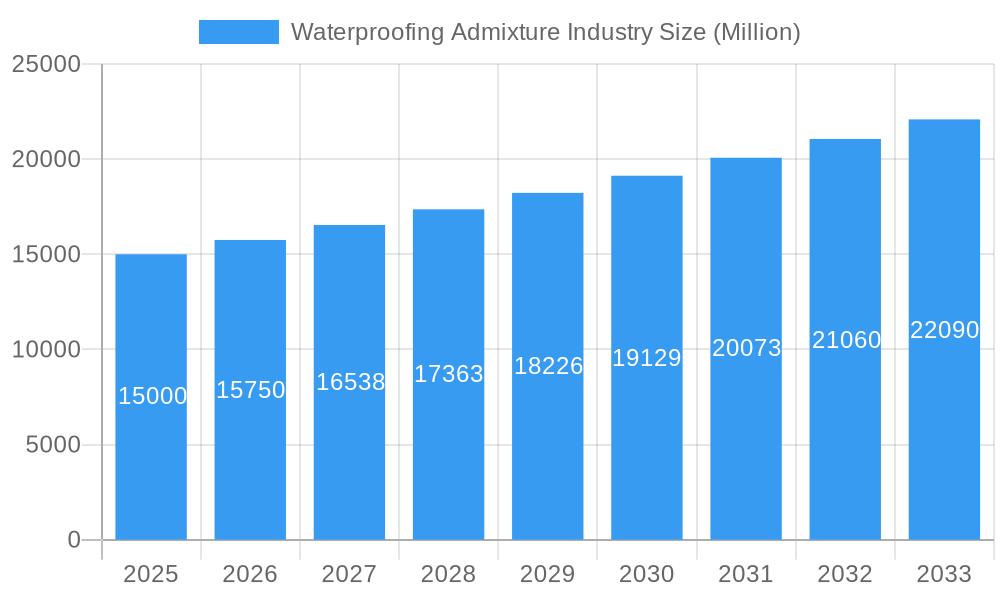
Waterproofing Admixture Industry Market Size (In Billion)
The forecast period (2025-2033) offers significant market expansion opportunities. The rising adoption of precast concrete and an intensified focus on green building practices will drive demand for high-performance waterproofing admixtures. Technological advancements leading to improved product efficacy and sustainability are expected to influence future market trends. Companies are likely to pursue strategic partnerships, mergers, and acquisitions to consolidate market positions and broaden geographical reach. Market growth will be shaped by government regulations concerning building construction and environmental protection, alongside the overall global economic climate. A comprehensive understanding of these dynamics is vital for stakeholders to make informed decisions and capitalize on emerging opportunities. The market size is projected to reach 7.53 billion by the end of the forecast period.
Waterproofing Admixture Industry Company Market Share
Waterproofing Admixture Industry Market Report: 2019-2033
This comprehensive report provides an in-depth analysis of the Waterproofing Admixture industry, encompassing market dynamics, growth trends, regional segmentation, product landscape, and key players. With a study period spanning 2019-2033, a base year of 2025, and a forecast period of 2025-2033, this report is an essential resource for industry professionals, investors, and strategic decision-makers. The report analyzes parent markets (Construction Chemicals) and child markets (specific application segments like Residential, Commercial, etc.) for a complete overview. Market values are presented in million units.
Waterproofing Admixture Industry Market Dynamics & Structure
The global waterproofing admixture market is characterized by moderate concentration, with key players holding significant market share. Technological innovation, driven by the need for enhanced performance and sustainability, is a primary growth driver. Stringent regulatory frameworks regarding building codes and environmental concerns significantly impact market dynamics. Competition from alternative waterproofing methods and the availability of substitute materials pose challenges. End-user demographics, particularly the growth of infrastructure projects in developing economies, significantly influence market demand. M&A activity, as seen in Sika AG's acquisition of Shenzhen Landun Holding Co., Ltd. in August 2021, shapes the competitive landscape.
- Market Concentration: Moderately Concentrated (xx% top 5 players in 2024)
- Technological Innovation Drivers: Development of high-performance, eco-friendly admixtures.
- Regulatory Frameworks: Building codes, environmental regulations (e.g., VOC limits).
- Competitive Product Substitutes: Membrane waterproofing, coatings.
- End-User Demographics: Growth in infrastructure projects, residential construction.
- M&A Trends: Consolidation through acquisitions and mergers, increasing market share. (xx number of deals in 2019-2024).
Waterproofing Admixture Industry Growth Trends & Insights
The waterproofing admixture market experienced [XXX] growth during the historical period (2019-2024), driven by factors such as increasing urbanization, robust infrastructure development across various regions, and rising awareness regarding building durability. The market is projected to witness a CAGR of xx% during the forecast period (2025-2033). Technological advancements, such as the introduction of crystalline waterproofing admixtures with enhanced self-healing properties, are fueling market expansion. Shifting consumer preferences towards sustainable and high-performance building materials are also impacting adoption rates. Market penetration is expected to increase from xx% in 2024 to xx% by 2033. The growing focus on green building practices further stimulates demand. Increased adoption in emerging economies also contributes to the market growth. The rise of precast concrete construction is also a key driver due to its inherent need for effective waterproofing.
Dominant Regions, Countries, or Segments in Waterproofing Admixture Industry
The Asia-Pacific region is currently the leading market for waterproofing admixtures, driven by rapid infrastructure development and urbanization in countries like China and India. Within the product types, Crystalline admixtures hold the largest market share owing to their superior performance and durability. The Infrastructure segment contributes significantly to overall market demand, followed by the Commercial and Residential sectors.
- Key Drivers (Asia-Pacific): Government investments in infrastructure, rapid urbanization, rising construction activity.
- Key Drivers (Crystalline Admixtures): Superior performance, long-term durability, self-healing properties.
- Key Drivers (Infrastructure Segment): Large-scale projects (dams, tunnels, bridges), government initiatives.
- Market Share (2024): Asia-Pacific (xx%), Crystalline Admixtures (xx%), Infrastructure (xx%).
- Growth Potential (2025-2033): High growth potential in developing economies, particularly in Africa and Latin America.
Waterproofing Admixture Industry Product Landscape
Waterproofing admixtures are available in various types, including crystalline, pore-blocking, and other specialized formulations. Crystalline admixtures offer superior long-term protection by reacting with water and cement to create insoluble crystals that seal micro-cracks. Pore-blocking admixtures fill pores and voids in concrete, preventing water penetration. Recent innovations focus on enhancing the durability, sustainability, and ease of application of these admixtures. Unique selling propositions include improved crack-healing capabilities, reduced permeability, and enhanced resistance to chemical attack.
Key Drivers, Barriers & Challenges in Waterproofing Admixture Industry
Key Drivers: Growing construction industry, increasing urbanization, rising demand for sustainable building materials, stringent building codes, and technological advancements (e.g., nanotechnology-based admixtures).
Challenges: Fluctuations in raw material prices, intense competition, stringent environmental regulations (potentially increasing production costs), and supply chain disruptions (xx% impact on production during 2020-2022 due to global events).
Emerging Opportunities in Waterproofing Admixture Industry
Emerging opportunities include expansion into untapped markets (e.g., Africa, Latin America), development of eco-friendly and high-performance admixtures for specialized applications (e.g., self-healing concrete), and leveraging digital technologies for improved product design and application. Increased adoption of precast concrete also presents opportunities. Growing focus on sustainable construction will propel the demand for eco-friendly admixtures.
Growth Accelerators in the Waterproofing Admixture Industry
Technological breakthroughs, such as nanotechnology and bio-based admixtures, are significantly accelerating market growth. Strategic partnerships and collaborations between admixture manufacturers and construction companies are also enhancing market expansion. Government initiatives promoting sustainable infrastructure development further contribute to market growth.
Key Players Shaping the Waterproofing Admixture Market
- Penetron
- Acme Concrete Mixers Pvt Ltd
- Tripolarcon Pvt Ltd
- United Engineering Company
- Kryton International Inc
- BASF SE
- Perma construction Aids Pvt Ltd
- Xypex Chemical Corporation
- Fosroc Inc
- MAPEI S p A
- Sika AG
- W R Grace & Co -Conn
- ECMAS Group
- SUNANDA SPECIALITY COATINGS PVT LTD
Notable Milestones in Waterproofing Admixture Industry Sector
- August 2021: Sika AG acquired Shenzhen Landun Holding Co., Ltd., expanding its presence in the Chinese market.
In-Depth Waterproofing Admixture Industry Market Outlook
The waterproofing admixture market is poised for robust growth in the coming years, driven by sustained investment in infrastructure, urbanization, and the ongoing demand for durable and sustainable construction materials. Strategic investments in research and development, focused on innovative product formulations and application technologies, will be critical for success in this competitive landscape. Companies that adapt to evolving regulatory frameworks and address emerging consumer preferences will capture significant market share. The growing demand for eco-friendly solutions presents substantial opportunities for companies that prioritize sustainable practices in their operations.
Waterproofing Admixture Industry Segmentation
-
1. Type
- 1.1. Crystalline
- 1.2. Pore-blocking
- 1.3. Other Types
-
2. Application
- 2.1. Residential
- 2.2. Commercial
- 2.3. Infrastructure
- 2.4. Industrial and Institutional
Waterproofing Admixture Industry Segmentation By Geography
-
1. Asia Pacific
- 1.1. China
- 1.2. India
- 1.3. Japan
- 1.4. South Korea
- 1.5. Rest of Asia Pacific
-
2. North America
- 2.1. United States
- 2.2. Canada
- 2.3. Mexico
-
3. Europe
- 3.1. Germany
- 3.2. United Kingdom
- 3.3. Italy
- 3.4. France
- 3.5. Rest of Europe
-
4. South America
- 4.1. Brazil
- 4.2. Argentina
- 4.3. Rest of South America
-
5. Middle East and Africa
- 5.1. Saudi Arabia
- 5.2. South Africa
- 5.3. Rest of Middle East and Africa
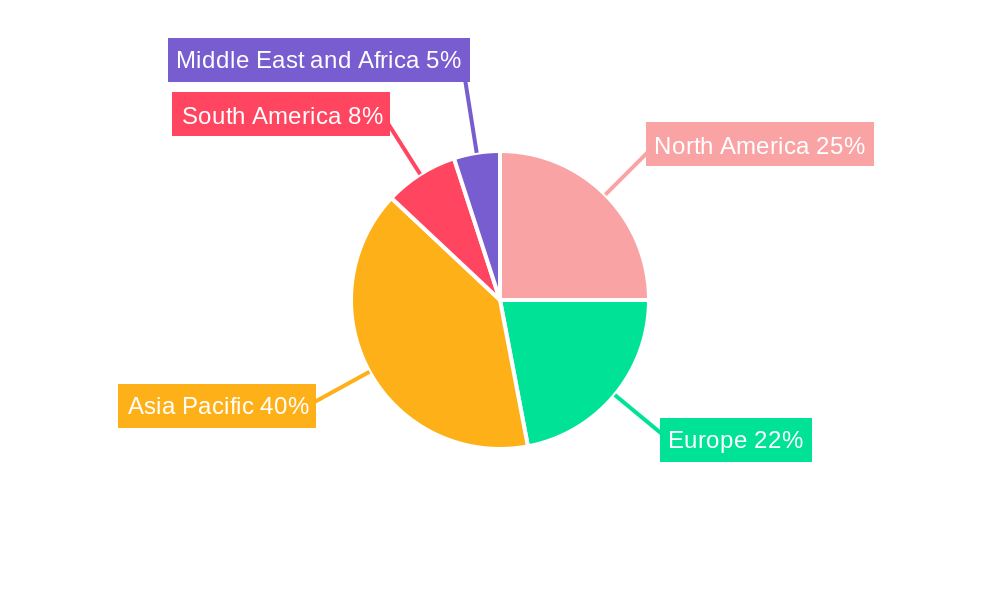
Waterproofing Admixture Industry Regional Market Share
Geographic Coverage of Waterproofing Admixture Industry
Waterproofing Admixture Industry REPORT HIGHLIGHTS
| Aspects | Details |
|---|---|
| Study Period | 2020-2034 |
| Base Year | 2025 |
| Estimated Year | 2026 |
| Forecast Period | 2026-2034 |
| Historical Period | 2020-2025 |
| Growth Rate | CAGR of 7.52% from 2020-2034 |
| Segmentation |
|
Table of Contents
- 1. Introduction
- 1.1. Research Scope
- 1.2. Market Segmentation
- 1.3. Research Objective
- 1.4. Definitions and Assumptions
- 2. Executive Summary
- 2.1. Market Snapshot
- 3. Market Dynamics
- 3.1. Market Drivers
- 3.2. Market Restrains
- 3.3. Market Trends
- 3.4. Market Opportunities
- 4. Market Factor Analysis
- 4.1. Porters Five Forces
- 4.1.1. Bargaining Power of Suppliers
- 4.1.2. Bargaining Power of Buyers
- 4.1.3. Threat of New Entrants
- 4.1.4. Threat of Substitutes
- 4.1.5. Competitive Rivalry
- 4.2. PESTEL analysis
- 4.3. BCG Analysis
- 4.3.1. Stars (High Growth, High Market Share)
- 4.3.2. Cash Cows (Low Growth, High Market Share)
- 4.3.3. Question Mark (High Growth, Low Market Share)
- 4.3.4. Dogs (Low Growth, Low Market Share)
- 4.4. Ansoff Matrix Analysis
- 4.5. Supply Chain Analysis
- 4.6. Regulatory Landscape
- 4.7. Current Market Potential and Opportunity Assessment (TAM–SAM–SOM Framework)
- 4.8. NRP Analyst Note
- 4.1. Porters Five Forces
- 5. Market Analysis, Insights and Forecast 2021-2033
- 5.1. Market Analysis, Insights and Forecast - by Type
- 5.1.1. Crystalline
- 5.1.2. Pore-blocking
- 5.1.3. Other Types
- 5.2. Market Analysis, Insights and Forecast - by Application
- 5.2.1. Residential
- 5.2.2. Commercial
- 5.2.3. Infrastructure
- 5.2.4. Industrial and Institutional
- 5.3. Market Analysis, Insights and Forecast - by Region
- 5.3.1. Asia Pacific
- 5.3.2. North America
- 5.3.3. Europe
- 5.3.4. South America
- 5.3.5. Middle East and Africa
- 5.1. Market Analysis, Insights and Forecast - by Type
- 6. Global Waterproofing Admixture Industry Analysis, Insights and Forecast, 2021-2033
- 6.1. Market Analysis, Insights and Forecast - by Type
- 6.1.1. Crystalline
- 6.1.2. Pore-blocking
- 6.1.3. Other Types
- 6.2. Market Analysis, Insights and Forecast - by Application
- 6.2.1. Residential
- 6.2.2. Commercial
- 6.2.3. Infrastructure
- 6.2.4. Industrial and Institutional
- 6.1. Market Analysis, Insights and Forecast - by Type
- 7. Asia Pacific Waterproofing Admixture Industry Analysis, Insights and Forecast, 2020-2032
- 7.1. Market Analysis, Insights and Forecast - by Type
- 7.1.1. Crystalline
- 7.1.2. Pore-blocking
- 7.1.3. Other Types
- 7.2. Market Analysis, Insights and Forecast - by Application
- 7.2.1. Residential
- 7.2.2. Commercial
- 7.2.3. Infrastructure
- 7.2.4. Industrial and Institutional
- 7.1. Market Analysis, Insights and Forecast - by Type
- 8. North America Waterproofing Admixture Industry Analysis, Insights and Forecast, 2020-2032
- 8.1. Market Analysis, Insights and Forecast - by Type
- 8.1.1. Crystalline
- 8.1.2. Pore-blocking
- 8.1.3. Other Types
- 8.2. Market Analysis, Insights and Forecast - by Application
- 8.2.1. Residential
- 8.2.2. Commercial
- 8.2.3. Infrastructure
- 8.2.4. Industrial and Institutional
- 8.1. Market Analysis, Insights and Forecast - by Type
- 9. Europe Waterproofing Admixture Industry Analysis, Insights and Forecast, 2020-2032
- 9.1. Market Analysis, Insights and Forecast - by Type
- 9.1.1. Crystalline
- 9.1.2. Pore-blocking
- 9.1.3. Other Types
- 9.2. Market Analysis, Insights and Forecast - by Application
- 9.2.1. Residential
- 9.2.2. Commercial
- 9.2.3. Infrastructure
- 9.2.4. Industrial and Institutional
- 9.1. Market Analysis, Insights and Forecast - by Type
- 10. South America Waterproofing Admixture Industry Analysis, Insights and Forecast, 2020-2032
- 10.1. Market Analysis, Insights and Forecast - by Type
- 10.1.1. Crystalline
- 10.1.2. Pore-blocking
- 10.1.3. Other Types
- 10.2. Market Analysis, Insights and Forecast - by Application
- 10.2.1. Residential
- 10.2.2. Commercial
- 10.2.3. Infrastructure
- 10.2.4. Industrial and Institutional
- 10.1. Market Analysis, Insights and Forecast - by Type
- 11. Middle East and Africa Waterproofing Admixture Industry Analysis, Insights and Forecast, 2020-2032
- 11.1. Market Analysis, Insights and Forecast - by Type
- 11.1.1. Crystalline
- 11.1.2. Pore-blocking
- 11.1.3. Other Types
- 11.2. Market Analysis, Insights and Forecast - by Application
- 11.2.1. Residential
- 11.2.2. Commercial
- 11.2.3. Infrastructure
- 11.2.4. Industrial and Institutional
- 11.1. Market Analysis, Insights and Forecast - by Type
- 12. Competitive Analysis
- 12.1. Company Profiles
- 12.1.1 Penetron
- 12.1.1.1. Company Overview
- 12.1.1.2. Products
- 12.1.1.3. Company Financials
- 12.1.1.4. SWOT Analysis
- 12.1.2 Acme Concrete Mixers Pvt Ltd
- 12.1.2.1. Company Overview
- 12.1.2.2. Products
- 12.1.2.3. Company Financials
- 12.1.2.4. SWOT Analysis
- 12.1.3 Tripolarcon Pvt Ltd
- 12.1.3.1. Company Overview
- 12.1.3.2. Products
- 12.1.3.3. Company Financials
- 12.1.3.4. SWOT Analysis
- 12.1.4 United Engineering Company
- 12.1.4.1. Company Overview
- 12.1.4.2. Products
- 12.1.4.3. Company Financials
- 12.1.4.4. SWOT Analysis
- 12.1.5 Kryton International Inc
- 12.1.5.1. Company Overview
- 12.1.5.2. Products
- 12.1.5.3. Company Financials
- 12.1.5.4. SWOT Analysis
- 12.1.6 BASF SE
- 12.1.6.1. Company Overview
- 12.1.6.2. Products
- 12.1.6.3. Company Financials
- 12.1.6.4. SWOT Analysis
- 12.1.7 Perma construction Aids Pvt Ltd
- 12.1.7.1. Company Overview
- 12.1.7.2. Products
- 12.1.7.3. Company Financials
- 12.1.7.4. SWOT Analysis
- 12.1.8 Xypex Chemical Corporation*List Not Exhaustive
- 12.1.8.1. Company Overview
- 12.1.8.2. Products
- 12.1.8.3. Company Financials
- 12.1.8.4. SWOT Analysis
- 12.1.9 Fosroc Inc
- 12.1.9.1. Company Overview
- 12.1.9.2. Products
- 12.1.9.3. Company Financials
- 12.1.9.4. SWOT Analysis
- 12.1.10 MAPEI S p A
- 12.1.10.1. Company Overview
- 12.1.10.2. Products
- 12.1.10.3. Company Financials
- 12.1.10.4. SWOT Analysis
- 12.1.11 Sika AG
- 12.1.11.1. Company Overview
- 12.1.11.2. Products
- 12.1.11.3. Company Financials
- 12.1.11.4. SWOT Analysis
- 12.1.12 W R Grace & Co -Conn
- 12.1.12.1. Company Overview
- 12.1.12.2. Products
- 12.1.12.3. Company Financials
- 12.1.12.4. SWOT Analysis
- 12.1.13 ECMAS Group
- 12.1.13.1. Company Overview
- 12.1.13.2. Products
- 12.1.13.3. Company Financials
- 12.1.13.4. SWOT Analysis
- 12.1.14 SUNANDA SPECIALITY COATINGS PVT LTD
- 12.1.14.1. Company Overview
- 12.1.14.2. Products
- 12.1.14.3. Company Financials
- 12.1.14.4. SWOT Analysis
- 12.1.1 Penetron
- 12.2. Market Entropy
- 12.2.1 Company's Key Areas Served
- 12.2.2 Recent Developments
- 12.3. Company Market Share Analysis 2025
- 12.3.1 Top 5 Companies Market Share Analysis
- 12.3.2 Top 3 Companies Market Share Analysis
- 12.4. List of Potential Customers
- 13. Research Methodology
List of Figures
- Figure 1: Global Waterproofing Admixture Industry Revenue Breakdown (billion, %) by Region 2025 & 2033
- Figure 2: Asia Pacific Waterproofing Admixture Industry Revenue (billion), by Type 2025 & 2033
- Figure 3: Asia Pacific Waterproofing Admixture Industry Revenue Share (%), by Type 2025 & 2033
- Figure 4: Asia Pacific Waterproofing Admixture Industry Revenue (billion), by Application 2025 & 2033
- Figure 5: Asia Pacific Waterproofing Admixture Industry Revenue Share (%), by Application 2025 & 2033
- Figure 6: Asia Pacific Waterproofing Admixture Industry Revenue (billion), by Country 2025 & 2033
- Figure 7: Asia Pacific Waterproofing Admixture Industry Revenue Share (%), by Country 2025 & 2033
- Figure 8: North America Waterproofing Admixture Industry Revenue (billion), by Type 2025 & 2033
- Figure 9: North America Waterproofing Admixture Industry Revenue Share (%), by Type 2025 & 2033
- Figure 10: North America Waterproofing Admixture Industry Revenue (billion), by Application 2025 & 2033
- Figure 11: North America Waterproofing Admixture Industry Revenue Share (%), by Application 2025 & 2033
- Figure 12: North America Waterproofing Admixture Industry Revenue (billion), by Country 2025 & 2033
- Figure 13: North America Waterproofing Admixture Industry Revenue Share (%), by Country 2025 & 2033
- Figure 14: Europe Waterproofing Admixture Industry Revenue (billion), by Type 2025 & 2033
- Figure 15: Europe Waterproofing Admixture Industry Revenue Share (%), by Type 2025 & 2033
- Figure 16: Europe Waterproofing Admixture Industry Revenue (billion), by Application 2025 & 2033
- Figure 17: Europe Waterproofing Admixture Industry Revenue Share (%), by Application 2025 & 2033
- Figure 18: Europe Waterproofing Admixture Industry Revenue (billion), by Country 2025 & 2033
- Figure 19: Europe Waterproofing Admixture Industry Revenue Share (%), by Country 2025 & 2033
- Figure 20: South America Waterproofing Admixture Industry Revenue (billion), by Type 2025 & 2033
- Figure 21: South America Waterproofing Admixture Industry Revenue Share (%), by Type 2025 & 2033
- Figure 22: South America Waterproofing Admixture Industry Revenue (billion), by Application 2025 & 2033
- Figure 23: South America Waterproofing Admixture Industry Revenue Share (%), by Application 2025 & 2033
- Figure 24: South America Waterproofing Admixture Industry Revenue (billion), by Country 2025 & 2033
- Figure 25: South America Waterproofing Admixture Industry Revenue Share (%), by Country 2025 & 2033
- Figure 26: Middle East and Africa Waterproofing Admixture Industry Revenue (billion), by Type 2025 & 2033
- Figure 27: Middle East and Africa Waterproofing Admixture Industry Revenue Share (%), by Type 2025 & 2033
- Figure 28: Middle East and Africa Waterproofing Admixture Industry Revenue (billion), by Application 2025 & 2033
- Figure 29: Middle East and Africa Waterproofing Admixture Industry Revenue Share (%), by Application 2025 & 2033
- Figure 30: Middle East and Africa Waterproofing Admixture Industry Revenue (billion), by Country 2025 & 2033
- Figure 31: Middle East and Africa Waterproofing Admixture Industry Revenue Share (%), by Country 2025 & 2033
List of Tables
- Table 1: Global Waterproofing Admixture Industry Revenue billion Forecast, by Type 2020 & 2033
- Table 2: Global Waterproofing Admixture Industry Revenue billion Forecast, by Application 2020 & 2033
- Table 3: Global Waterproofing Admixture Industry Revenue billion Forecast, by Region 2020 & 2033
- Table 4: Global Waterproofing Admixture Industry Revenue billion Forecast, by Type 2020 & 2033
- Table 5: Global Waterproofing Admixture Industry Revenue billion Forecast, by Application 2020 & 2033
- Table 6: Global Waterproofing Admixture Industry Revenue billion Forecast, by Country 2020 & 2033
- Table 7: China Waterproofing Admixture Industry Revenue (billion) Forecast, by Application 2020 & 2033
- Table 8: India Waterproofing Admixture Industry Revenue (billion) Forecast, by Application 2020 & 2033
- Table 9: Japan Waterproofing Admixture Industry Revenue (billion) Forecast, by Application 2020 & 2033
- Table 10: South Korea Waterproofing Admixture Industry Revenue (billion) Forecast, by Application 2020 & 2033
- Table 11: Rest of Asia Pacific Waterproofing Admixture Industry Revenue (billion) Forecast, by Application 2020 & 2033
- Table 12: Global Waterproofing Admixture Industry Revenue billion Forecast, by Type 2020 & 2033
- Table 13: Global Waterproofing Admixture Industry Revenue billion Forecast, by Application 2020 & 2033
- Table 14: Global Waterproofing Admixture Industry Revenue billion Forecast, by Country 2020 & 2033
- Table 15: United States Waterproofing Admixture Industry Revenue (billion) Forecast, by Application 2020 & 2033
- Table 16: Canada Waterproofing Admixture Industry Revenue (billion) Forecast, by Application 2020 & 2033
- Table 17: Mexico Waterproofing Admixture Industry Revenue (billion) Forecast, by Application 2020 & 2033
- Table 18: Global Waterproofing Admixture Industry Revenue billion Forecast, by Type 2020 & 2033
- Table 19: Global Waterproofing Admixture Industry Revenue billion Forecast, by Application 2020 & 2033
- Table 20: Global Waterproofing Admixture Industry Revenue billion Forecast, by Country 2020 & 2033
- Table 21: Germany Waterproofing Admixture Industry Revenue (billion) Forecast, by Application 2020 & 2033
- Table 22: United Kingdom Waterproofing Admixture Industry Revenue (billion) Forecast, by Application 2020 & 2033
- Table 23: Italy Waterproofing Admixture Industry Revenue (billion) Forecast, by Application 2020 & 2033
- Table 24: France Waterproofing Admixture Industry Revenue (billion) Forecast, by Application 2020 & 2033
- Table 25: Rest of Europe Waterproofing Admixture Industry Revenue (billion) Forecast, by Application 2020 & 2033
- Table 26: Global Waterproofing Admixture Industry Revenue billion Forecast, by Type 2020 & 2033
- Table 27: Global Waterproofing Admixture Industry Revenue billion Forecast, by Application 2020 & 2033
- Table 28: Global Waterproofing Admixture Industry Revenue billion Forecast, by Country 2020 & 2033
- Table 29: Brazil Waterproofing Admixture Industry Revenue (billion) Forecast, by Application 2020 & 2033
- Table 30: Argentina Waterproofing Admixture Industry Revenue (billion) Forecast, by Application 2020 & 2033
- Table 31: Rest of South America Waterproofing Admixture Industry Revenue (billion) Forecast, by Application 2020 & 2033
- Table 32: Global Waterproofing Admixture Industry Revenue billion Forecast, by Type 2020 & 2033
- Table 33: Global Waterproofing Admixture Industry Revenue billion Forecast, by Application 2020 & 2033
- Table 34: Global Waterproofing Admixture Industry Revenue billion Forecast, by Country 2020 & 2033
- Table 35: Saudi Arabia Waterproofing Admixture Industry Revenue (billion) Forecast, by Application 2020 & 2033
- Table 36: South Africa Waterproofing Admixture Industry Revenue (billion) Forecast, by Application 2020 & 2033
- Table 37: Rest of Middle East and Africa Waterproofing Admixture Industry Revenue (billion) Forecast, by Application 2020 & 2033
Frequently Asked Questions
1. What is the projected Compound Annual Growth Rate (CAGR) of the Waterproofing Admixture Industry?
The projected CAGR is approximately 7.52%.
2. Which companies are prominent players in the Waterproofing Admixture Industry?
Key companies in the market include Penetron, Acme Concrete Mixers Pvt Ltd, Tripolarcon Pvt Ltd, United Engineering Company, Kryton International Inc, BASF SE, Perma construction Aids Pvt Ltd, Xypex Chemical Corporation*List Not Exhaustive, Fosroc Inc, MAPEI S p A, Sika AG, W R Grace & Co -Conn, ECMAS Group, SUNANDA SPECIALITY COATINGS PVT LTD.
3. What are the main segments of the Waterproofing Admixture Industry?
The market segments include Type, Application.
4. Can you provide details about the market size?
The market size is estimated to be USD 7.53 billion as of 2022.
5. What are some drivers contributing to market growth?
Rapid Urbanization in the Developing Countries; Rising Demand for Effective Waterproofing Solutions.
6. What are the notable trends driving market growth?
Increasing Usage in the Residential Construction.
7. Are there any restraints impacting market growth?
Already Established Advance Infrastructure in Developed Countries; Lack of Technical Knowledge with Regard to Waterproofing Admixture Usage.
8. Can you provide examples of recent developments in the market?
In August 2021, Sika AG acquired china based, Shenzhen Landun Holding Co., Ltd., which is a manufacturer and provider of waterproofing products and technologies. The acquisition complements the existing portfolio of Sika AG and offers new growth opportunities in the Chinese waterproofing market.
9. What pricing options are available for accessing the report?
Pricing options include single-user, multi-user, and enterprise licenses priced at USD 4750, USD 5250, and USD 8750 respectively.
10. Is the market size provided in terms of value or volume?
The market size is provided in terms of value, measured in billion.
11. Are there any specific market keywords associated with the report?
Yes, the market keyword associated with the report is "Waterproofing Admixture Industry," which aids in identifying and referencing the specific market segment covered.
12. How do I determine which pricing option suits my needs best?
The pricing options vary based on user requirements and access needs. Individual users may opt for single-user licenses, while businesses requiring broader access may choose multi-user or enterprise licenses for cost-effective access to the report.
13. Are there any additional resources or data provided in the Waterproofing Admixture Industry report?
While the report offers comprehensive insights, it's advisable to review the specific contents or supplementary materials provided to ascertain if additional resources or data are available.
14. How can I stay updated on further developments or reports in the Waterproofing Admixture Industry?
To stay informed about further developments, trends, and reports in the Waterproofing Admixture Industry, consider subscribing to industry newsletters, following relevant companies and organizations, or regularly checking reputable industry news sources and publications.
Methodology
Step 1 - Identification of Relevant Samples Size from Population Database


Step 2 - Approaches for Defining Global Market Size (Value, Volume* & Price*)

Note*: In applicable scenarios
Step 3 - Data Sources
Primary Research
- Web Analytics
- Survey Reports
- Research Institute
- Latest Research Reports
- Opinion Leaders
Secondary Research
- Annual Reports
- White Paper
- Latest Press Release
- Industry Association
- Paid Database
- Investor Presentations

Step 4 - Data Triangulation
Involves using different sources of information in order to increase the validity of a study
These sources are likely to be stakeholders in a program - participants, other researchers, program staff, other community members, and so on.
Then we put all data in single framework & apply various statistical tools to find out the dynamic on the market.
During the analysis stage, feedback from the stakeholder groups would be compared to determine areas of agreement as well as areas of divergence