

Key Insights
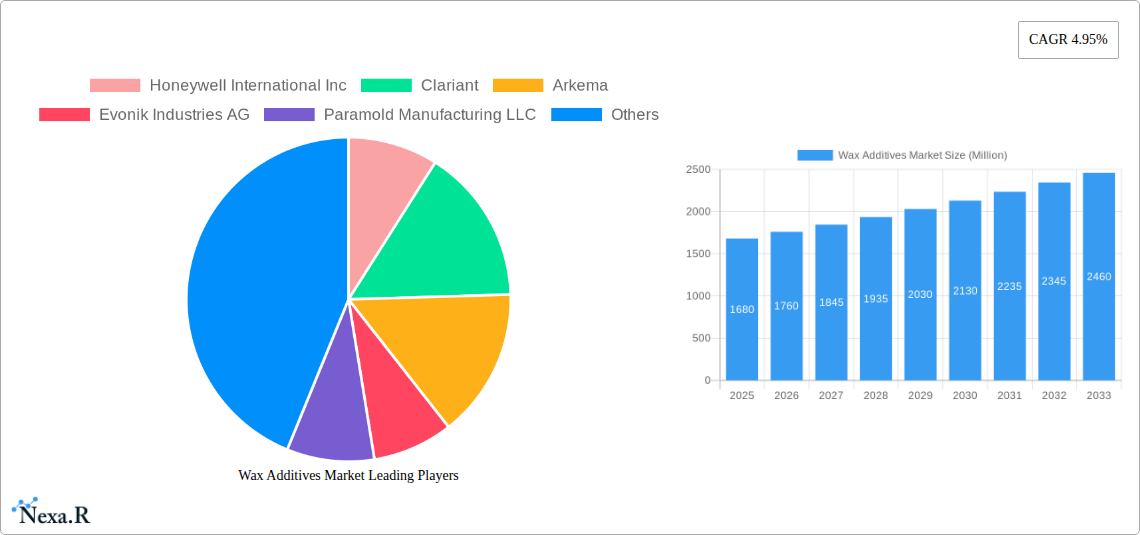
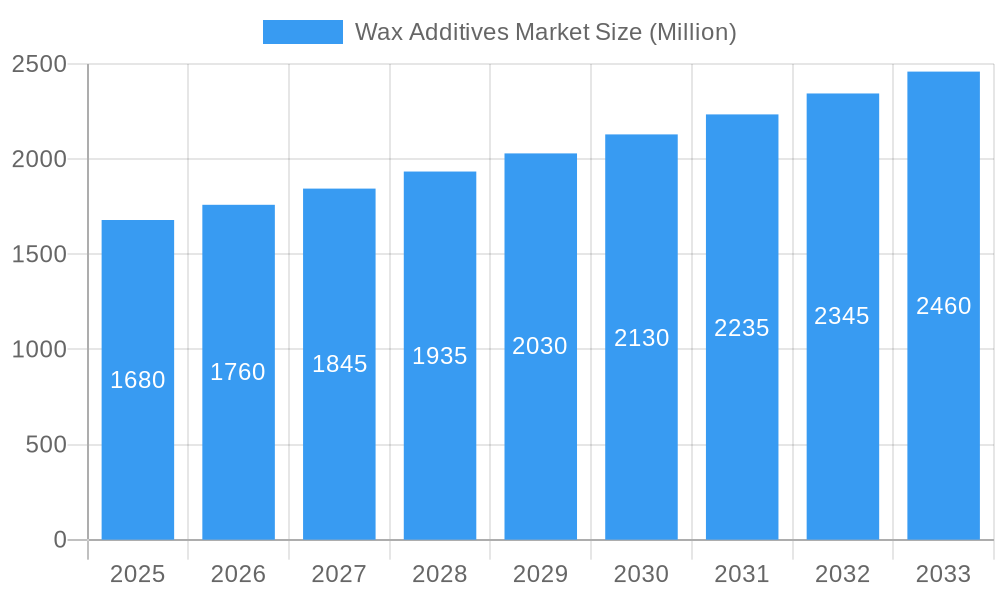
The global wax additives market, valued at $1.68 billion in 2025, is projected to experience robust growth, driven by increasing demand across diverse applications. A compound annual growth rate (CAGR) of 4.95% from 2025 to 2033 signifies a substantial market expansion, primarily fueled by the burgeoning coatings and printing ink industries. The rising popularity of sustainable and eco-friendly alternatives, such as natural wax additives, is also contributing significantly to market growth. Growth in the packaging and cosmetics sectors is also supporting the increasing demand for high-performance wax additives that enhance product quality and durability. However, fluctuating raw material prices and stringent environmental regulations pose challenges to market expansion. The market segmentation reveals that synthetic wax additives currently hold a larger market share due to their superior performance characteristics and cost-effectiveness in high-volume applications. However, the natural and semi-synthetic segments are experiencing significant growth driven by increasing consumer preference for sustainable products and growing environmental concerns. Geographically, North America and Europe currently dominate the market, owing to established industries and high consumption rates, but Asia-Pacific is poised for rapid growth due to its expanding manufacturing sector and increasing demand for consumer goods. Leading players like Honeywell, Clariant, and BASF are investing heavily in R&D to develop innovative wax additives with improved properties, further stimulating market growth. The emulsion type wax additives is expected to grow significantly due to its ease of use and broad applicability in different sectors.
Wax Additives Market Market Size (In Billion)
The competitive landscape is characterized by a mix of large multinational corporations and specialized smaller players. These companies are focusing on strategic partnerships, acquisitions, and new product development to maintain their market position and expand their reach into new geographical regions. Future growth will be influenced by advancements in additive technology, the development of more sustainable alternatives, and the emergence of novel applications in rapidly evolving sectors like renewable energy and advanced materials. Market players are expected to focus on offering customized solutions to meet the specific requirements of various end-use industries, resulting in further market segmentation and specialization. The market's continuous evolution will necessitate a flexible approach from manufacturers to adapt to changing consumer preferences and technological advancements.
Wax Additives Market Company Market Share
Wax Additives Market: A Comprehensive Report (2019-2033)
This comprehensive report provides an in-depth analysis of the global Wax Additives Market, encompassing market dynamics, growth trends, regional insights, and key player strategies. The study period covers 2019-2033, with 2025 as the base year and a forecast period of 2025-2033. The report segments the market by Material (Natural, Semi-synthetic, Synthetic), Type (Dispersion, Emulsion, Micronized), and Application (Coatings, Leather Finishing, Printing Ink, Candles, Other Applications – including Plastic Processing, Adhesives, and Rubber Additives). The market is valued at xx Million in 2025 and is projected to reach xx Million by 2033, exhibiting a CAGR of xx%. Key players analyzed include Honeywell International Inc, Clariant, Arkema, Evonik Industries AG, Paramold Manufacturing LLC, BASF SE, Shamrock Technologies Inc, The Lubrizol Corporation, Tianshi Wax, BYK-CHEMIE GmbH, Münzing Corporation, Innospec, and Concentrol.
Wax Additives Market Market Dynamics & Structure
The Wax Additives market is characterized by a moderately concentrated landscape, with several multinational players holding significant market share. Technological innovation, particularly in developing sustainable and high-performance wax additives, is a major driver. Stringent environmental regulations are influencing the shift towards eco-friendly formulations, while the increasing demand for enhanced performance characteristics in various applications fuels the need for innovative additives. Competitive product substitutes, such as silicone-based additives, pose a challenge. The market exhibits considerable end-user diversity, with significant demand from the coatings, packaging, and automotive industries. M&A activity in the sector is moderate, driven by strategic acquisitions aimed at expanding product portfolios and geographic reach.
- Market Concentration: Moderately concentrated, with top 5 players holding approximately xx% market share in 2025.
- Technological Innovation: Focus on developing bio-based waxes, improved dispersibility, and enhanced performance properties.
- Regulatory Framework: Stringent environmental regulations driving the adoption of sustainable wax additives.
- Competitive Substitutes: Silicone-based additives and other performance materials pose competition.
- End-User Demographics: Diverse range of end-users across various industries, including coatings, plastics, and cosmetics.
- M&A Trends: Moderate M&A activity driven by strategic expansion and technology acquisition.
Wax Additives Market Growth Trends & Insights
The Wax Additives market has witnessed substantial growth during the historical period (2019-2024), driven by increasing demand across diverse end-use sectors. The market size expanded from xx Million in 2019 to xx Million in 2024, reflecting a CAGR of xx%. This growth is attributed to several factors, including rising consumer demand for higher-quality products, technological advancements leading to improved wax additive performance, and expansion into new application areas. Adoption rates for advanced wax additives, such as those with enhanced dispersibility and improved functionality, have been steadily increasing, leading to higher market penetration. Technological disruptions, such as the development of bio-based and sustainable alternatives, are shaping the market landscape. Shifting consumer preferences towards eco-friendly products are further boosting the growth of the market.
- Market Size Evolution: Significant growth observed during the historical period (2019-2024), with a steady increase in market value.
- Adoption Rates: Growing adoption of advanced wax additives with enhanced functionalities and improved performance.
- Technological Disruptions: Development of bio-based waxes and sustainable alternatives is influencing market dynamics.
- Consumer Behavior Shifts: Increasing preference for eco-friendly and sustainable products drives market growth.
Dominant Regions, Countries, or Segments in Wax Additives Market
The coatings application segment holds the largest market share, driven by the robust growth of the construction and automotive industries. Geographically, North America and Europe currently dominate the market, owing to established manufacturing bases and high consumer demand for advanced materials. However, the Asia-Pacific region is expected to exhibit significant growth potential in the coming years, fueled by rapid industrialization and infrastructure development. The synthetic material segment is expected to experience faster growth due to its superior performance characteristics compared to natural and semi-synthetic options.
- Key Drivers: Strong demand from the coatings industry; rapid industrialization and infrastructure development in Asia-Pacific; increasing adoption of synthetic materials for superior performance.
- Dominance Factors: Established manufacturing bases in North America and Europe; high consumer demand in developed regions; potential for high growth in emerging markets.
- Growth Potential: Significant growth potential in the Asia-Pacific region, driven by increasing industrialization and economic development. The synthetic segment offers the greatest potential due to innovation and performance attributes.
Wax Additives Market Product Landscape
The Wax Additives market offers a diverse range of products tailored to various end-use applications. Innovations focus on enhancing dispersibility, improving performance characteristics, and developing sustainable and eco-friendly options. Micronized waxes offer superior fineness and dispersion, while emulsion-based additives provide ease of handling and compatibility with various systems. The unique selling propositions of these products lie in their ability to enhance the properties of the final product, such as improved gloss, scratch resistance, and water repellency. Technological advancements are continuously driving the development of new wax additives with improved performance and sustainability attributes.
Key Drivers, Barriers & Challenges in Wax Additives Market
Key Drivers: Rising demand for high-performance materials across various industries; increasing adoption of sustainable and eco-friendly alternatives; technological advancements leading to improved product functionalities. The construction industry's growth is a major driver due to its high consumption of coatings and related materials containing wax additives.
Challenges and Restraints: Fluctuations in raw material prices; intense competition from substitute materials; stringent environmental regulations and potential supply chain disruptions. These challenges impact profitability and necessitate efficient resource management and proactive regulatory compliance. The impact of supply chain disruptions is estimated to cost the market xx Million annually.
Emerging Opportunities in Wax Additives Market
Emerging opportunities lie in the development of bio-based and renewable wax additives, catering to the growing demand for sustainable products. The expansion into new application areas, such as personal care and food packaging, also presents significant growth potential. The customization of wax additives to meet specific end-user requirements is another key area of opportunity. Untapped markets in developing economies offer considerable potential for future growth.
Growth Accelerators in the Wax Additives Market Industry
Long-term growth will be propelled by technological advancements in wax additive formulation, enabling the development of higher-performing, sustainable, and cost-effective products. Strategic partnerships and collaborations between wax additive manufacturers and end-users will facilitate the development and adoption of innovative solutions. Expansion into new geographic markets and the diversification of applications will further drive market expansion.
Key Players Shaping the Wax Additives Market Market
- Honeywell International Inc
- Clariant
- Arkema
- Evonik Industries AG
- Paramold Manufacturing LLC
- BASF SE
- Shamrock Technologies Inc
- The Lubrizol Corporation
- Tianshi Wax
- BYK-CHEMIE GmbH
- Münzing Corporation
- Innospec
- Concentrol
Notable Milestones in Wax Additives Market Sector
- July 2022: Münzing Corporation announced the startup of a new plant for water-based wax emulsions and specialty additives in Zeitz, Germany, representing a significant investment of over USD 5.19 million. This expansion highlights the increasing demand for sustainable wax additives.
- January 2022: Shamrock Technologies, Inc. announced a USD 19.4 million investment to establish operations in Laurens County, South Carolina, focusing on the production of micronized wax, dispersions, and emulsions. This signifies the growth of the micronized wax segment.
In-Depth Wax Additives Market Market Outlook
The future of the Wax Additives market is bright, driven by ongoing technological advancements, increasing demand for sustainable products, and expansion into new applications. The market is poised for significant growth, offering lucrative opportunities for established players and new entrants alike. Strategic investments in R&D, strategic partnerships, and expansion into emerging markets will be crucial for capturing a larger share of this expanding market. The focus on sustainable solutions and the development of innovative product offerings will further propel market growth in the years to come.
Wax Additives Market Segmentation
-
1. Material
- 1.1. Natural
- 1.2. Semi-synthetic
- 1.3. Synthetic
-
2. Type
- 2.1. Dispersion
- 2.2. Emulsion
- 2.3. Micronized
-
3. Application
- 3.1. Coatings
- 3.2. Leather Finishing
- 3.3. Printing Ink
- 3.4. Candles
- 3.5. Other Ap
Wax Additives Market Segmentation By Geography
-
1. Asia Pacific
- 1.1. China
- 1.2. India
- 1.3. Japan
- 1.4. South Korea
- 1.5. Rest of Asia Pacific
-
2. North America
- 2.1. United States
- 2.2. Canada
- 2.3. Mexico
-
3. Europe
- 3.1. Germany
- 3.2. United Kingdom
- 3.3. Italy
- 3.4. France
- 3.5. Rest of Europe
-
4. South America
- 4.1. Brazil
- 4.2. Argentina
- 4.3. Rest of South America
-
5. Middle East and Africa
- 5.1. Saudi Arabia
- 5.2. South Africa
- 5.3. Rest of Middle East and Africa
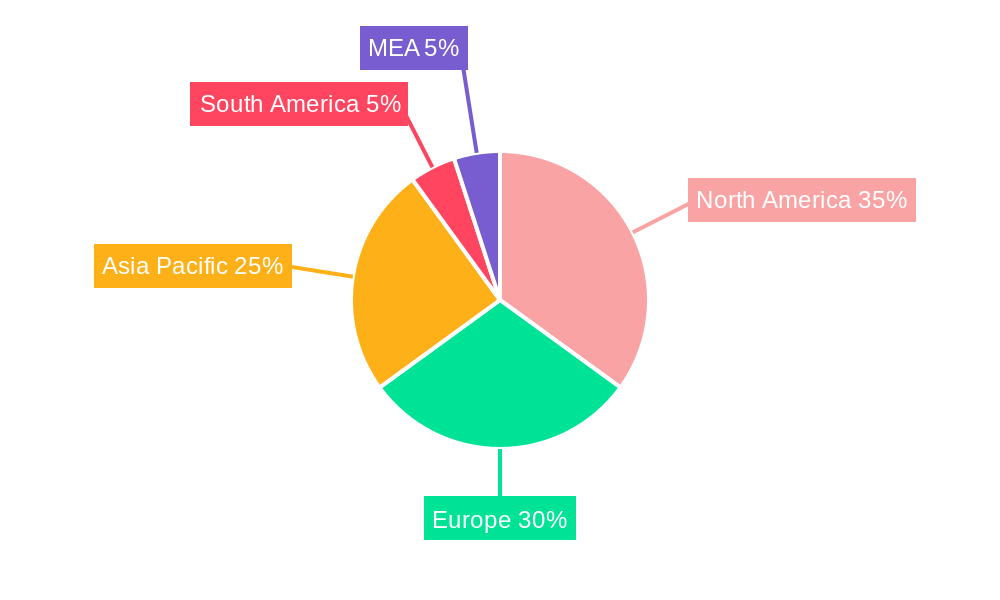
Wax Additives Market Regional Market Share
Geographic Coverage of Wax Additives Market
Wax Additives Market REPORT HIGHLIGHTS
| Aspects | Details |
|---|---|
| Study Period | 2020-2034 |
| Base Year | 2025 |
| Estimated Year | 2026 |
| Forecast Period | 2026-2034 |
| Historical Period | 2020-2025 |
| Growth Rate | CAGR of 4.95% from 2020-2034 |
| Segmentation |
|
Table of Contents
- 1. Introduction
- 1.1. Research Scope
- 1.2. Market Segmentation
- 1.3. Research Objective
- 1.4. Definitions and Assumptions
- 2. Executive Summary
- 2.1. Market Snapshot
- 3. Market Dynamics
- 3.1. Market Drivers
- 3.2. Market Restrains
- 3.3. Market Trends
- 3.4. Market Opportunities
- 4. Market Factor Analysis
- 4.1. Porters Five Forces
- 4.1.1. Bargaining Power of Suppliers
- 4.1.2. Bargaining Power of Buyers
- 4.1.3. Threat of New Entrants
- 4.1.4. Threat of Substitutes
- 4.1.5. Competitive Rivalry
- 4.2. PESTEL analysis
- 4.3. BCG Analysis
- 4.3.1. Stars (High Growth, High Market Share)
- 4.3.2. Cash Cows (Low Growth, High Market Share)
- 4.3.3. Question Mark (High Growth, Low Market Share)
- 4.3.4. Dogs (Low Growth, Low Market Share)
- 4.4. Ansoff Matrix Analysis
- 4.5. Supply Chain Analysis
- 4.6. Regulatory Landscape
- 4.7. Current Market Potential and Opportunity Assessment (TAM–SAM–SOM Framework)
- 4.8. NRP Analyst Note
- 4.1. Porters Five Forces
- 5. Market Analysis, Insights and Forecast 2021-2033
- 5.1. Market Analysis, Insights and Forecast - by Material
- 5.1.1. Natural
- 5.1.2. Semi-synthetic
- 5.1.3. Synthetic
- 5.2. Market Analysis, Insights and Forecast - by Type
- 5.2.1. Dispersion
- 5.2.2. Emulsion
- 5.2.3. Micronized
- 5.3. Market Analysis, Insights and Forecast - by Application
- 5.3.1. Coatings
- 5.3.2. Leather Finishing
- 5.3.3. Printing Ink
- 5.3.4. Candles
- 5.3.5. Other Ap
- 5.4. Market Analysis, Insights and Forecast - by Region
- 5.4.1. Asia Pacific
- 5.4.2. North America
- 5.4.3. Europe
- 5.4.4. South America
- 5.4.5. Middle East and Africa
- 5.1. Market Analysis, Insights and Forecast - by Material
- 6. Global Wax Additives Market Analysis, Insights and Forecast, 2021-2033
- 6.1. Market Analysis, Insights and Forecast - by Material
- 6.1.1. Natural
- 6.1.2. Semi-synthetic
- 6.1.3. Synthetic
- 6.2. Market Analysis, Insights and Forecast - by Type
- 6.2.1. Dispersion
- 6.2.2. Emulsion
- 6.2.3. Micronized
- 6.3. Market Analysis, Insights and Forecast - by Application
- 6.3.1. Coatings
- 6.3.2. Leather Finishing
- 6.3.3. Printing Ink
- 6.3.4. Candles
- 6.3.5. Other Ap
- 6.1. Market Analysis, Insights and Forecast - by Material
- 7. Asia Pacific Wax Additives Market Analysis, Insights and Forecast, 2020-2032
- 7.1. Market Analysis, Insights and Forecast - by Material
- 7.1.1. Natural
- 7.1.2. Semi-synthetic
- 7.1.3. Synthetic
- 7.2. Market Analysis, Insights and Forecast - by Type
- 7.2.1. Dispersion
- 7.2.2. Emulsion
- 7.2.3. Micronized
- 7.3. Market Analysis, Insights and Forecast - by Application
- 7.3.1. Coatings
- 7.3.2. Leather Finishing
- 7.3.3. Printing Ink
- 7.3.4. Candles
- 7.3.5. Other Ap
- 7.1. Market Analysis, Insights and Forecast - by Material
- 8. North America Wax Additives Market Analysis, Insights and Forecast, 2020-2032
- 8.1. Market Analysis, Insights and Forecast - by Material
- 8.1.1. Natural
- 8.1.2. Semi-synthetic
- 8.1.3. Synthetic
- 8.2. Market Analysis, Insights and Forecast - by Type
- 8.2.1. Dispersion
- 8.2.2. Emulsion
- 8.2.3. Micronized
- 8.3. Market Analysis, Insights and Forecast - by Application
- 8.3.1. Coatings
- 8.3.2. Leather Finishing
- 8.3.3. Printing Ink
- 8.3.4. Candles
- 8.3.5. Other Ap
- 8.1. Market Analysis, Insights and Forecast - by Material
- 9. Europe Wax Additives Market Analysis, Insights and Forecast, 2020-2032
- 9.1. Market Analysis, Insights and Forecast - by Material
- 9.1.1. Natural
- 9.1.2. Semi-synthetic
- 9.1.3. Synthetic
- 9.2. Market Analysis, Insights and Forecast - by Type
- 9.2.1. Dispersion
- 9.2.2. Emulsion
- 9.2.3. Micronized
- 9.3. Market Analysis, Insights and Forecast - by Application
- 9.3.1. Coatings
- 9.3.2. Leather Finishing
- 9.3.3. Printing Ink
- 9.3.4. Candles
- 9.3.5. Other Ap
- 9.1. Market Analysis, Insights and Forecast - by Material
- 10. South America Wax Additives Market Analysis, Insights and Forecast, 2020-2032
- 10.1. Market Analysis, Insights and Forecast - by Material
- 10.1.1. Natural
- 10.1.2. Semi-synthetic
- 10.1.3. Synthetic
- 10.2. Market Analysis, Insights and Forecast - by Type
- 10.2.1. Dispersion
- 10.2.2. Emulsion
- 10.2.3. Micronized
- 10.3. Market Analysis, Insights and Forecast - by Application
- 10.3.1. Coatings
- 10.3.2. Leather Finishing
- 10.3.3. Printing Ink
- 10.3.4. Candles
- 10.3.5. Other Ap
- 10.1. Market Analysis, Insights and Forecast - by Material
- 11. Middle East and Africa Wax Additives Market Analysis, Insights and Forecast, 2020-2032
- 11.1. Market Analysis, Insights and Forecast - by Material
- 11.1.1. Natural
- 11.1.2. Semi-synthetic
- 11.1.3. Synthetic
- 11.2. Market Analysis, Insights and Forecast - by Type
- 11.2.1. Dispersion
- 11.2.2. Emulsion
- 11.2.3. Micronized
- 11.3. Market Analysis, Insights and Forecast - by Application
- 11.3.1. Coatings
- 11.3.2. Leather Finishing
- 11.3.3. Printing Ink
- 11.3.4. Candles
- 11.3.5. Other Ap
- 11.1. Market Analysis, Insights and Forecast - by Material
- 12. Competitive Analysis
- 12.1. Company Profiles
- 12.1.1 Honeywell International Inc
- 12.1.1.1. Company Overview
- 12.1.1.2. Products
- 12.1.1.3. Company Financials
- 12.1.1.4. SWOT Analysis
- 12.1.2 Clariant
- 12.1.2.1. Company Overview
- 12.1.2.2. Products
- 12.1.2.3. Company Financials
- 12.1.2.4. SWOT Analysis
- 12.1.3 Arkema
- 12.1.3.1. Company Overview
- 12.1.3.2. Products
- 12.1.3.3. Company Financials
- 12.1.3.4. SWOT Analysis
- 12.1.4 Evonik Industries AG
- 12.1.4.1. Company Overview
- 12.1.4.2. Products
- 12.1.4.3. Company Financials
- 12.1.4.4. SWOT Analysis
- 12.1.5 Paramold Manufacturing LLC
- 12.1.5.1. Company Overview
- 12.1.5.2. Products
- 12.1.5.3. Company Financials
- 12.1.5.4. SWOT Analysis
- 12.1.6 BASF SE
- 12.1.6.1. Company Overview
- 12.1.6.2. Products
- 12.1.6.3. Company Financials
- 12.1.6.4. SWOT Analysis
- 12.1.7 Shamrock Technologies Inc
- 12.1.7.1. Company Overview
- 12.1.7.2. Products
- 12.1.7.3. Company Financials
- 12.1.7.4. SWOT Analysis
- 12.1.8 The Lubrizol Corporation
- 12.1.8.1. Company Overview
- 12.1.8.2. Products
- 12.1.8.3. Company Financials
- 12.1.8.4. SWOT Analysis
- 12.1.9 Tianshi Wax
- 12.1.9.1. Company Overview
- 12.1.9.2. Products
- 12.1.9.3. Company Financials
- 12.1.9.4. SWOT Analysis
- 12.1.10 BYK-CHEMIE GmbH
- 12.1.10.1. Company Overview
- 12.1.10.2. Products
- 12.1.10.3. Company Financials
- 12.1.10.4. SWOT Analysis
- 12.1.11 Münzing Corporation
- 12.1.11.1. Company Overview
- 12.1.11.2. Products
- 12.1.11.3. Company Financials
- 12.1.11.4. SWOT Analysis
- 12.1.12 Innospec
- 12.1.12.1. Company Overview
- 12.1.12.2. Products
- 12.1.12.3. Company Financials
- 12.1.12.4. SWOT Analysis
- 12.1.13 Concentrol
- 12.1.13.1. Company Overview
- 12.1.13.2. Products
- 12.1.13.3. Company Financials
- 12.1.13.4. SWOT Analysis
- 12.1.1 Honeywell International Inc
- 12.2. Market Entropy
- 12.2.1 Company's Key Areas Served
- 12.2.2 Recent Developments
- 12.3. Company Market Share Analysis 2025
- 12.3.1 Top 5 Companies Market Share Analysis
- 12.3.2 Top 3 Companies Market Share Analysis
- 12.4. List of Potential Customers
- 13. Research Methodology
List of Figures
- Figure 1: Global Wax Additives Market Revenue Breakdown (Million, %) by Region 2025 & 2033
- Figure 2: Global Wax Additives Market Volume Breakdown (K Tons, %) by Region 2025 & 2033
- Figure 3: Asia Pacific Wax Additives Market Revenue (Million), by Material 2025 & 2033
- Figure 4: Asia Pacific Wax Additives Market Volume (K Tons), by Material 2025 & 2033
- Figure 5: Asia Pacific Wax Additives Market Revenue Share (%), by Material 2025 & 2033
- Figure 6: Asia Pacific Wax Additives Market Volume Share (%), by Material 2025 & 2033
- Figure 7: Asia Pacific Wax Additives Market Revenue (Million), by Type 2025 & 2033
- Figure 8: Asia Pacific Wax Additives Market Volume (K Tons), by Type 2025 & 2033
- Figure 9: Asia Pacific Wax Additives Market Revenue Share (%), by Type 2025 & 2033
- Figure 10: Asia Pacific Wax Additives Market Volume Share (%), by Type 2025 & 2033
- Figure 11: Asia Pacific Wax Additives Market Revenue (Million), by Application 2025 & 2033
- Figure 12: Asia Pacific Wax Additives Market Volume (K Tons), by Application 2025 & 2033
- Figure 13: Asia Pacific Wax Additives Market Revenue Share (%), by Application 2025 & 2033
- Figure 14: Asia Pacific Wax Additives Market Volume Share (%), by Application 2025 & 2033
- Figure 15: Asia Pacific Wax Additives Market Revenue (Million), by Country 2025 & 2033
- Figure 16: Asia Pacific Wax Additives Market Volume (K Tons), by Country 2025 & 2033
- Figure 17: Asia Pacific Wax Additives Market Revenue Share (%), by Country 2025 & 2033
- Figure 18: Asia Pacific Wax Additives Market Volume Share (%), by Country 2025 & 2033
- Figure 19: North America Wax Additives Market Revenue (Million), by Material 2025 & 2033
- Figure 20: North America Wax Additives Market Volume (K Tons), by Material 2025 & 2033
- Figure 21: North America Wax Additives Market Revenue Share (%), by Material 2025 & 2033
- Figure 22: North America Wax Additives Market Volume Share (%), by Material 2025 & 2033
- Figure 23: North America Wax Additives Market Revenue (Million), by Type 2025 & 2033
- Figure 24: North America Wax Additives Market Volume (K Tons), by Type 2025 & 2033
- Figure 25: North America Wax Additives Market Revenue Share (%), by Type 2025 & 2033
- Figure 26: North America Wax Additives Market Volume Share (%), by Type 2025 & 2033
- Figure 27: North America Wax Additives Market Revenue (Million), by Application 2025 & 2033
- Figure 28: North America Wax Additives Market Volume (K Tons), by Application 2025 & 2033
- Figure 29: North America Wax Additives Market Revenue Share (%), by Application 2025 & 2033
- Figure 30: North America Wax Additives Market Volume Share (%), by Application 2025 & 2033
- Figure 31: North America Wax Additives Market Revenue (Million), by Country 2025 & 2033
- Figure 32: North America Wax Additives Market Volume (K Tons), by Country 2025 & 2033
- Figure 33: North America Wax Additives Market Revenue Share (%), by Country 2025 & 2033
- Figure 34: North America Wax Additives Market Volume Share (%), by Country 2025 & 2033
- Figure 35: Europe Wax Additives Market Revenue (Million), by Material 2025 & 2033
- Figure 36: Europe Wax Additives Market Volume (K Tons), by Material 2025 & 2033
- Figure 37: Europe Wax Additives Market Revenue Share (%), by Material 2025 & 2033
- Figure 38: Europe Wax Additives Market Volume Share (%), by Material 2025 & 2033
- Figure 39: Europe Wax Additives Market Revenue (Million), by Type 2025 & 2033
- Figure 40: Europe Wax Additives Market Volume (K Tons), by Type 2025 & 2033
- Figure 41: Europe Wax Additives Market Revenue Share (%), by Type 2025 & 2033
- Figure 42: Europe Wax Additives Market Volume Share (%), by Type 2025 & 2033
- Figure 43: Europe Wax Additives Market Revenue (Million), by Application 2025 & 2033
- Figure 44: Europe Wax Additives Market Volume (K Tons), by Application 2025 & 2033
- Figure 45: Europe Wax Additives Market Revenue Share (%), by Application 2025 & 2033
- Figure 46: Europe Wax Additives Market Volume Share (%), by Application 2025 & 2033
- Figure 47: Europe Wax Additives Market Revenue (Million), by Country 2025 & 2033
- Figure 48: Europe Wax Additives Market Volume (K Tons), by Country 2025 & 2033
- Figure 49: Europe Wax Additives Market Revenue Share (%), by Country 2025 & 2033
- Figure 50: Europe Wax Additives Market Volume Share (%), by Country 2025 & 2033
- Figure 51: South America Wax Additives Market Revenue (Million), by Material 2025 & 2033
- Figure 52: South America Wax Additives Market Volume (K Tons), by Material 2025 & 2033
- Figure 53: South America Wax Additives Market Revenue Share (%), by Material 2025 & 2033
- Figure 54: South America Wax Additives Market Volume Share (%), by Material 2025 & 2033
- Figure 55: South America Wax Additives Market Revenue (Million), by Type 2025 & 2033
- Figure 56: South America Wax Additives Market Volume (K Tons), by Type 2025 & 2033
- Figure 57: South America Wax Additives Market Revenue Share (%), by Type 2025 & 2033
- Figure 58: South America Wax Additives Market Volume Share (%), by Type 2025 & 2033
- Figure 59: South America Wax Additives Market Revenue (Million), by Application 2025 & 2033
- Figure 60: South America Wax Additives Market Volume (K Tons), by Application 2025 & 2033
- Figure 61: South America Wax Additives Market Revenue Share (%), by Application 2025 & 2033
- Figure 62: South America Wax Additives Market Volume Share (%), by Application 2025 & 2033
- Figure 63: South America Wax Additives Market Revenue (Million), by Country 2025 & 2033
- Figure 64: South America Wax Additives Market Volume (K Tons), by Country 2025 & 2033
- Figure 65: South America Wax Additives Market Revenue Share (%), by Country 2025 & 2033
- Figure 66: South America Wax Additives Market Volume Share (%), by Country 2025 & 2033
- Figure 67: Middle East and Africa Wax Additives Market Revenue (Million), by Material 2025 & 2033
- Figure 68: Middle East and Africa Wax Additives Market Volume (K Tons), by Material 2025 & 2033
- Figure 69: Middle East and Africa Wax Additives Market Revenue Share (%), by Material 2025 & 2033
- Figure 70: Middle East and Africa Wax Additives Market Volume Share (%), by Material 2025 & 2033
- Figure 71: Middle East and Africa Wax Additives Market Revenue (Million), by Type 2025 & 2033
- Figure 72: Middle East and Africa Wax Additives Market Volume (K Tons), by Type 2025 & 2033
- Figure 73: Middle East and Africa Wax Additives Market Revenue Share (%), by Type 2025 & 2033
- Figure 74: Middle East and Africa Wax Additives Market Volume Share (%), by Type 2025 & 2033
- Figure 75: Middle East and Africa Wax Additives Market Revenue (Million), by Application 2025 & 2033
- Figure 76: Middle East and Africa Wax Additives Market Volume (K Tons), by Application 2025 & 2033
- Figure 77: Middle East and Africa Wax Additives Market Revenue Share (%), by Application 2025 & 2033
- Figure 78: Middle East and Africa Wax Additives Market Volume Share (%), by Application 2025 & 2033
- Figure 79: Middle East and Africa Wax Additives Market Revenue (Million), by Country 2025 & 2033
- Figure 80: Middle East and Africa Wax Additives Market Volume (K Tons), by Country 2025 & 2033
- Figure 81: Middle East and Africa Wax Additives Market Revenue Share (%), by Country 2025 & 2033
- Figure 82: Middle East and Africa Wax Additives Market Volume Share (%), by Country 2025 & 2033
List of Tables
- Table 1: Global Wax Additives Market Revenue Million Forecast, by Material 2020 & 2033
- Table 2: Global Wax Additives Market Volume K Tons Forecast, by Material 2020 & 2033
- Table 3: Global Wax Additives Market Revenue Million Forecast, by Type 2020 & 2033
- Table 4: Global Wax Additives Market Volume K Tons Forecast, by Type 2020 & 2033
- Table 5: Global Wax Additives Market Revenue Million Forecast, by Application 2020 & 2033
- Table 6: Global Wax Additives Market Volume K Tons Forecast, by Application 2020 & 2033
- Table 7: Global Wax Additives Market Revenue Million Forecast, by Region 2020 & 2033
- Table 8: Global Wax Additives Market Volume K Tons Forecast, by Region 2020 & 2033
- Table 9: Global Wax Additives Market Revenue Million Forecast, by Material 2020 & 2033
- Table 10: Global Wax Additives Market Volume K Tons Forecast, by Material 2020 & 2033
- Table 11: Global Wax Additives Market Revenue Million Forecast, by Type 2020 & 2033
- Table 12: Global Wax Additives Market Volume K Tons Forecast, by Type 2020 & 2033
- Table 13: Global Wax Additives Market Revenue Million Forecast, by Application 2020 & 2033
- Table 14: Global Wax Additives Market Volume K Tons Forecast, by Application 2020 & 2033
- Table 15: Global Wax Additives Market Revenue Million Forecast, by Country 2020 & 2033
- Table 16: Global Wax Additives Market Volume K Tons Forecast, by Country 2020 & 2033
- Table 17: China Wax Additives Market Revenue (Million) Forecast, by Application 2020 & 2033
- Table 18: China Wax Additives Market Volume (K Tons) Forecast, by Application 2020 & 2033
- Table 19: India Wax Additives Market Revenue (Million) Forecast, by Application 2020 & 2033
- Table 20: India Wax Additives Market Volume (K Tons) Forecast, by Application 2020 & 2033
- Table 21: Japan Wax Additives Market Revenue (Million) Forecast, by Application 2020 & 2033
- Table 22: Japan Wax Additives Market Volume (K Tons) Forecast, by Application 2020 & 2033
- Table 23: South Korea Wax Additives Market Revenue (Million) Forecast, by Application 2020 & 2033
- Table 24: South Korea Wax Additives Market Volume (K Tons) Forecast, by Application 2020 & 2033
- Table 25: Rest of Asia Pacific Wax Additives Market Revenue (Million) Forecast, by Application 2020 & 2033
- Table 26: Rest of Asia Pacific Wax Additives Market Volume (K Tons) Forecast, by Application 2020 & 2033
- Table 27: Global Wax Additives Market Revenue Million Forecast, by Material 2020 & 2033
- Table 28: Global Wax Additives Market Volume K Tons Forecast, by Material 2020 & 2033
- Table 29: Global Wax Additives Market Revenue Million Forecast, by Type 2020 & 2033
- Table 30: Global Wax Additives Market Volume K Tons Forecast, by Type 2020 & 2033
- Table 31: Global Wax Additives Market Revenue Million Forecast, by Application 2020 & 2033
- Table 32: Global Wax Additives Market Volume K Tons Forecast, by Application 2020 & 2033
- Table 33: Global Wax Additives Market Revenue Million Forecast, by Country 2020 & 2033
- Table 34: Global Wax Additives Market Volume K Tons Forecast, by Country 2020 & 2033
- Table 35: United States Wax Additives Market Revenue (Million) Forecast, by Application 2020 & 2033
- Table 36: United States Wax Additives Market Volume (K Tons) Forecast, by Application 2020 & 2033
- Table 37: Canada Wax Additives Market Revenue (Million) Forecast, by Application 2020 & 2033
- Table 38: Canada Wax Additives Market Volume (K Tons) Forecast, by Application 2020 & 2033
- Table 39: Mexico Wax Additives Market Revenue (Million) Forecast, by Application 2020 & 2033
- Table 40: Mexico Wax Additives Market Volume (K Tons) Forecast, by Application 2020 & 2033
- Table 41: Global Wax Additives Market Revenue Million Forecast, by Material 2020 & 2033
- Table 42: Global Wax Additives Market Volume K Tons Forecast, by Material 2020 & 2033
- Table 43: Global Wax Additives Market Revenue Million Forecast, by Type 2020 & 2033
- Table 44: Global Wax Additives Market Volume K Tons Forecast, by Type 2020 & 2033
- Table 45: Global Wax Additives Market Revenue Million Forecast, by Application 2020 & 2033
- Table 46: Global Wax Additives Market Volume K Tons Forecast, by Application 2020 & 2033
- Table 47: Global Wax Additives Market Revenue Million Forecast, by Country 2020 & 2033
- Table 48: Global Wax Additives Market Volume K Tons Forecast, by Country 2020 & 2033
- Table 49: Germany Wax Additives Market Revenue (Million) Forecast, by Application 2020 & 2033
- Table 50: Germany Wax Additives Market Volume (K Tons) Forecast, by Application 2020 & 2033
- Table 51: United Kingdom Wax Additives Market Revenue (Million) Forecast, by Application 2020 & 2033
- Table 52: United Kingdom Wax Additives Market Volume (K Tons) Forecast, by Application 2020 & 2033
- Table 53: Italy Wax Additives Market Revenue (Million) Forecast, by Application 2020 & 2033
- Table 54: Italy Wax Additives Market Volume (K Tons) Forecast, by Application 2020 & 2033
- Table 55: France Wax Additives Market Revenue (Million) Forecast, by Application 2020 & 2033
- Table 56: France Wax Additives Market Volume (K Tons) Forecast, by Application 2020 & 2033
- Table 57: Rest of Europe Wax Additives Market Revenue (Million) Forecast, by Application 2020 & 2033
- Table 58: Rest of Europe Wax Additives Market Volume (K Tons) Forecast, by Application 2020 & 2033
- Table 59: Global Wax Additives Market Revenue Million Forecast, by Material 2020 & 2033
- Table 60: Global Wax Additives Market Volume K Tons Forecast, by Material 2020 & 2033
- Table 61: Global Wax Additives Market Revenue Million Forecast, by Type 2020 & 2033
- Table 62: Global Wax Additives Market Volume K Tons Forecast, by Type 2020 & 2033
- Table 63: Global Wax Additives Market Revenue Million Forecast, by Application 2020 & 2033
- Table 64: Global Wax Additives Market Volume K Tons Forecast, by Application 2020 & 2033
- Table 65: Global Wax Additives Market Revenue Million Forecast, by Country 2020 & 2033
- Table 66: Global Wax Additives Market Volume K Tons Forecast, by Country 2020 & 2033
- Table 67: Brazil Wax Additives Market Revenue (Million) Forecast, by Application 2020 & 2033
- Table 68: Brazil Wax Additives Market Volume (K Tons) Forecast, by Application 2020 & 2033
- Table 69: Argentina Wax Additives Market Revenue (Million) Forecast, by Application 2020 & 2033
- Table 70: Argentina Wax Additives Market Volume (K Tons) Forecast, by Application 2020 & 2033
- Table 71: Rest of South America Wax Additives Market Revenue (Million) Forecast, by Application 2020 & 2033
- Table 72: Rest of South America Wax Additives Market Volume (K Tons) Forecast, by Application 2020 & 2033
- Table 73: Global Wax Additives Market Revenue Million Forecast, by Material 2020 & 2033
- Table 74: Global Wax Additives Market Volume K Tons Forecast, by Material 2020 & 2033
- Table 75: Global Wax Additives Market Revenue Million Forecast, by Type 2020 & 2033
- Table 76: Global Wax Additives Market Volume K Tons Forecast, by Type 2020 & 2033
- Table 77: Global Wax Additives Market Revenue Million Forecast, by Application 2020 & 2033
- Table 78: Global Wax Additives Market Volume K Tons Forecast, by Application 2020 & 2033
- Table 79: Global Wax Additives Market Revenue Million Forecast, by Country 2020 & 2033
- Table 80: Global Wax Additives Market Volume K Tons Forecast, by Country 2020 & 2033
- Table 81: Saudi Arabia Wax Additives Market Revenue (Million) Forecast, by Application 2020 & 2033
- Table 82: Saudi Arabia Wax Additives Market Volume (K Tons) Forecast, by Application 2020 & 2033
- Table 83: South Africa Wax Additives Market Revenue (Million) Forecast, by Application 2020 & 2033
- Table 84: South Africa Wax Additives Market Volume (K Tons) Forecast, by Application 2020 & 2033
- Table 85: Rest of Middle East and Africa Wax Additives Market Revenue (Million) Forecast, by Application 2020 & 2033
- Table 86: Rest of Middle East and Africa Wax Additives Market Volume (K Tons) Forecast, by Application 2020 & 2033
Frequently Asked Questions
1. What is the projected Compound Annual Growth Rate (CAGR) of the Wax Additives Market?
The projected CAGR is approximately 4.95%.
2. Which companies are prominent players in the Wax Additives Market?
Key companies in the market include Honeywell International Inc, Clariant, Arkema, Evonik Industries AG, Paramold Manufacturing LLC, BASF SE, Shamrock Technologies Inc, The Lubrizol Corporation, Tianshi Wax , BYK-CHEMIE GmbH, Münzing Corporation, Innospec, Concentrol.
3. What are the main segments of the Wax Additives Market?
The market segments include Material, Type, Application.
4. Can you provide details about the market size?
The market size is estimated to be USD 1.68 Million as of 2022.
5. What are some drivers contributing to market growth?
Growing Consumption of Candles in Home Decor and Health Centers; Wax Additives Benefits in Coatings and Inks.
6. What are the notable trends driving market growth?
Wax Additives Expected to find High Demand in Coatings Segment.
7. Are there any restraints impacting market growth?
Volatility in Crude Oil Price.
8. Can you provide examples of recent developments in the market?
July 2022: Munzing announced the start-up of water-based wax emulsions and other specialty additives at their new plant in Zeitz Chemical and Industrial Park. The plant, built over 20,000 sq m with an investment of more than EUR 50 million (USD 5.19 million), includes the possibility of further expansion on land that is still undeveloped.
9. What pricing options are available for accessing the report?
Pricing options include single-user, multi-user, and enterprise licenses priced at USD 4750, USD 5250, and USD 8750 respectively.
10. Is the market size provided in terms of value or volume?
The market size is provided in terms of value, measured in Million and volume, measured in K Tons.
11. Are there any specific market keywords associated with the report?
Yes, the market keyword associated with the report is "Wax Additives Market," which aids in identifying and referencing the specific market segment covered.
12. How do I determine which pricing option suits my needs best?
The pricing options vary based on user requirements and access needs. Individual users may opt for single-user licenses, while businesses requiring broader access may choose multi-user or enterprise licenses for cost-effective access to the report.
13. Are there any additional resources or data provided in the Wax Additives Market report?
While the report offers comprehensive insights, it's advisable to review the specific contents or supplementary materials provided to ascertain if additional resources or data are available.
14. How can I stay updated on further developments or reports in the Wax Additives Market?
To stay informed about further developments, trends, and reports in the Wax Additives Market, consider subscribing to industry newsletters, following relevant companies and organizations, or regularly checking reputable industry news sources and publications.
Methodology
Step 1 - Identification of Relevant Samples Size from Population Database


Step 2 - Approaches for Defining Global Market Size (Value, Volume* & Price*)

Note*: In applicable scenarios
Step 3 - Data Sources
Primary Research
- Web Analytics
- Survey Reports
- Research Institute
- Latest Research Reports
- Opinion Leaders
Secondary Research
- Annual Reports
- White Paper
- Latest Press Release
- Industry Association
- Paid Database
- Investor Presentations

Step 4 - Data Triangulation
Involves using different sources of information in order to increase the validity of a study
These sources are likely to be stakeholders in a program - participants, other researchers, program staff, other community members, and so on.
Then we put all data in single framework & apply various statistical tools to find out the dynamic on the market.
During the analysis stage, feedback from the stakeholder groups would be compared to determine areas of agreement as well as areas of divergence