

Key Insights
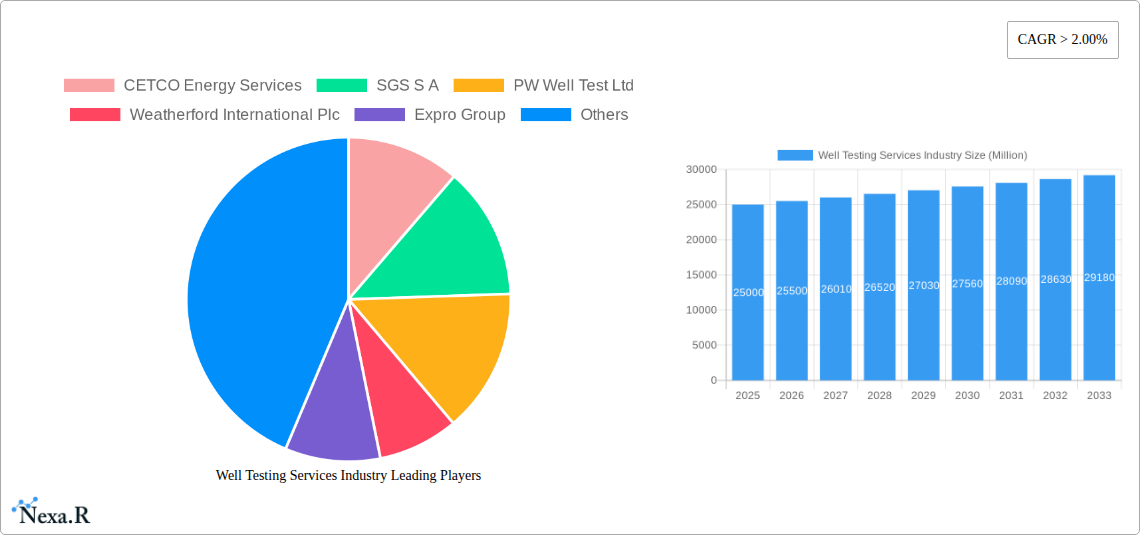
The well testing services market, currently experiencing robust growth with a CAGR exceeding 2.00%, presents significant opportunities for industry players. Driven by increasing exploration and production activities globally, particularly in unconventional oil and gas reserves (shale, deepwater), the demand for sophisticated well testing services is expected to surge. Technological advancements, such as improved sensors, data analytics, and remote operations, are further enhancing efficiency and reducing operational costs, fueling market expansion. The market is segmented by stage (exploration, appraisal & development, production) and location (onshore, offshore), with onshore currently dominating due to higher accessibility and lower initial investment costs. However, offshore segments are projected to witness faster growth driven by the discovery and exploitation of substantial reserves in deepwater environments. Key players, including CETCO Energy Services, SGS S.A., PW Well Test Ltd., Weatherford International Plc, Expro Group, TETRA Technologies Inc., Baker Hughes Company, Halliburton Company, Schlumberger Limited, and China Oilfield Services Limited, are actively competing through technological innovation and strategic acquisitions to capture market share. Regional variations exist, with North America and the Asia-Pacific region anticipated to be key growth drivers, fueled by robust exploration activities and substantial investments in energy infrastructure.
The restraints on market growth primarily include fluctuating oil and gas prices, stringent regulatory frameworks, and environmental concerns related to drilling and production activities. However, the growing focus on sustainable practices and technological advancements aimed at minimizing environmental impact are expected to mitigate these challenges. The forecast period (2025-2033) promises substantial growth, with the market expected to expand considerably, driven by the factors mentioned above and increasing demand for reliable and efficient well testing solutions across various energy sectors, particularly focusing on data-driven decision-making during the exploration and production processes. This increased reliance on precise data will further fuel the demand for advanced well testing services.
Well Testing Services Industry: A Comprehensive Market Report (2019-2033)
This in-depth report provides a comprehensive analysis of the Well Testing Services industry, encompassing market dynamics, growth trends, competitive landscape, and future outlook. The report covers the period from 2019 to 2033, with 2025 as the base year and estimated year. The study analyzes various segments including Exploration, Appraisal & Development, and Production stages, across Onshore and Offshore deployment locations. The global market size in 2025 is estimated at $XX Billion.
Well Testing Services Industry Market Dynamics & Structure
The Well Testing Services market is characterized by moderate concentration, with key players like Schlumberger Limited, Halliburton Company, and Baker Hughes Company holding significant market share. The combined market share of the top 5 players is estimated at 45% in 2025. Technological innovation, particularly in data analytics and automation, is a major driver, alongside increasing demand for enhanced oil recovery techniques. Regulatory frameworks regarding safety and environmental compliance significantly impact operational costs and market dynamics. The market faces competition from alternative well integrity assessment methods and experiences fluctuations based on oil and gas price volatility. M&A activity has been moderate in recent years, with approximately xx deals recorded between 2019 and 2024.
- Market Concentration: Moderately concentrated, top 5 players holding ~45% market share (2025).
- Technological Innovation: Focus on automation, data analytics, and remote operations.
- Regulatory Landscape: Stringent safety and environmental regulations drive operational costs.
- Competitive Substitutes: Alternative well integrity assessment methods pose some competitive pressure.
- M&A Activity: Approximately xx deals between 2019 and 2024.
- Innovation Barriers: High capital investment, specialized expertise required, and integration challenges within existing infrastructure.
Well Testing Services Industry Growth Trends & Insights
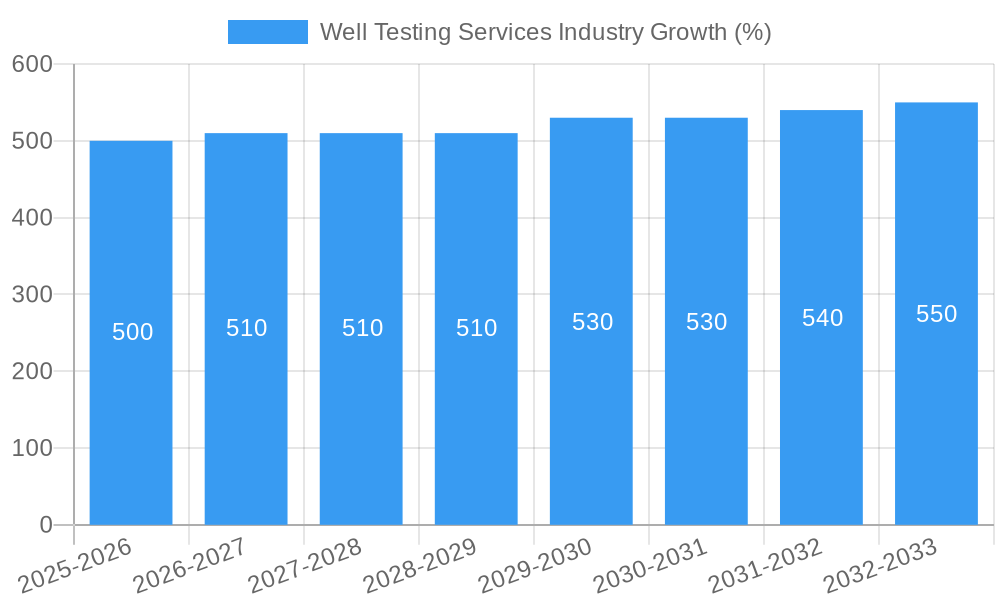
The Well Testing Services market experienced a CAGR of xx% during the historical period (2019-2024) and is projected to grow at a CAGR of xx% during the forecast period (2025-2033), reaching an estimated value of $XX Billion by 2033. This growth is primarily driven by rising global energy demand, increased exploration and production activities, especially in unconventional resources, and the need for improved well integrity management. Adoption of advanced well testing technologies, including automated systems and real-time data analysis, is steadily increasing. The shift towards digitalization and improved data management practices further boosts market growth. Consumer behavior is influenced by increasing regulatory compliance requirements and a strong emphasis on cost-effectiveness and operational efficiency.
Dominant Regions, Countries, or Segments in Well Testing Services Industry
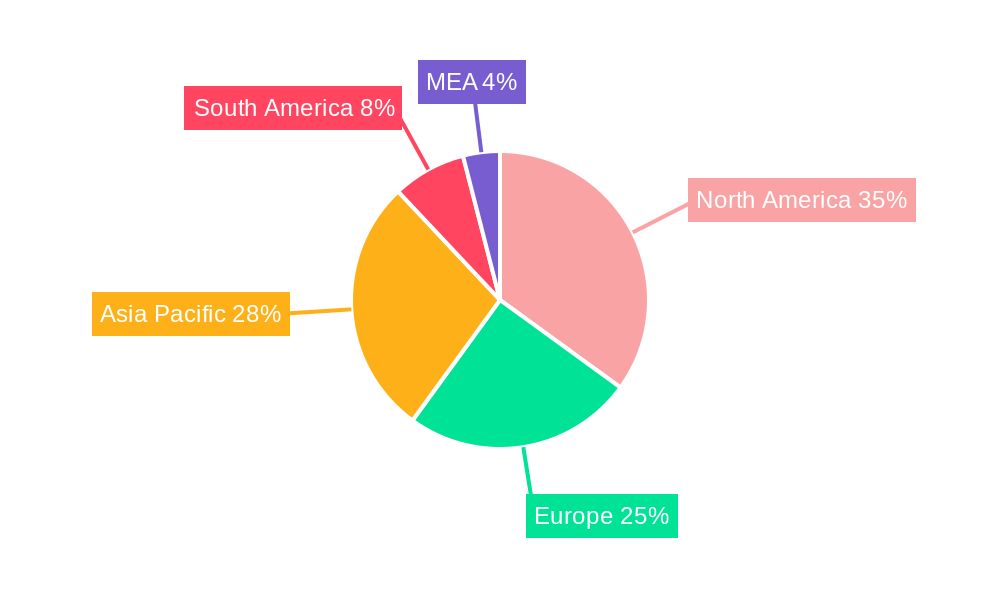
North America (specifically the US) currently dominates the Well Testing Services market, holding approximately 35% of the global market share in 2025. This dominance is attributed to extensive oil and gas reserves, robust exploration and production activities, and a well-established infrastructure. The Middle East and Asia-Pacific regions are showing strong growth potential, fueled by significant investments in upstream activities and increasing energy consumption. Within segments, the Production stage commands the largest share due to the ongoing need for well monitoring and performance optimization. Offshore deployment shows higher growth potential due to increasing deepwater exploration and production activities.
- North America: Strong market leader driven by established infrastructure and high oil & gas activity.
- Middle East & Asia-Pacific: High growth potential due to rising energy demand and investments in upstream projects.
- Production Stage: Dominates the market due to continuous need for well performance optimization.
- Offshore Deployment: Displays higher growth due to increasing deepwater exploration and production.
Well Testing Services Industry Product Landscape
The Well Testing Services market offers a range of products, including pressure testing equipment, flow measurement tools, and data acquisition and analysis systems. Recent innovations focus on improved accuracy, reduced downtime, and enhanced data interpretation capabilities. Key features include miniaturization for improved accessibility in confined spaces, wireless communication capabilities for remote monitoring, and advanced algorithms for data interpretation and predictive analysis. The unique selling proposition often lies in the ability to offer integrated solutions that combine various testing services with data analytics for comprehensive well performance assessment.
Key Drivers, Barriers & Challenges in Well Testing Services Industry
Key Drivers:
- Increasing demand for oil and gas globally.
- Growth in unconventional resource exploration & production.
- Focus on optimizing well performance and maximizing production efficiency.
- Technological advancements enhancing accuracy and efficiency.
Key Challenges:
- Volatility in oil and gas prices affecting investment decisions.
- Stringent safety and environmental regulations increasing operating costs.
- Intense competition among major service providers.
- Supply chain disruptions impacting equipment availability and project timelines. This resulted in a 10% increase in project costs during 2022.
Emerging Opportunities in Well Testing Services Industry
- Growing adoption of digitalization and data analytics.
- Expanding applications in geothermal energy and carbon capture, utilization, and storage (CCUS).
- Increasing demand for well integrity management and extended well life solutions.
- Untapped potential in emerging economies with significant oil & gas reserves.
Growth Accelerators in the Well Testing Services Industry
Technological advancements in automated testing equipment, advanced data analytics capabilities, and remote operations will drive market expansion. Strategic partnerships between service providers and operators will foster innovation and accelerate adoption of new technologies. Expansion into emerging markets and diversification into related services such as well integrity management will further stimulate market growth.
Key Players Shaping the Well Testing Services Industry Market
- CETCO Energy Services
- SGS S A
- PW Well Test Ltd
- Weatherford International Plc
- Expro Group
- TETRA Technologies Inc
- Baker Hughes Company
- Halliburton Company
- Schlumberger Limited
- China Oilfield Secvices Limited
Notable Milestones in Well Testing Services Industry Sector
- 2020: Introduction of a new automated pressure testing system by Schlumberger, significantly reducing testing time.
- 2022: Halliburton acquired a smaller well testing company, expanding its service portfolio.
- 2023: Baker Hughes launched a new software platform for data analytics in well testing.
In-Depth Well Testing Services Industry Market Outlook
The Well Testing Services market is poised for continued growth, driven by technological innovation, expanding applications, and increased demand for well performance optimization. Strategic partnerships, investments in research and development, and expansion into emerging markets will be crucial for companies to capitalize on the market's future potential. The focus on digitalization and integration of data analytics will be key differentiators, leading to improved efficiency and cost-effectiveness for operators.
Well Testing Services Industry Segmentation
-
1. Stage
- 1.1. Exploration, Appraisal, & Development
- 1.2. Production
-
2. Location of Deployment
- 2.1. Onshore
- 2.2. Offshore
Well Testing Services Industry Segmentation By Geography
- 1. North America
- 2. Europe
- 3. Asia Pacific
- 4. South America
- 5. Middle East and Africa
Well Testing Services Industry REPORT HIGHLIGHTS
| Aspects | Details |
|---|---|
| Study Period | 2019-2033 |
| Base Year | 2024 |
| Estimated Year | 2025 |
| Forecast Period | 2025-2033 |
| Historical Period | 2019-2024 |
| Growth Rate | CAGR of > 2.00% from 2019-2033 |
| Segmentation |
|
Table of Contents
- 1. Introduction
- 1.1. Research Scope
- 1.2. Market Segmentation
- 1.3. Research Methodology
- 1.4. Definitions and Assumptions
- 2. Executive Summary
- 2.1. Introduction
- 3. Market Dynamics
- 3.1. Introduction
- 3.2. Market Drivers
- 3.2.1 4.; Increasing Exploration in Offshore Areas4.; The Strengthening of Crude Oil Prices
- 3.2.2 Making the Upstream Activities Economically Feasible
- 3.3. Market Restrains
- 3.3.1. 4.; Shifting to Renewable Energy Sources
- 3.4. Market Trends
- 3.4.1. Onshore Segment to Dominate the Market
- 4. Market Factor Analysis
- 4.1. Porters Five Forces
- 4.2. Supply/Value Chain
- 4.3. PESTEL analysis
- 4.4. Market Entropy
- 4.5. Patent/Trademark Analysis
- 5. Global Well Testing Services Industry Analysis, Insights and Forecast, 2019-2031
- 5.1. Market Analysis, Insights and Forecast - by Stage
- 5.1.1. Exploration, Appraisal, & Development
- 5.1.2. Production
- 5.2. Market Analysis, Insights and Forecast - by Location of Deployment
- 5.2.1. Onshore
- 5.2.2. Offshore
- 5.3. Market Analysis, Insights and Forecast - by Region
- 5.3.1. North America
- 5.3.2. Europe
- 5.3.3. Asia Pacific
- 5.3.4. South America
- 5.3.5. Middle East and Africa
- 5.1. Market Analysis, Insights and Forecast - by Stage
- 6. North America Well Testing Services Industry Analysis, Insights and Forecast, 2019-2031
- 6.1. Market Analysis, Insights and Forecast - by Stage
- 6.1.1. Exploration, Appraisal, & Development
- 6.1.2. Production
- 6.2. Market Analysis, Insights and Forecast - by Location of Deployment
- 6.2.1. Onshore
- 6.2.2. Offshore
- 6.1. Market Analysis, Insights and Forecast - by Stage
- 7. Europe Well Testing Services Industry Analysis, Insights and Forecast, 2019-2031
- 7.1. Market Analysis, Insights and Forecast - by Stage
- 7.1.1. Exploration, Appraisal, & Development
- 7.1.2. Production
- 7.2. Market Analysis, Insights and Forecast - by Location of Deployment
- 7.2.1. Onshore
- 7.2.2. Offshore
- 7.1. Market Analysis, Insights and Forecast - by Stage
- 8. Asia Pacific Well Testing Services Industry Analysis, Insights and Forecast, 2019-2031
- 8.1. Market Analysis, Insights and Forecast - by Stage
- 8.1.1. Exploration, Appraisal, & Development
- 8.1.2. Production
- 8.2. Market Analysis, Insights and Forecast - by Location of Deployment
- 8.2.1. Onshore
- 8.2.2. Offshore
- 8.1. Market Analysis, Insights and Forecast - by Stage
- 9. South America Well Testing Services Industry Analysis, Insights and Forecast, 2019-2031
- 9.1. Market Analysis, Insights and Forecast - by Stage
- 9.1.1. Exploration, Appraisal, & Development
- 9.1.2. Production
- 9.2. Market Analysis, Insights and Forecast - by Location of Deployment
- 9.2.1. Onshore
- 9.2.2. Offshore
- 9.1. Market Analysis, Insights and Forecast - by Stage
- 10. Middle East and Africa Well Testing Services Industry Analysis, Insights and Forecast, 2019-2031
- 10.1. Market Analysis, Insights and Forecast - by Stage
- 10.1.1. Exploration, Appraisal, & Development
- 10.1.2. Production
- 10.2. Market Analysis, Insights and Forecast - by Location of Deployment
- 10.2.1. Onshore
- 10.2.2. Offshore
- 10.1. Market Analysis, Insights and Forecast - by Stage
- 11. North America Well Testing Services Industry Analysis, Insights and Forecast, 2019-2031
- 11.1. Market Analysis, Insights and Forecast - By Country/Sub-region
- 11.1.1 United States
- 11.1.2 Canada
- 11.1.3 Mexico
- 12. Europe Well Testing Services Industry Analysis, Insights and Forecast, 2019-2031
- 12.1. Market Analysis, Insights and Forecast - By Country/Sub-region
- 12.1.1 Germany
- 12.1.2 United Kingdom
- 12.1.3 France
- 12.1.4 Spain
- 12.1.5 Italy
- 12.1.6 Spain
- 12.1.7 Belgium
- 12.1.8 Netherland
- 12.1.9 Nordics
- 12.1.10 Rest of Europe
- 13. Asia Pacific Well Testing Services Industry Analysis, Insights and Forecast, 2019-2031
- 13.1. Market Analysis, Insights and Forecast - By Country/Sub-region
- 13.1.1 China
- 13.1.2 Japan
- 13.1.3 India
- 13.1.4 South Korea
- 13.1.5 Southeast Asia
- 13.1.6 Australia
- 13.1.7 Indonesia
- 13.1.8 Phillipes
- 13.1.9 Singapore
- 13.1.10 Thailandc
- 13.1.11 Rest of Asia Pacific
- 14. South America Well Testing Services Industry Analysis, Insights and Forecast, 2019-2031
- 14.1. Market Analysis, Insights and Forecast - By Country/Sub-region
- 14.1.1 Brazil
- 14.1.2 Argentina
- 14.1.3 Peru
- 14.1.4 Chile
- 14.1.5 Colombia
- 14.1.6 Ecuador
- 14.1.7 Venezuela
- 14.1.8 Rest of South America
- 15. MEA Well Testing Services Industry Analysis, Insights and Forecast, 2019-2031
- 15.1. Market Analysis, Insights and Forecast - By Country/Sub-region
- 15.1.1 United Arab Emirates
- 15.1.2 Saudi Arabia
- 15.1.3 South Africa
- 15.1.4 Rest of Middle East and Africa
- 16. Competitive Analysis
- 16.1. Global Market Share Analysis 2024
- 16.2. Company Profiles
- 16.2.1 CETCO Energy Services
- 16.2.1.1. Overview
- 16.2.1.2. Products
- 16.2.1.3. SWOT Analysis
- 16.2.1.4. Recent Developments
- 16.2.1.5. Financials (Based on Availability)
- 16.2.2 SGS S A
- 16.2.2.1. Overview
- 16.2.2.2. Products
- 16.2.2.3. SWOT Analysis
- 16.2.2.4. Recent Developments
- 16.2.2.5. Financials (Based on Availability)
- 16.2.3 PW Well Test Ltd
- 16.2.3.1. Overview
- 16.2.3.2. Products
- 16.2.3.3. SWOT Analysis
- 16.2.3.4. Recent Developments
- 16.2.3.5. Financials (Based on Availability)
- 16.2.4 Weatherford International Plc
- 16.2.4.1. Overview
- 16.2.4.2. Products
- 16.2.4.3. SWOT Analysis
- 16.2.4.4. Recent Developments
- 16.2.4.5. Financials (Based on Availability)
- 16.2.5 Expro Group
- 16.2.5.1. Overview
- 16.2.5.2. Products
- 16.2.5.3. SWOT Analysis
- 16.2.5.4. Recent Developments
- 16.2.5.5. Financials (Based on Availability)
- 16.2.6 TETRA Technologies Inc
- 16.2.6.1. Overview
- 16.2.6.2. Products
- 16.2.6.3. SWOT Analysis
- 16.2.6.4. Recent Developments
- 16.2.6.5. Financials (Based on Availability)
- 16.2.7 Baker Hughes Company
- 16.2.7.1. Overview
- 16.2.7.2. Products
- 16.2.7.3. SWOT Analysis
- 16.2.7.4. Recent Developments
- 16.2.7.5. Financials (Based on Availability)
- 16.2.8 Halliburton Company
- 16.2.8.1. Overview
- 16.2.8.2. Products
- 16.2.8.3. SWOT Analysis
- 16.2.8.4. Recent Developments
- 16.2.8.5. Financials (Based on Availability)
- 16.2.9 Schlumberger Limited
- 16.2.9.1. Overview
- 16.2.9.2. Products
- 16.2.9.3. SWOT Analysis
- 16.2.9.4. Recent Developments
- 16.2.9.5. Financials (Based on Availability)
- 16.2.10 China Oilfield Secvices Limited
- 16.2.10.1. Overview
- 16.2.10.2. Products
- 16.2.10.3. SWOT Analysis
- 16.2.10.4. Recent Developments
- 16.2.10.5. Financials (Based on Availability)
- 16.2.1 CETCO Energy Services
List of Figures
- Figure 1: Global Well Testing Services Industry Revenue Breakdown (Million, %) by Region 2024 & 2032
- Figure 2: North America Well Testing Services Industry Revenue (Million), by Country 2024 & 2032
- Figure 3: North America Well Testing Services Industry Revenue Share (%), by Country 2024 & 2032
- Figure 4: Europe Well Testing Services Industry Revenue (Million), by Country 2024 & 2032
- Figure 5: Europe Well Testing Services Industry Revenue Share (%), by Country 2024 & 2032
- Figure 6: Asia Pacific Well Testing Services Industry Revenue (Million), by Country 2024 & 2032
- Figure 7: Asia Pacific Well Testing Services Industry Revenue Share (%), by Country 2024 & 2032
- Figure 8: South America Well Testing Services Industry Revenue (Million), by Country 2024 & 2032
- Figure 9: South America Well Testing Services Industry Revenue Share (%), by Country 2024 & 2032
- Figure 10: MEA Well Testing Services Industry Revenue (Million), by Country 2024 & 2032
- Figure 11: MEA Well Testing Services Industry Revenue Share (%), by Country 2024 & 2032
- Figure 12: North America Well Testing Services Industry Revenue (Million), by Stage 2024 & 2032
- Figure 13: North America Well Testing Services Industry Revenue Share (%), by Stage 2024 & 2032
- Figure 14: North America Well Testing Services Industry Revenue (Million), by Location of Deployment 2024 & 2032
- Figure 15: North America Well Testing Services Industry Revenue Share (%), by Location of Deployment 2024 & 2032
- Figure 16: North America Well Testing Services Industry Revenue (Million), by Country 2024 & 2032
- Figure 17: North America Well Testing Services Industry Revenue Share (%), by Country 2024 & 2032
- Figure 18: Europe Well Testing Services Industry Revenue (Million), by Stage 2024 & 2032
- Figure 19: Europe Well Testing Services Industry Revenue Share (%), by Stage 2024 & 2032
- Figure 20: Europe Well Testing Services Industry Revenue (Million), by Location of Deployment 2024 & 2032
- Figure 21: Europe Well Testing Services Industry Revenue Share (%), by Location of Deployment 2024 & 2032
- Figure 22: Europe Well Testing Services Industry Revenue (Million), by Country 2024 & 2032
- Figure 23: Europe Well Testing Services Industry Revenue Share (%), by Country 2024 & 2032
- Figure 24: Asia Pacific Well Testing Services Industry Revenue (Million), by Stage 2024 & 2032
- Figure 25: Asia Pacific Well Testing Services Industry Revenue Share (%), by Stage 2024 & 2032
- Figure 26: Asia Pacific Well Testing Services Industry Revenue (Million), by Location of Deployment 2024 & 2032
- Figure 27: Asia Pacific Well Testing Services Industry Revenue Share (%), by Location of Deployment 2024 & 2032
- Figure 28: Asia Pacific Well Testing Services Industry Revenue (Million), by Country 2024 & 2032
- Figure 29: Asia Pacific Well Testing Services Industry Revenue Share (%), by Country 2024 & 2032
- Figure 30: South America Well Testing Services Industry Revenue (Million), by Stage 2024 & 2032
- Figure 31: South America Well Testing Services Industry Revenue Share (%), by Stage 2024 & 2032
- Figure 32: South America Well Testing Services Industry Revenue (Million), by Location of Deployment 2024 & 2032
- Figure 33: South America Well Testing Services Industry Revenue Share (%), by Location of Deployment 2024 & 2032
- Figure 34: South America Well Testing Services Industry Revenue (Million), by Country 2024 & 2032
- Figure 35: South America Well Testing Services Industry Revenue Share (%), by Country 2024 & 2032
- Figure 36: Middle East and Africa Well Testing Services Industry Revenue (Million), by Stage 2024 & 2032
- Figure 37: Middle East and Africa Well Testing Services Industry Revenue Share (%), by Stage 2024 & 2032
- Figure 38: Middle East and Africa Well Testing Services Industry Revenue (Million), by Location of Deployment 2024 & 2032
- Figure 39: Middle East and Africa Well Testing Services Industry Revenue Share (%), by Location of Deployment 2024 & 2032
- Figure 40: Middle East and Africa Well Testing Services Industry Revenue (Million), by Country 2024 & 2032
- Figure 41: Middle East and Africa Well Testing Services Industry Revenue Share (%), by Country 2024 & 2032
List of Tables
- Table 1: Global Well Testing Services Industry Revenue Million Forecast, by Region 2019 & 2032
- Table 2: Global Well Testing Services Industry Revenue Million Forecast, by Stage 2019 & 2032
- Table 3: Global Well Testing Services Industry Revenue Million Forecast, by Location of Deployment 2019 & 2032
- Table 4: Global Well Testing Services Industry Revenue Million Forecast, by Region 2019 & 2032
- Table 5: Global Well Testing Services Industry Revenue Million Forecast, by Country 2019 & 2032
- Table 6: United States Well Testing Services Industry Revenue (Million) Forecast, by Application 2019 & 2032
- Table 7: Canada Well Testing Services Industry Revenue (Million) Forecast, by Application 2019 & 2032
- Table 8: Mexico Well Testing Services Industry Revenue (Million) Forecast, by Application 2019 & 2032
- Table 9: Global Well Testing Services Industry Revenue Million Forecast, by Country 2019 & 2032
- Table 10: Germany Well Testing Services Industry Revenue (Million) Forecast, by Application 2019 & 2032
- Table 11: United Kingdom Well Testing Services Industry Revenue (Million) Forecast, by Application 2019 & 2032
- Table 12: France Well Testing Services Industry Revenue (Million) Forecast, by Application 2019 & 2032
- Table 13: Spain Well Testing Services Industry Revenue (Million) Forecast, by Application 2019 & 2032
- Table 14: Italy Well Testing Services Industry Revenue (Million) Forecast, by Application 2019 & 2032
- Table 15: Spain Well Testing Services Industry Revenue (Million) Forecast, by Application 2019 & 2032
- Table 16: Belgium Well Testing Services Industry Revenue (Million) Forecast, by Application 2019 & 2032
- Table 17: Netherland Well Testing Services Industry Revenue (Million) Forecast, by Application 2019 & 2032
- Table 18: Nordics Well Testing Services Industry Revenue (Million) Forecast, by Application 2019 & 2032
- Table 19: Rest of Europe Well Testing Services Industry Revenue (Million) Forecast, by Application 2019 & 2032
- Table 20: Global Well Testing Services Industry Revenue Million Forecast, by Country 2019 & 2032
- Table 21: China Well Testing Services Industry Revenue (Million) Forecast, by Application 2019 & 2032
- Table 22: Japan Well Testing Services Industry Revenue (Million) Forecast, by Application 2019 & 2032
- Table 23: India Well Testing Services Industry Revenue (Million) Forecast, by Application 2019 & 2032
- Table 24: South Korea Well Testing Services Industry Revenue (Million) Forecast, by Application 2019 & 2032
- Table 25: Southeast Asia Well Testing Services Industry Revenue (Million) Forecast, by Application 2019 & 2032
- Table 26: Australia Well Testing Services Industry Revenue (Million) Forecast, by Application 2019 & 2032
- Table 27: Indonesia Well Testing Services Industry Revenue (Million) Forecast, by Application 2019 & 2032
- Table 28: Phillipes Well Testing Services Industry Revenue (Million) Forecast, by Application 2019 & 2032
- Table 29: Singapore Well Testing Services Industry Revenue (Million) Forecast, by Application 2019 & 2032
- Table 30: Thailandc Well Testing Services Industry Revenue (Million) Forecast, by Application 2019 & 2032
- Table 31: Rest of Asia Pacific Well Testing Services Industry Revenue (Million) Forecast, by Application 2019 & 2032
- Table 32: Global Well Testing Services Industry Revenue Million Forecast, by Country 2019 & 2032
- Table 33: Brazil Well Testing Services Industry Revenue (Million) Forecast, by Application 2019 & 2032
- Table 34: Argentina Well Testing Services Industry Revenue (Million) Forecast, by Application 2019 & 2032
- Table 35: Peru Well Testing Services Industry Revenue (Million) Forecast, by Application 2019 & 2032
- Table 36: Chile Well Testing Services Industry Revenue (Million) Forecast, by Application 2019 & 2032
- Table 37: Colombia Well Testing Services Industry Revenue (Million) Forecast, by Application 2019 & 2032
- Table 38: Ecuador Well Testing Services Industry Revenue (Million) Forecast, by Application 2019 & 2032
- Table 39: Venezuela Well Testing Services Industry Revenue (Million) Forecast, by Application 2019 & 2032
- Table 40: Rest of South America Well Testing Services Industry Revenue (Million) Forecast, by Application 2019 & 2032
- Table 41: Global Well Testing Services Industry Revenue Million Forecast, by Country 2019 & 2032
- Table 42: United Arab Emirates Well Testing Services Industry Revenue (Million) Forecast, by Application 2019 & 2032
- Table 43: Saudi Arabia Well Testing Services Industry Revenue (Million) Forecast, by Application 2019 & 2032
- Table 44: South Africa Well Testing Services Industry Revenue (Million) Forecast, by Application 2019 & 2032
- Table 45: Rest of Middle East and Africa Well Testing Services Industry Revenue (Million) Forecast, by Application 2019 & 2032
- Table 46: Global Well Testing Services Industry Revenue Million Forecast, by Stage 2019 & 2032
- Table 47: Global Well Testing Services Industry Revenue Million Forecast, by Location of Deployment 2019 & 2032
- Table 48: Global Well Testing Services Industry Revenue Million Forecast, by Country 2019 & 2032
- Table 49: Global Well Testing Services Industry Revenue Million Forecast, by Stage 2019 & 2032
- Table 50: Global Well Testing Services Industry Revenue Million Forecast, by Location of Deployment 2019 & 2032
- Table 51: Global Well Testing Services Industry Revenue Million Forecast, by Country 2019 & 2032
- Table 52: Global Well Testing Services Industry Revenue Million Forecast, by Stage 2019 & 2032
- Table 53: Global Well Testing Services Industry Revenue Million Forecast, by Location of Deployment 2019 & 2032
- Table 54: Global Well Testing Services Industry Revenue Million Forecast, by Country 2019 & 2032
- Table 55: Global Well Testing Services Industry Revenue Million Forecast, by Stage 2019 & 2032
- Table 56: Global Well Testing Services Industry Revenue Million Forecast, by Location of Deployment 2019 & 2032
- Table 57: Global Well Testing Services Industry Revenue Million Forecast, by Country 2019 & 2032
- Table 58: Global Well Testing Services Industry Revenue Million Forecast, by Stage 2019 & 2032
- Table 59: Global Well Testing Services Industry Revenue Million Forecast, by Location of Deployment 2019 & 2032
- Table 60: Global Well Testing Services Industry Revenue Million Forecast, by Country 2019 & 2032
Frequently Asked Questions
1. What is the projected Compound Annual Growth Rate (CAGR) of the Well Testing Services Industry?
The projected CAGR is approximately > 2.00%.
2. Which companies are prominent players in the Well Testing Services Industry?
Key companies in the market include CETCO Energy Services, SGS S A, PW Well Test Ltd, Weatherford International Plc, Expro Group, TETRA Technologies Inc, Baker Hughes Company, Halliburton Company, Schlumberger Limited, China Oilfield Secvices Limited.
3. What are the main segments of the Well Testing Services Industry?
The market segments include Stage, Location of Deployment.
4. Can you provide details about the market size?
The market size is estimated to be USD XX Million as of 2022.
5. What are some drivers contributing to market growth?
4.; Increasing Exploration in Offshore Areas4.; The Strengthening of Crude Oil Prices. Making the Upstream Activities Economically Feasible.
6. What are the notable trends driving market growth?
Onshore Segment to Dominate the Market.
7. Are there any restraints impacting market growth?
4.; Shifting to Renewable Energy Sources.
8. Can you provide examples of recent developments in the market?
N/A
9. What pricing options are available for accessing the report?
Pricing options include single-user, multi-user, and enterprise licenses priced at USD 4750, USD 5250, and USD 8750 respectively.
10. Is the market size provided in terms of value or volume?
The market size is provided in terms of value, measured in Million.
11. Are there any specific market keywords associated with the report?
Yes, the market keyword associated with the report is "Well Testing Services Industry," which aids in identifying and referencing the specific market segment covered.
12. How do I determine which pricing option suits my needs best?
The pricing options vary based on user requirements and access needs. Individual users may opt for single-user licenses, while businesses requiring broader access may choose multi-user or enterprise licenses for cost-effective access to the report.
13. Are there any additional resources or data provided in the Well Testing Services Industry report?
While the report offers comprehensive insights, it's advisable to review the specific contents or supplementary materials provided to ascertain if additional resources or data are available.
14. How can I stay updated on further developments or reports in the Well Testing Services Industry?
To stay informed about further developments, trends, and reports in the Well Testing Services Industry, consider subscribing to industry newsletters, following relevant companies and organizations, or regularly checking reputable industry news sources and publications.
Methodology
Step 1 - Identification of Relevant Samples Size from Population Database


Step 2 - Approaches for Defining Global Market Size (Value, Volume* & Price*)

Note*: In applicable scenarios
Step 3 - Data Sources
Primary Research
- Web Analytics
- Survey Reports
- Research Institute
- Latest Research Reports
- Opinion Leaders
Secondary Research
- Annual Reports
- White Paper
- Latest Press Release
- Industry Association
- Paid Database
- Investor Presentations

Step 4 - Data Triangulation
Involves using different sources of information in order to increase the validity of a study
These sources are likely to be stakeholders in a program - participants, other researchers, program staff, other community members, and so on.
Then we put all data in single framework & apply various statistical tools to find out the dynamic on the market.
During the analysis stage, feedback from the stakeholder groups would be compared to determine areas of agreement as well as areas of divergence
