

Key Insights
The global zinc sulfate market, valued at approximately $2 billion in 2025, is projected to experience robust growth, exhibiting a compound annual growth rate (CAGR) of 5.5% from 2025 to 2033. Key growth drivers include escalating demand in the agricultural sector for micronutrient fertilizers, significant utilization in chemical and petrochemical industries for intermediate production, and increasing use in pharmaceutical formulations and supplements. Expanding applications in paints and coatings for enhanced performance and durability further propel market expansion. However, potential restraints include raw material price volatility and stringent environmental regulations. The market is segmented by product type (including zinc oxide, zinc sulfate, zinc carbonate, and zinc chloride) and end-user industry (agriculture, chemicals & petrochemicals, ceramics, pharmaceuticals, paints & coatings, rubber processing, and others). Asia-Pacific and North America are anticipated to lead geographic growth, driven by strong industrial activity and agricultural sectors.
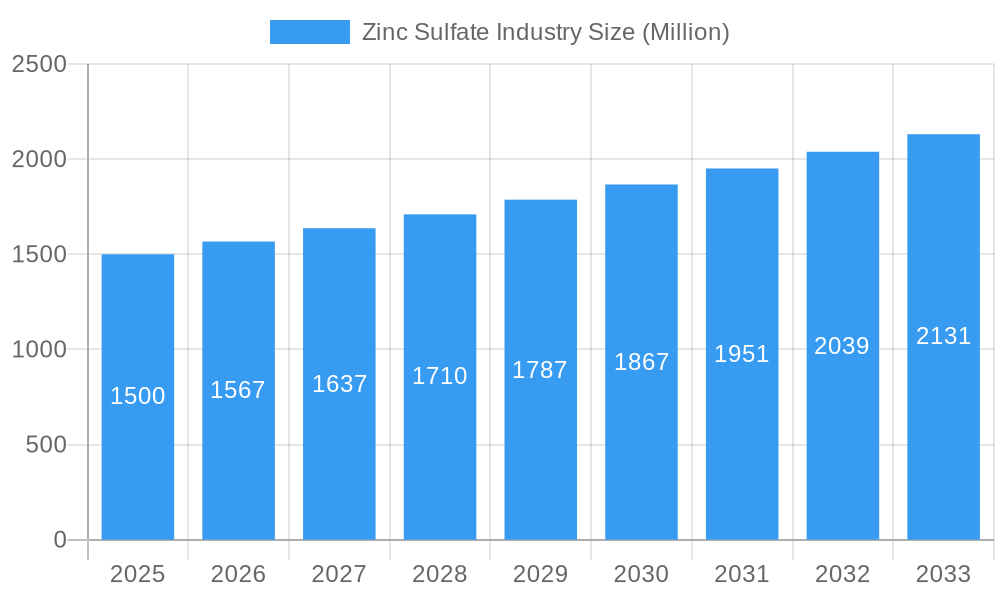
Zinc Sulfate Industry Market Size (In Billion)
The competitive landscape features established global producers such as Zochem LLC, U.S. Zinc, and Nexa, alongside agile regional players. These companies leverage production scale and distribution networks, while smaller entities compete on localized demand and cost efficiencies. Future market expansion will be influenced by technological innovations in production for greater efficiency and reduced environmental impact. Strategic collaborations, mergers, and acquisitions are expected to consolidate market share and reshape the competitive environment. Global economic trends and raw material price dynamics will also impact the market's trajectory, with a growing emphasis on sustainable and eco-friendly production methods for long-term success.
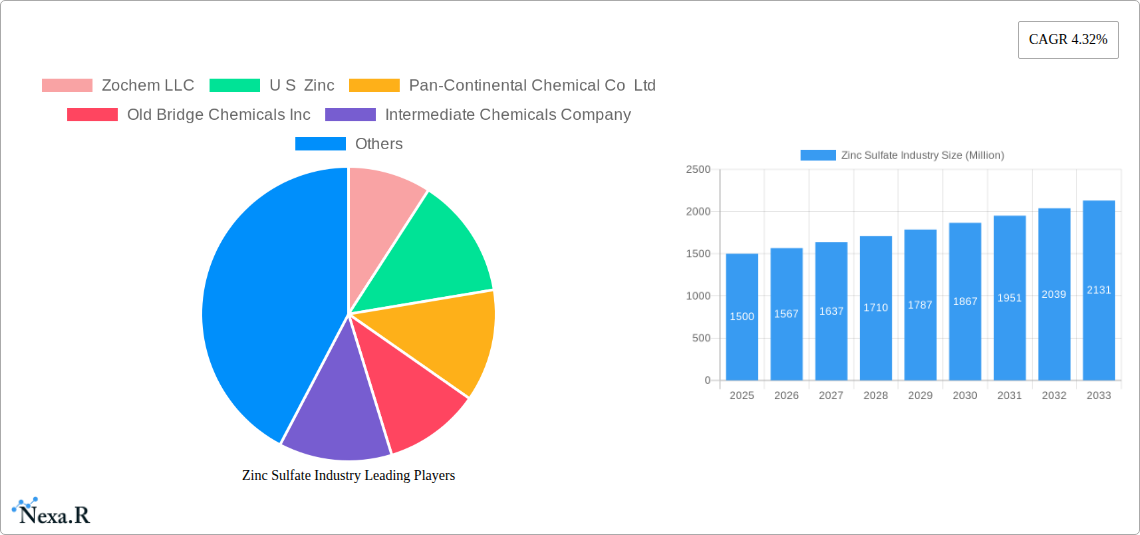
Zinc Sulfate Industry Company Market Share
Zinc Sulfate Industry Market Report: 2019-2033 Forecast
This comprehensive report provides an in-depth analysis of the Zinc Sulfate industry, offering invaluable insights for industry professionals, investors, and strategic planners. Covering the period from 2019 to 2033, with a base year of 2025, this report meticulously examines market dynamics, growth trends, regional dominance, product landscapes, and key players shaping the future of this vital sector. The parent market encompasses the broader Zinc Chemicals industry, while the child market focuses specifically on Zinc Sulfate and its diverse applications. Market values are presented in million units.
Zinc Sulfate Industry Market Dynamics & Structure
This section analyzes the competitive landscape of the Zinc Sulfate market, considering factors such as market concentration, technological advancements, regulatory influences, and substitution effects. We explore the impact of mergers and acquisitions (M&A) activities, examining their influence on market share and competitive dynamics. The analysis incorporates both quantitative data (market share percentages, M&A deal volumes) and qualitative assessments (innovation barriers, regulatory hurdles).
- Market Concentration: The Zinc Sulfate market exhibits a [xx]% concentration ratio, with the top 5 players holding approximately [xx]% market share in 2024.
- Technological Innovation: Ongoing R&D focuses on enhancing production efficiency and developing new applications in agriculture and pharmaceuticals. However, high initial investment costs present a barrier to entry for smaller players.
- Regulatory Framework: Stringent environmental regulations regarding zinc waste disposal are shaping industry practices, influencing production costs and sustainability initiatives.
- Competitive Substitutes: Products such as other zinc salts (oxide, carbonate, chloride) and alternative fertilizers compete with zinc sulfate, impacting market share.
- End-User Demographics: The agricultural sector remains the dominant end-user, followed by the chemicals and petrochemicals industry. Shifting agricultural practices and growing demand for fertilizers drive market growth.
- M&A Trends: The past five years have witnessed [xx] significant M&A deals within the Zinc Sulfate market, primarily driven by consolidation and expansion into new geographic regions. These deals have resulted in a [xx]% increase in market concentration.
Zinc Sulfate Industry Growth Trends & Insights
This section leverages extensive data analysis to provide a comprehensive overview of Zinc Sulfate market evolution. It delves into market size fluctuations, adoption rate analysis, disruptive technologies, and evolving consumer behaviors across key end-user segments. We provide detailed insights into market growth drivers and potential challenges, incorporating CAGR and market penetration metrics.
The global Zinc Sulfate market is expected to exhibit a CAGR of [xx]% during the forecast period (2025-2033), reaching a projected value of [xx] million units by 2033. This growth is driven by increasing demand from the agricultural sector, particularly in developing economies. Technological advancements in production processes are also contributing to increased efficiency and lower costs, thus fueling market expansion. Consumer preference for sustainable agricultural practices and the growing awareness of the importance of micronutrients in crop production further accelerate market growth. However, price fluctuations in raw materials and fluctuating energy costs pose challenges to market stability. Market penetration in untapped regions, such as [mention specific regions], presents significant opportunities for growth.
Dominant Regions, Countries, or Segments in Zinc Sulfate Industry
This section identifies the leading geographical regions and segments (by type and end-user industry) driving Zinc Sulfate market growth. We explore the key factors contributing to their dominance, encompassing economic policies, infrastructure development, and market share dynamics. The analysis also assesses the growth potential of each segment and region.
- Dominant Region: [Region Name], accounting for [xx]% of the global market share in 2024, holds the leading position due to robust agricultural activities and favorable government policies supporting fertilizer consumption.
- Leading Segment (Type): Zinc Sulfate accounts for the largest segment share ([xx]%), followed by Zinc Oxide ([xx]%) and Zinc Carbonate ([xx]% ).
- Leading Segment (End-User Industry): Agriculture dominates the end-user landscape, capturing [xx]% of the total market demand, driven by the increasing demand for high-yield crops and the vital role of zinc in plant nutrition. The Chemicals and Petrochemicals segment shows significant growth potential.
- Key Drivers: Government initiatives promoting sustainable agriculture, rising disposable incomes in emerging markets, and increasing awareness of micronutrient deficiencies in crops fuel Zinc Sulfate market growth.
Zinc Sulfate Industry Product Landscape
The Zinc Sulfate market offers a range of products with varying purity levels and particle sizes to cater to diverse applications. Recent innovations focus on developing high-purity zinc sulfate for specialized applications in pharmaceuticals and high-performance coatings. These innovations aim at enhanced solubility, improved bio-availability, and reduced environmental impact. Unique selling propositions (USPs) include superior quality, enhanced efficacy, and tailored formulations to meet specific end-user needs.
Key Drivers, Barriers & Challenges in Zinc Sulfate Industry
Key Drivers:
- Increasing demand for high-yield crops in the agricultural sector.
- Growing adoption of zinc-based fertilizers in developing countries.
- Expanding applications of zinc sulfate in the chemicals and pharmaceutical industries.
- Technological advancements improving production efficiency and reducing costs.
Challenges and Restraints:
- Fluctuations in raw material prices (zinc metal, sulfuric acid).
- Stringent environmental regulations governing zinc waste disposal.
- Intense competition from alternative fertilizers and zinc-based products.
- Supply chain disruptions impacting production and distribution. These disruptions, experienced in [Year], led to a [xx]% increase in Zinc Sulfate prices.
Emerging Opportunities in Zinc Sulfate Industry
- Untapped markets in developing economies present substantial growth potential.
- Innovative applications in specialized fertilizers and high-performance coatings are emerging.
- The growing demand for sustainable and eco-friendly agricultural practices offers opportunities for specialized zinc sulfate formulations.
Growth Accelerators in the Zinc Sulfate Industry
Technological breakthroughs in production processes, strategic partnerships to secure raw material supplies, and aggressive market expansion strategies into emerging economies are key catalysts driving long-term growth in the Zinc Sulfate industry. Investing in R&D to develop advanced formulations for niche applications further accelerates market expansion.
Key Players Shaping the Zinc Sulfate Industry Market
- Zochem LLC
- U S Zinc
- Pan-Continental Chemical Co Ltd
- Old Bridge Chemicals Inc
- Intermediate Chemicals Company
- Nexa
- EverZinc
- Rech Chemical Co Ltd
- L Brüggemann GmbH & Co KG
- Rubamin
- Changsha Lantian Chemical Co Ltd
- Weifang Longda Zinc Industry Co Ltd
- Flaurea Chemicals
- Silox India Pvt Ltd
- Seyang Zinc Technology (Huai An) Co Ltd
- TIB Chemicals AG
- Global Chemical Co Ltd
- Hakusui Tech
- American Chemet Corporation
Notable Milestones in Zinc Sulfate Industry Sector
- [Month, Year]: [Company Name] launched a new high-purity zinc sulfate formulation for pharmaceutical applications.
- [Month, Year]: [Company Name] and [Company Name] announced a strategic partnership to expand their global distribution network.
- [Month, Year]: New environmental regulations were implemented in [Region], impacting production costs for Zinc Sulfate manufacturers. (Further milestones will be detailed in the complete report.)
In-Depth Zinc Sulfate Industry Market Outlook
The Zinc Sulfate market is poised for significant growth driven by increasing agricultural demand and expanding applications across diverse sectors. Strategic partnerships, technological advancements, and expansion into emerging markets will further fuel this growth. The market outlook remains positive, with considerable potential for innovative product development and market penetration in untapped regions. The forecast suggests a continued upward trajectory, indicating attractive opportunities for investment and strategic growth for stakeholders in the coming years.
Zinc Sulfate Industry Segmentation
-
1. Type
- 1.1. Zinc Oxide
- 1.2. Zinc Sulfate
- 1.3. Zinc Carbonate
- 1.4. Zinc Chloride
- 1.5. Other Types
-
2. End-user Industry
- 2.1. Agriculture
- 2.2. Chemicals and Petrochemicals
- 2.3. Ceramic
- 2.4. Pharmaceutical
- 2.5. Paints and Coatings
- 2.6. Rubber Processing
- 2.7. Other End-user Industries
Zinc Sulfate Industry Segmentation By Geography
-
1. Asia Pacific
- 1.1. China
- 1.2. India
- 1.3. Japan
- 1.4. South Korea
- 1.5. Malaysia
- 1.6. Thailand
- 1.7. Indonesia
- 1.8. Vietnam
- 1.9. Rest of Asia Pacific
-
2. North America
- 2.1. United States
- 2.2. Canada
- 2.3. Mexico
-
3. Europe
- 3.1. Germany
- 3.2. United Kingdom
- 3.3. France
- 3.4. Italy
- 3.5. Spain
- 3.6. Turkey
- 3.7. Russia
- 3.8. NORDIC Countries
- 3.9. Rest of Europe
-
4. South America
- 4.1. Brazil
- 4.2. Argentina
- 4.3. Colombia
- 4.4. Rest of South America
-
5. Middle East and Africa
- 5.1. Saudi Arabia
- 5.2. Nigeria
- 5.3. Qatar
- 5.4. Egypt
- 5.5. United Arab Emirates
- 5.6. South Africa
- 5.7. Rest of Middle East and Africa
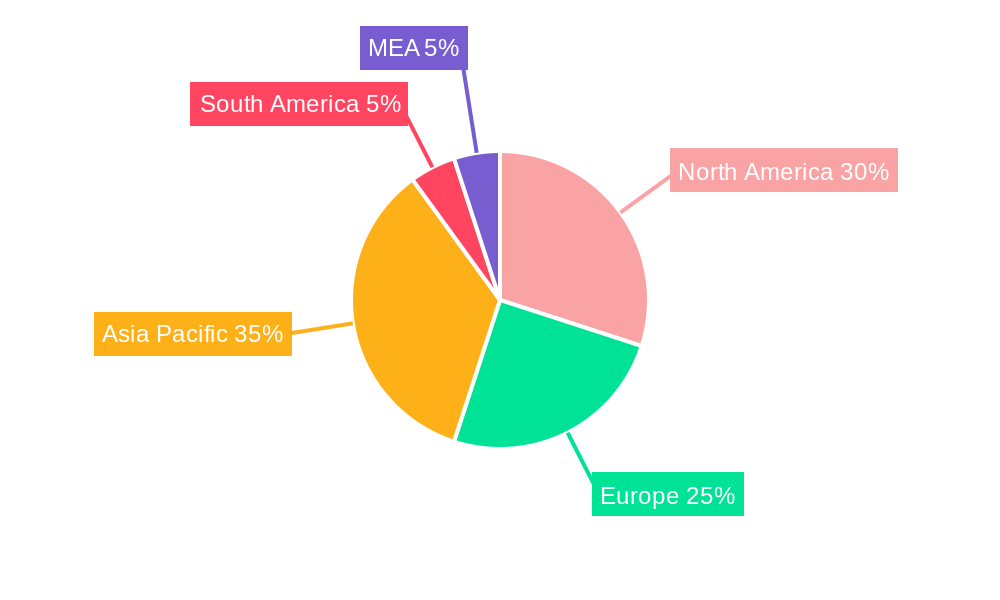
Zinc Sulfate Industry Regional Market Share
Geographic Coverage of Zinc Sulfate Industry
Zinc Sulfate Industry REPORT HIGHLIGHTS
| Aspects | Details |
|---|---|
| Study Period | 2020-2034 |
| Base Year | 2025 |
| Estimated Year | 2026 |
| Forecast Period | 2026-2034 |
| Historical Period | 2020-2025 |
| Growth Rate | CAGR of 5.5% from 2020-2034 |
| Segmentation |
|
Table of Contents
- 1. Introduction
- 1.1. Research Scope
- 1.2. Market Segmentation
- 1.3. Research Objective
- 1.4. Definitions and Assumptions
- 2. Executive Summary
- 2.1. Market Snapshot
- 3. Market Dynamics
- 3.1. Market Drivers
- 3.2. Market Restrains
- 3.3. Market Trends
- 3.4. Market Opportunities
- 4. Market Factor Analysis
- 4.1. Porters Five Forces
- 4.1.1. Bargaining Power of Suppliers
- 4.1.2. Bargaining Power of Buyers
- 4.1.3. Threat of New Entrants
- 4.1.4. Threat of Substitutes
- 4.1.5. Competitive Rivalry
- 4.2. PESTEL analysis
- 4.3. BCG Analysis
- 4.3.1. Stars (High Growth, High Market Share)
- 4.3.2. Cash Cows (Low Growth, High Market Share)
- 4.3.3. Question Mark (High Growth, Low Market Share)
- 4.3.4. Dogs (Low Growth, Low Market Share)
- 4.4. Ansoff Matrix Analysis
- 4.5. Supply Chain Analysis
- 4.6. Regulatory Landscape
- 4.7. Current Market Potential and Opportunity Assessment (TAM–SAM–SOM Framework)
- 4.8. NRP Analyst Note
- 4.1. Porters Five Forces
- 5. Market Analysis, Insights and Forecast 2021-2033
- 5.1. Market Analysis, Insights and Forecast - by Type
- 5.1.1. Zinc Oxide
- 5.1.2. Zinc Sulfate
- 5.1.3. Zinc Carbonate
- 5.1.4. Zinc Chloride
- 5.1.5. Other Types
- 5.2. Market Analysis, Insights and Forecast - by End-user Industry
- 5.2.1. Agriculture
- 5.2.2. Chemicals and Petrochemicals
- 5.2.3. Ceramic
- 5.2.4. Pharmaceutical
- 5.2.5. Paints and Coatings
- 5.2.6. Rubber Processing
- 5.2.7. Other End-user Industries
- 5.3. Market Analysis, Insights and Forecast - by Region
- 5.3.1. Asia Pacific
- 5.3.2. North America
- 5.3.3. Europe
- 5.3.4. South America
- 5.3.5. Middle East and Africa
- 5.1. Market Analysis, Insights and Forecast - by Type
- 6. Global Zinc Sulfate Industry Analysis, Insights and Forecast, 2021-2033
- 6.1. Market Analysis, Insights and Forecast - by Type
- 6.1.1. Zinc Oxide
- 6.1.2. Zinc Sulfate
- 6.1.3. Zinc Carbonate
- 6.1.4. Zinc Chloride
- 6.1.5. Other Types
- 6.2. Market Analysis, Insights and Forecast - by End-user Industry
- 6.2.1. Agriculture
- 6.2.2. Chemicals and Petrochemicals
- 6.2.3. Ceramic
- 6.2.4. Pharmaceutical
- 6.2.5. Paints and Coatings
- 6.2.6. Rubber Processing
- 6.2.7. Other End-user Industries
- 6.1. Market Analysis, Insights and Forecast - by Type
- 7. Asia Pacific Zinc Sulfate Industry Analysis, Insights and Forecast, 2020-2032
- 7.1. Market Analysis, Insights and Forecast - by Type
- 7.1.1. Zinc Oxide
- 7.1.2. Zinc Sulfate
- 7.1.3. Zinc Carbonate
- 7.1.4. Zinc Chloride
- 7.1.5. Other Types
- 7.2. Market Analysis, Insights and Forecast - by End-user Industry
- 7.2.1. Agriculture
- 7.2.2. Chemicals and Petrochemicals
- 7.2.3. Ceramic
- 7.2.4. Pharmaceutical
- 7.2.5. Paints and Coatings
- 7.2.6. Rubber Processing
- 7.2.7. Other End-user Industries
- 7.1. Market Analysis, Insights and Forecast - by Type
- 8. North America Zinc Sulfate Industry Analysis, Insights and Forecast, 2020-2032
- 8.1. Market Analysis, Insights and Forecast - by Type
- 8.1.1. Zinc Oxide
- 8.1.2. Zinc Sulfate
- 8.1.3. Zinc Carbonate
- 8.1.4. Zinc Chloride
- 8.1.5. Other Types
- 8.2. Market Analysis, Insights and Forecast - by End-user Industry
- 8.2.1. Agriculture
- 8.2.2. Chemicals and Petrochemicals
- 8.2.3. Ceramic
- 8.2.4. Pharmaceutical
- 8.2.5. Paints and Coatings
- 8.2.6. Rubber Processing
- 8.2.7. Other End-user Industries
- 8.1. Market Analysis, Insights and Forecast - by Type
- 9. Europe Zinc Sulfate Industry Analysis, Insights and Forecast, 2020-2032
- 9.1. Market Analysis, Insights and Forecast - by Type
- 9.1.1. Zinc Oxide
- 9.1.2. Zinc Sulfate
- 9.1.3. Zinc Carbonate
- 9.1.4. Zinc Chloride
- 9.1.5. Other Types
- 9.2. Market Analysis, Insights and Forecast - by End-user Industry
- 9.2.1. Agriculture
- 9.2.2. Chemicals and Petrochemicals
- 9.2.3. Ceramic
- 9.2.4. Pharmaceutical
- 9.2.5. Paints and Coatings
- 9.2.6. Rubber Processing
- 9.2.7. Other End-user Industries
- 9.1. Market Analysis, Insights and Forecast - by Type
- 10. South America Zinc Sulfate Industry Analysis, Insights and Forecast, 2020-2032
- 10.1. Market Analysis, Insights and Forecast - by Type
- 10.1.1. Zinc Oxide
- 10.1.2. Zinc Sulfate
- 10.1.3. Zinc Carbonate
- 10.1.4. Zinc Chloride
- 10.1.5. Other Types
- 10.2. Market Analysis, Insights and Forecast - by End-user Industry
- 10.2.1. Agriculture
- 10.2.2. Chemicals and Petrochemicals
- 10.2.3. Ceramic
- 10.2.4. Pharmaceutical
- 10.2.5. Paints and Coatings
- 10.2.6. Rubber Processing
- 10.2.7. Other End-user Industries
- 10.1. Market Analysis, Insights and Forecast - by Type
- 11. Middle East and Africa Zinc Sulfate Industry Analysis, Insights and Forecast, 2020-2032
- 11.1. Market Analysis, Insights and Forecast - by Type
- 11.1.1. Zinc Oxide
- 11.1.2. Zinc Sulfate
- 11.1.3. Zinc Carbonate
- 11.1.4. Zinc Chloride
- 11.1.5. Other Types
- 11.2. Market Analysis, Insights and Forecast - by End-user Industry
- 11.2.1. Agriculture
- 11.2.2. Chemicals and Petrochemicals
- 11.2.3. Ceramic
- 11.2.4. Pharmaceutical
- 11.2.5. Paints and Coatings
- 11.2.6. Rubber Processing
- 11.2.7. Other End-user Industries
- 11.1. Market Analysis, Insights and Forecast - by Type
- 12. Competitive Analysis
- 12.1. Company Profiles
- 12.1.1 Zochem LLC
- 12.1.1.1. Company Overview
- 12.1.1.2. Products
- 12.1.1.3. Company Financials
- 12.1.1.4. SWOT Analysis
- 12.1.2 U S Zinc
- 12.1.2.1. Company Overview
- 12.1.2.2. Products
- 12.1.2.3. Company Financials
- 12.1.2.4. SWOT Analysis
- 12.1.3 Pan-Continental Chemical Co Ltd
- 12.1.3.1. Company Overview
- 12.1.3.2. Products
- 12.1.3.3. Company Financials
- 12.1.3.4. SWOT Analysis
- 12.1.4 Old Bridge Chemicals Inc
- 12.1.4.1. Company Overview
- 12.1.4.2. Products
- 12.1.4.3. Company Financials
- 12.1.4.4. SWOT Analysis
- 12.1.5 Intermediate Chemicals Company
- 12.1.5.1. Company Overview
- 12.1.5.2. Products
- 12.1.5.3. Company Financials
- 12.1.5.4. SWOT Analysis
- 12.1.6 Nexa
- 12.1.6.1. Company Overview
- 12.1.6.2. Products
- 12.1.6.3. Company Financials
- 12.1.6.4. SWOT Analysis
- 12.1.7 EverZinc
- 12.1.7.1. Company Overview
- 12.1.7.2. Products
- 12.1.7.3. Company Financials
- 12.1.7.4. SWOT Analysis
- 12.1.8 Rech Chemical Co Ltd
- 12.1.8.1. Company Overview
- 12.1.8.2. Products
- 12.1.8.3. Company Financials
- 12.1.8.4. SWOT Analysis
- 12.1.9 L Brüggemann GmbH & Co KG
- 12.1.9.1. Company Overview
- 12.1.9.2. Products
- 12.1.9.3. Company Financials
- 12.1.9.4. SWOT Analysis
- 12.1.10 Rubamin
- 12.1.10.1. Company Overview
- 12.1.10.2. Products
- 12.1.10.3. Company Financials
- 12.1.10.4. SWOT Analysis
- 12.1.11 Changsha Lantian Chemical Co Ltd
- 12.1.11.1. Company Overview
- 12.1.11.2. Products
- 12.1.11.3. Company Financials
- 12.1.11.4. SWOT Analysis
- 12.1.12 Weifang Longda Zinc Industry Co Ltd
- 12.1.12.1. Company Overview
- 12.1.12.2. Products
- 12.1.12.3. Company Financials
- 12.1.12.4. SWOT Analysis
- 12.1.13 Flaurea Chemicals
- 12.1.13.1. Company Overview
- 12.1.13.2. Products
- 12.1.13.3. Company Financials
- 12.1.13.4. SWOT Analysis
- 12.1.14 Silox India Pvt Ltd
- 12.1.14.1. Company Overview
- 12.1.14.2. Products
- 12.1.14.3. Company Financials
- 12.1.14.4. SWOT Analysis
- 12.1.15 Seyang Zinc Technology (Huai An) Co Ltd
- 12.1.15.1. Company Overview
- 12.1.15.2. Products
- 12.1.15.3. Company Financials
- 12.1.15.4. SWOT Analysis
- 12.1.16 TIB Chemicals AG
- 12.1.16.1. Company Overview
- 12.1.16.2. Products
- 12.1.16.3. Company Financials
- 12.1.16.4. SWOT Analysis
- 12.1.17 Global Chemical Co Ltd
- 12.1.17.1. Company Overview
- 12.1.17.2. Products
- 12.1.17.3. Company Financials
- 12.1.17.4. SWOT Analysis
- 12.1.18 Hakusui Tech
- 12.1.18.1. Company Overview
- 12.1.18.2. Products
- 12.1.18.3. Company Financials
- 12.1.18.4. SWOT Analysis
- 12.1.19 American Chemet Corporation
- 12.1.19.1. Company Overview
- 12.1.19.2. Products
- 12.1.19.3. Company Financials
- 12.1.19.4. SWOT Analysis
- 12.1.1 Zochem LLC
- 12.2. Market Entropy
- 12.2.1 Company's Key Areas Served
- 12.2.2 Recent Developments
- 12.3. Company Market Share Analysis 2025
- 12.3.1 Top 5 Companies Market Share Analysis
- 12.3.2 Top 3 Companies Market Share Analysis
- 12.4. List of Potential Customers
- 13. Research Methodology
List of Figures
- Figure 1: Global Zinc Sulfate Industry Revenue Breakdown (billion, %) by Region 2025 & 2033
- Figure 2: Global Zinc Sulfate Industry Volume Breakdown (K Tons, %) by Region 2025 & 2033
- Figure 3: Asia Pacific Zinc Sulfate Industry Revenue (billion), by Type 2025 & 2033
- Figure 4: Asia Pacific Zinc Sulfate Industry Volume (K Tons), by Type 2025 & 2033
- Figure 5: Asia Pacific Zinc Sulfate Industry Revenue Share (%), by Type 2025 & 2033
- Figure 6: Asia Pacific Zinc Sulfate Industry Volume Share (%), by Type 2025 & 2033
- Figure 7: Asia Pacific Zinc Sulfate Industry Revenue (billion), by End-user Industry 2025 & 2033
- Figure 8: Asia Pacific Zinc Sulfate Industry Volume (K Tons), by End-user Industry 2025 & 2033
- Figure 9: Asia Pacific Zinc Sulfate Industry Revenue Share (%), by End-user Industry 2025 & 2033
- Figure 10: Asia Pacific Zinc Sulfate Industry Volume Share (%), by End-user Industry 2025 & 2033
- Figure 11: Asia Pacific Zinc Sulfate Industry Revenue (billion), by Country 2025 & 2033
- Figure 12: Asia Pacific Zinc Sulfate Industry Volume (K Tons), by Country 2025 & 2033
- Figure 13: Asia Pacific Zinc Sulfate Industry Revenue Share (%), by Country 2025 & 2033
- Figure 14: Asia Pacific Zinc Sulfate Industry Volume Share (%), by Country 2025 & 2033
- Figure 15: North America Zinc Sulfate Industry Revenue (billion), by Type 2025 & 2033
- Figure 16: North America Zinc Sulfate Industry Volume (K Tons), by Type 2025 & 2033
- Figure 17: North America Zinc Sulfate Industry Revenue Share (%), by Type 2025 & 2033
- Figure 18: North America Zinc Sulfate Industry Volume Share (%), by Type 2025 & 2033
- Figure 19: North America Zinc Sulfate Industry Revenue (billion), by End-user Industry 2025 & 2033
- Figure 20: North America Zinc Sulfate Industry Volume (K Tons), by End-user Industry 2025 & 2033
- Figure 21: North America Zinc Sulfate Industry Revenue Share (%), by End-user Industry 2025 & 2033
- Figure 22: North America Zinc Sulfate Industry Volume Share (%), by End-user Industry 2025 & 2033
- Figure 23: North America Zinc Sulfate Industry Revenue (billion), by Country 2025 & 2033
- Figure 24: North America Zinc Sulfate Industry Volume (K Tons), by Country 2025 & 2033
- Figure 25: North America Zinc Sulfate Industry Revenue Share (%), by Country 2025 & 2033
- Figure 26: North America Zinc Sulfate Industry Volume Share (%), by Country 2025 & 2033
- Figure 27: Europe Zinc Sulfate Industry Revenue (billion), by Type 2025 & 2033
- Figure 28: Europe Zinc Sulfate Industry Volume (K Tons), by Type 2025 & 2033
- Figure 29: Europe Zinc Sulfate Industry Revenue Share (%), by Type 2025 & 2033
- Figure 30: Europe Zinc Sulfate Industry Volume Share (%), by Type 2025 & 2033
- Figure 31: Europe Zinc Sulfate Industry Revenue (billion), by End-user Industry 2025 & 2033
- Figure 32: Europe Zinc Sulfate Industry Volume (K Tons), by End-user Industry 2025 & 2033
- Figure 33: Europe Zinc Sulfate Industry Revenue Share (%), by End-user Industry 2025 & 2033
- Figure 34: Europe Zinc Sulfate Industry Volume Share (%), by End-user Industry 2025 & 2033
- Figure 35: Europe Zinc Sulfate Industry Revenue (billion), by Country 2025 & 2033
- Figure 36: Europe Zinc Sulfate Industry Volume (K Tons), by Country 2025 & 2033
- Figure 37: Europe Zinc Sulfate Industry Revenue Share (%), by Country 2025 & 2033
- Figure 38: Europe Zinc Sulfate Industry Volume Share (%), by Country 2025 & 2033
- Figure 39: South America Zinc Sulfate Industry Revenue (billion), by Type 2025 & 2033
- Figure 40: South America Zinc Sulfate Industry Volume (K Tons), by Type 2025 & 2033
- Figure 41: South America Zinc Sulfate Industry Revenue Share (%), by Type 2025 & 2033
- Figure 42: South America Zinc Sulfate Industry Volume Share (%), by Type 2025 & 2033
- Figure 43: South America Zinc Sulfate Industry Revenue (billion), by End-user Industry 2025 & 2033
- Figure 44: South America Zinc Sulfate Industry Volume (K Tons), by End-user Industry 2025 & 2033
- Figure 45: South America Zinc Sulfate Industry Revenue Share (%), by End-user Industry 2025 & 2033
- Figure 46: South America Zinc Sulfate Industry Volume Share (%), by End-user Industry 2025 & 2033
- Figure 47: South America Zinc Sulfate Industry Revenue (billion), by Country 2025 & 2033
- Figure 48: South America Zinc Sulfate Industry Volume (K Tons), by Country 2025 & 2033
- Figure 49: South America Zinc Sulfate Industry Revenue Share (%), by Country 2025 & 2033
- Figure 50: South America Zinc Sulfate Industry Volume Share (%), by Country 2025 & 2033
- Figure 51: Middle East and Africa Zinc Sulfate Industry Revenue (billion), by Type 2025 & 2033
- Figure 52: Middle East and Africa Zinc Sulfate Industry Volume (K Tons), by Type 2025 & 2033
- Figure 53: Middle East and Africa Zinc Sulfate Industry Revenue Share (%), by Type 2025 & 2033
- Figure 54: Middle East and Africa Zinc Sulfate Industry Volume Share (%), by Type 2025 & 2033
- Figure 55: Middle East and Africa Zinc Sulfate Industry Revenue (billion), by End-user Industry 2025 & 2033
- Figure 56: Middle East and Africa Zinc Sulfate Industry Volume (K Tons), by End-user Industry 2025 & 2033
- Figure 57: Middle East and Africa Zinc Sulfate Industry Revenue Share (%), by End-user Industry 2025 & 2033
- Figure 58: Middle East and Africa Zinc Sulfate Industry Volume Share (%), by End-user Industry 2025 & 2033
- Figure 59: Middle East and Africa Zinc Sulfate Industry Revenue (billion), by Country 2025 & 2033
- Figure 60: Middle East and Africa Zinc Sulfate Industry Volume (K Tons), by Country 2025 & 2033
- Figure 61: Middle East and Africa Zinc Sulfate Industry Revenue Share (%), by Country 2025 & 2033
- Figure 62: Middle East and Africa Zinc Sulfate Industry Volume Share (%), by Country 2025 & 2033
List of Tables
- Table 1: Global Zinc Sulfate Industry Revenue billion Forecast, by Type 2020 & 2033
- Table 2: Global Zinc Sulfate Industry Volume K Tons Forecast, by Type 2020 & 2033
- Table 3: Global Zinc Sulfate Industry Revenue billion Forecast, by End-user Industry 2020 & 2033
- Table 4: Global Zinc Sulfate Industry Volume K Tons Forecast, by End-user Industry 2020 & 2033
- Table 5: Global Zinc Sulfate Industry Revenue billion Forecast, by Region 2020 & 2033
- Table 6: Global Zinc Sulfate Industry Volume K Tons Forecast, by Region 2020 & 2033
- Table 7: Global Zinc Sulfate Industry Revenue billion Forecast, by Type 2020 & 2033
- Table 8: Global Zinc Sulfate Industry Volume K Tons Forecast, by Type 2020 & 2033
- Table 9: Global Zinc Sulfate Industry Revenue billion Forecast, by End-user Industry 2020 & 2033
- Table 10: Global Zinc Sulfate Industry Volume K Tons Forecast, by End-user Industry 2020 & 2033
- Table 11: Global Zinc Sulfate Industry Revenue billion Forecast, by Country 2020 & 2033
- Table 12: Global Zinc Sulfate Industry Volume K Tons Forecast, by Country 2020 & 2033
- Table 13: China Zinc Sulfate Industry Revenue (billion) Forecast, by Application 2020 & 2033
- Table 14: China Zinc Sulfate Industry Volume (K Tons) Forecast, by Application 2020 & 2033
- Table 15: India Zinc Sulfate Industry Revenue (billion) Forecast, by Application 2020 & 2033
- Table 16: India Zinc Sulfate Industry Volume (K Tons) Forecast, by Application 2020 & 2033
- Table 17: Japan Zinc Sulfate Industry Revenue (billion) Forecast, by Application 2020 & 2033
- Table 18: Japan Zinc Sulfate Industry Volume (K Tons) Forecast, by Application 2020 & 2033
- Table 19: South Korea Zinc Sulfate Industry Revenue (billion) Forecast, by Application 2020 & 2033
- Table 20: South Korea Zinc Sulfate Industry Volume (K Tons) Forecast, by Application 2020 & 2033
- Table 21: Malaysia Zinc Sulfate Industry Revenue (billion) Forecast, by Application 2020 & 2033
- Table 22: Malaysia Zinc Sulfate Industry Volume (K Tons) Forecast, by Application 2020 & 2033
- Table 23: Thailand Zinc Sulfate Industry Revenue (billion) Forecast, by Application 2020 & 2033
- Table 24: Thailand Zinc Sulfate Industry Volume (K Tons) Forecast, by Application 2020 & 2033
- Table 25: Indonesia Zinc Sulfate Industry Revenue (billion) Forecast, by Application 2020 & 2033
- Table 26: Indonesia Zinc Sulfate Industry Volume (K Tons) Forecast, by Application 2020 & 2033
- Table 27: Vietnam Zinc Sulfate Industry Revenue (billion) Forecast, by Application 2020 & 2033
- Table 28: Vietnam Zinc Sulfate Industry Volume (K Tons) Forecast, by Application 2020 & 2033
- Table 29: Rest of Asia Pacific Zinc Sulfate Industry Revenue (billion) Forecast, by Application 2020 & 2033
- Table 30: Rest of Asia Pacific Zinc Sulfate Industry Volume (K Tons) Forecast, by Application 2020 & 2033
- Table 31: Global Zinc Sulfate Industry Revenue billion Forecast, by Type 2020 & 2033
- Table 32: Global Zinc Sulfate Industry Volume K Tons Forecast, by Type 2020 & 2033
- Table 33: Global Zinc Sulfate Industry Revenue billion Forecast, by End-user Industry 2020 & 2033
- Table 34: Global Zinc Sulfate Industry Volume K Tons Forecast, by End-user Industry 2020 & 2033
- Table 35: Global Zinc Sulfate Industry Revenue billion Forecast, by Country 2020 & 2033
- Table 36: Global Zinc Sulfate Industry Volume K Tons Forecast, by Country 2020 & 2033
- Table 37: United States Zinc Sulfate Industry Revenue (billion) Forecast, by Application 2020 & 2033
- Table 38: United States Zinc Sulfate Industry Volume (K Tons) Forecast, by Application 2020 & 2033
- Table 39: Canada Zinc Sulfate Industry Revenue (billion) Forecast, by Application 2020 & 2033
- Table 40: Canada Zinc Sulfate Industry Volume (K Tons) Forecast, by Application 2020 & 2033
- Table 41: Mexico Zinc Sulfate Industry Revenue (billion) Forecast, by Application 2020 & 2033
- Table 42: Mexico Zinc Sulfate Industry Volume (K Tons) Forecast, by Application 2020 & 2033
- Table 43: Global Zinc Sulfate Industry Revenue billion Forecast, by Type 2020 & 2033
- Table 44: Global Zinc Sulfate Industry Volume K Tons Forecast, by Type 2020 & 2033
- Table 45: Global Zinc Sulfate Industry Revenue billion Forecast, by End-user Industry 2020 & 2033
- Table 46: Global Zinc Sulfate Industry Volume K Tons Forecast, by End-user Industry 2020 & 2033
- Table 47: Global Zinc Sulfate Industry Revenue billion Forecast, by Country 2020 & 2033
- Table 48: Global Zinc Sulfate Industry Volume K Tons Forecast, by Country 2020 & 2033
- Table 49: Germany Zinc Sulfate Industry Revenue (billion) Forecast, by Application 2020 & 2033
- Table 50: Germany Zinc Sulfate Industry Volume (K Tons) Forecast, by Application 2020 & 2033
- Table 51: United Kingdom Zinc Sulfate Industry Revenue (billion) Forecast, by Application 2020 & 2033
- Table 52: United Kingdom Zinc Sulfate Industry Volume (K Tons) Forecast, by Application 2020 & 2033
- Table 53: France Zinc Sulfate Industry Revenue (billion) Forecast, by Application 2020 & 2033
- Table 54: France Zinc Sulfate Industry Volume (K Tons) Forecast, by Application 2020 & 2033
- Table 55: Italy Zinc Sulfate Industry Revenue (billion) Forecast, by Application 2020 & 2033
- Table 56: Italy Zinc Sulfate Industry Volume (K Tons) Forecast, by Application 2020 & 2033
- Table 57: Spain Zinc Sulfate Industry Revenue (billion) Forecast, by Application 2020 & 2033
- Table 58: Spain Zinc Sulfate Industry Volume (K Tons) Forecast, by Application 2020 & 2033
- Table 59: Turkey Zinc Sulfate Industry Revenue (billion) Forecast, by Application 2020 & 2033
- Table 60: Turkey Zinc Sulfate Industry Volume (K Tons) Forecast, by Application 2020 & 2033
- Table 61: Russia Zinc Sulfate Industry Revenue (billion) Forecast, by Application 2020 & 2033
- Table 62: Russia Zinc Sulfate Industry Volume (K Tons) Forecast, by Application 2020 & 2033
- Table 63: NORDIC Countries Zinc Sulfate Industry Revenue (billion) Forecast, by Application 2020 & 2033
- Table 64: NORDIC Countries Zinc Sulfate Industry Volume (K Tons) Forecast, by Application 2020 & 2033
- Table 65: Rest of Europe Zinc Sulfate Industry Revenue (billion) Forecast, by Application 2020 & 2033
- Table 66: Rest of Europe Zinc Sulfate Industry Volume (K Tons) Forecast, by Application 2020 & 2033
- Table 67: Global Zinc Sulfate Industry Revenue billion Forecast, by Type 2020 & 2033
- Table 68: Global Zinc Sulfate Industry Volume K Tons Forecast, by Type 2020 & 2033
- Table 69: Global Zinc Sulfate Industry Revenue billion Forecast, by End-user Industry 2020 & 2033
- Table 70: Global Zinc Sulfate Industry Volume K Tons Forecast, by End-user Industry 2020 & 2033
- Table 71: Global Zinc Sulfate Industry Revenue billion Forecast, by Country 2020 & 2033
- Table 72: Global Zinc Sulfate Industry Volume K Tons Forecast, by Country 2020 & 2033
- Table 73: Brazil Zinc Sulfate Industry Revenue (billion) Forecast, by Application 2020 & 2033
- Table 74: Brazil Zinc Sulfate Industry Volume (K Tons) Forecast, by Application 2020 & 2033
- Table 75: Argentina Zinc Sulfate Industry Revenue (billion) Forecast, by Application 2020 & 2033
- Table 76: Argentina Zinc Sulfate Industry Volume (K Tons) Forecast, by Application 2020 & 2033
- Table 77: Colombia Zinc Sulfate Industry Revenue (billion) Forecast, by Application 2020 & 2033
- Table 78: Colombia Zinc Sulfate Industry Volume (K Tons) Forecast, by Application 2020 & 2033
- Table 79: Rest of South America Zinc Sulfate Industry Revenue (billion) Forecast, by Application 2020 & 2033
- Table 80: Rest of South America Zinc Sulfate Industry Volume (K Tons) Forecast, by Application 2020 & 2033
- Table 81: Global Zinc Sulfate Industry Revenue billion Forecast, by Type 2020 & 2033
- Table 82: Global Zinc Sulfate Industry Volume K Tons Forecast, by Type 2020 & 2033
- Table 83: Global Zinc Sulfate Industry Revenue billion Forecast, by End-user Industry 2020 & 2033
- Table 84: Global Zinc Sulfate Industry Volume K Tons Forecast, by End-user Industry 2020 & 2033
- Table 85: Global Zinc Sulfate Industry Revenue billion Forecast, by Country 2020 & 2033
- Table 86: Global Zinc Sulfate Industry Volume K Tons Forecast, by Country 2020 & 2033
- Table 87: Saudi Arabia Zinc Sulfate Industry Revenue (billion) Forecast, by Application 2020 & 2033
- Table 88: Saudi Arabia Zinc Sulfate Industry Volume (K Tons) Forecast, by Application 2020 & 2033
- Table 89: Nigeria Zinc Sulfate Industry Revenue (billion) Forecast, by Application 2020 & 2033
- Table 90: Nigeria Zinc Sulfate Industry Volume (K Tons) Forecast, by Application 2020 & 2033
- Table 91: Qatar Zinc Sulfate Industry Revenue (billion) Forecast, by Application 2020 & 2033
- Table 92: Qatar Zinc Sulfate Industry Volume (K Tons) Forecast, by Application 2020 & 2033
- Table 93: Egypt Zinc Sulfate Industry Revenue (billion) Forecast, by Application 2020 & 2033
- Table 94: Egypt Zinc Sulfate Industry Volume (K Tons) Forecast, by Application 2020 & 2033
- Table 95: United Arab Emirates Zinc Sulfate Industry Revenue (billion) Forecast, by Application 2020 & 2033
- Table 96: United Arab Emirates Zinc Sulfate Industry Volume (K Tons) Forecast, by Application 2020 & 2033
- Table 97: South Africa Zinc Sulfate Industry Revenue (billion) Forecast, by Application 2020 & 2033
- Table 98: South Africa Zinc Sulfate Industry Volume (K Tons) Forecast, by Application 2020 & 2033
- Table 99: Rest of Middle East and Africa Zinc Sulfate Industry Revenue (billion) Forecast, by Application 2020 & 2033
- Table 100: Rest of Middle East and Africa Zinc Sulfate Industry Volume (K Tons) Forecast, by Application 2020 & 2033
Frequently Asked Questions
1. What is the projected Compound Annual Growth Rate (CAGR) of the Zinc Sulfate Industry?
The projected CAGR is approximately 5.5%.
2. Which companies are prominent players in the Zinc Sulfate Industry?
Key companies in the market include Zochem LLC, U S Zinc, Pan-Continental Chemical Co Ltd, Old Bridge Chemicals Inc, Intermediate Chemicals Company, Nexa, EverZinc, Rech Chemical Co Ltd, L Brüggemann GmbH & Co KG, Rubamin, Changsha Lantian Chemical Co Ltd, Weifang Longda Zinc Industry Co Ltd, Flaurea Chemicals, Silox India Pvt Ltd, Seyang Zinc Technology (Huai An) Co Ltd, TIB Chemicals AG, Global Chemical Co Ltd, Hakusui Tech, American Chemet Corporation.
3. What are the main segments of the Zinc Sulfate Industry?
The market segments include Type, End-user Industry.
4. Can you provide details about the market size?
The market size is estimated to be USD 2 billion as of 2022.
5. What are some drivers contributing to market growth?
Rising Utilization in Automotive Industry; Increasing Demand from the Rubber Tires Industry.
6. What are the notable trends driving market growth?
Rubber Processing Segment to Dominate the Market.
7. Are there any restraints impacting market growth?
Health Hazard Related to Zinc Chemical.
8. Can you provide examples of recent developments in the market?
Recent developments in the market studied will be covered in the complete report.
9. What pricing options are available for accessing the report?
Pricing options include single-user, multi-user, and enterprise licenses priced at USD 4750, USD 5250, and USD 8750 respectively.
10. Is the market size provided in terms of value or volume?
The market size is provided in terms of value, measured in billion and volume, measured in K Tons.
11. Are there any specific market keywords associated with the report?
Yes, the market keyword associated with the report is "Zinc Sulfate Industry," which aids in identifying and referencing the specific market segment covered.
12. How do I determine which pricing option suits my needs best?
The pricing options vary based on user requirements and access needs. Individual users may opt for single-user licenses, while businesses requiring broader access may choose multi-user or enterprise licenses for cost-effective access to the report.
13. Are there any additional resources or data provided in the Zinc Sulfate Industry report?
While the report offers comprehensive insights, it's advisable to review the specific contents or supplementary materials provided to ascertain if additional resources or data are available.
14. How can I stay updated on further developments or reports in the Zinc Sulfate Industry?
To stay informed about further developments, trends, and reports in the Zinc Sulfate Industry, consider subscribing to industry newsletters, following relevant companies and organizations, or regularly checking reputable industry news sources and publications.
Methodology
Step 1 - Identification of Relevant Samples Size from Population Database


Step 2 - Approaches for Defining Global Market Size (Value, Volume* & Price*)

Note*: In applicable scenarios
Step 3 - Data Sources
Primary Research
- Web Analytics
- Survey Reports
- Research Institute
- Latest Research Reports
- Opinion Leaders
Secondary Research
- Annual Reports
- White Paper
- Latest Press Release
- Industry Association
- Paid Database
- Investor Presentations

Step 4 - Data Triangulation
Involves using different sources of information in order to increase the validity of a study
These sources are likely to be stakeholders in a program - participants, other researchers, program staff, other community members, and so on.
Then we put all data in single framework & apply various statistical tools to find out the dynamic on the market.
During the analysis stage, feedback from the stakeholder groups would be compared to determine areas of agreement as well as areas of divergence