


Key Insights
The global Agricultural Environmental Sensor market is poised for significant expansion, projected to reach USD 4.81 billion by 2025, demonstrating a robust compound annual growth rate (CAGR) of 9.9%. This upward trajectory is propelled by an increasing global demand for food security, the imperative to optimize agricultural resource utilization, and the growing adoption of precision agriculture techniques. Farmers worldwide are recognizing the critical role of real-time environmental data in making informed decisions, leading to improved crop yields, reduced input costs (water, fertilizers, pesticides), and enhanced sustainability. The market is segmented by application, with Agricultural Cultivation, Agricultural Farming, and Agricultural Irrigation emerging as key growth areas, reflecting the direct impact of environmental monitoring on core farming operations. Temperature and humidity sensors represent the dominant types, offering foundational data for a wide array of environmental assessments.
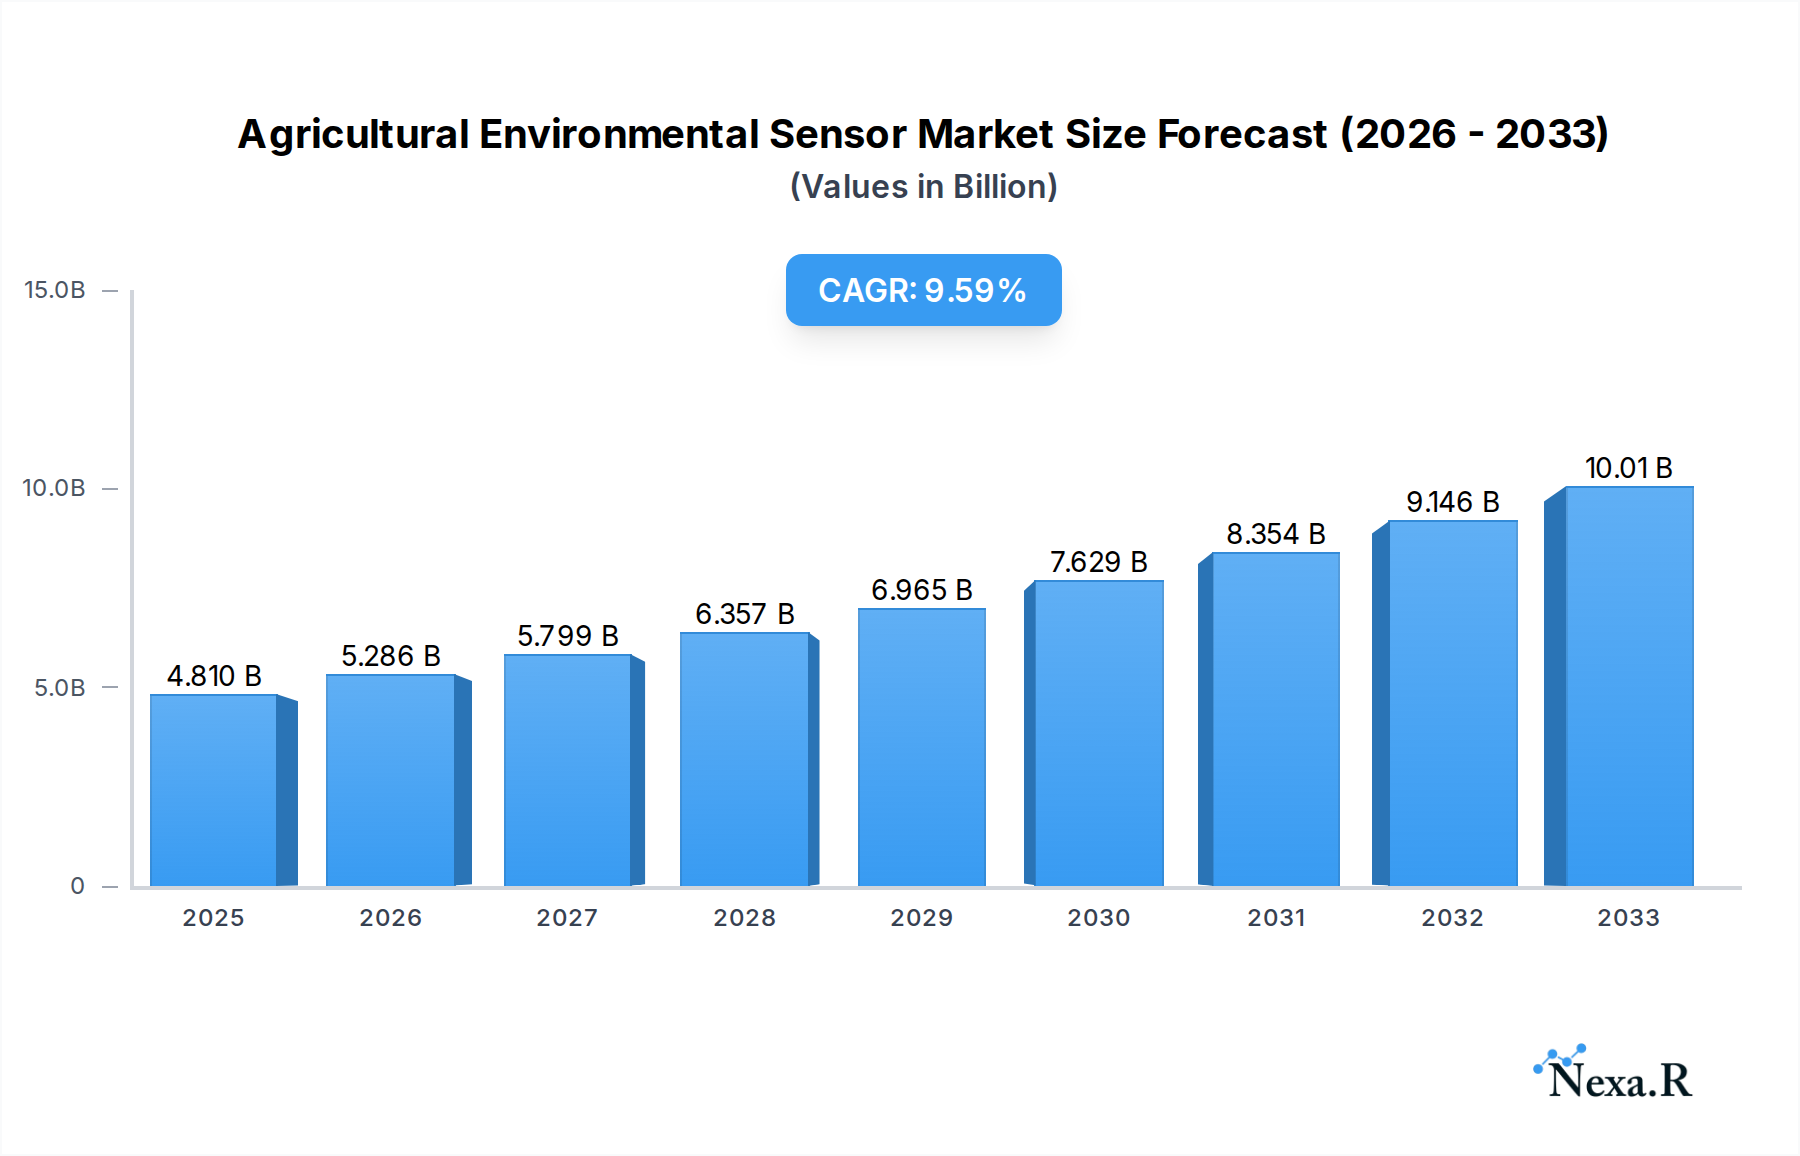
Agricultural Environmental Sensor Market Size (In Billion)

The market's growth is further bolstered by technological advancements in sensor accuracy, connectivity, and data analytics, making sophisticated environmental monitoring more accessible and actionable for a broader range of agricultural operations. The competitive landscape is dynamic, featuring established players like Rika, Murata, and DICKEY-john, alongside innovative startups such as CropX and Arable, all contributing to the development and deployment of advanced sensor solutions. Geographically, Asia Pacific is expected to witness substantial growth due to its large agricultural base and increasing investment in smart farming technologies. While the market is largely driven by the pursuit of efficiency and sustainability, challenges such as the initial cost of adoption, data integration complexities, and the need for specialized technical expertise may temper rapid adoption in certain regions. Nevertheless, the overarching benefits of precision agriculture, facilitated by environmental sensors, are undeniable, ensuring sustained market growth in the coming years.
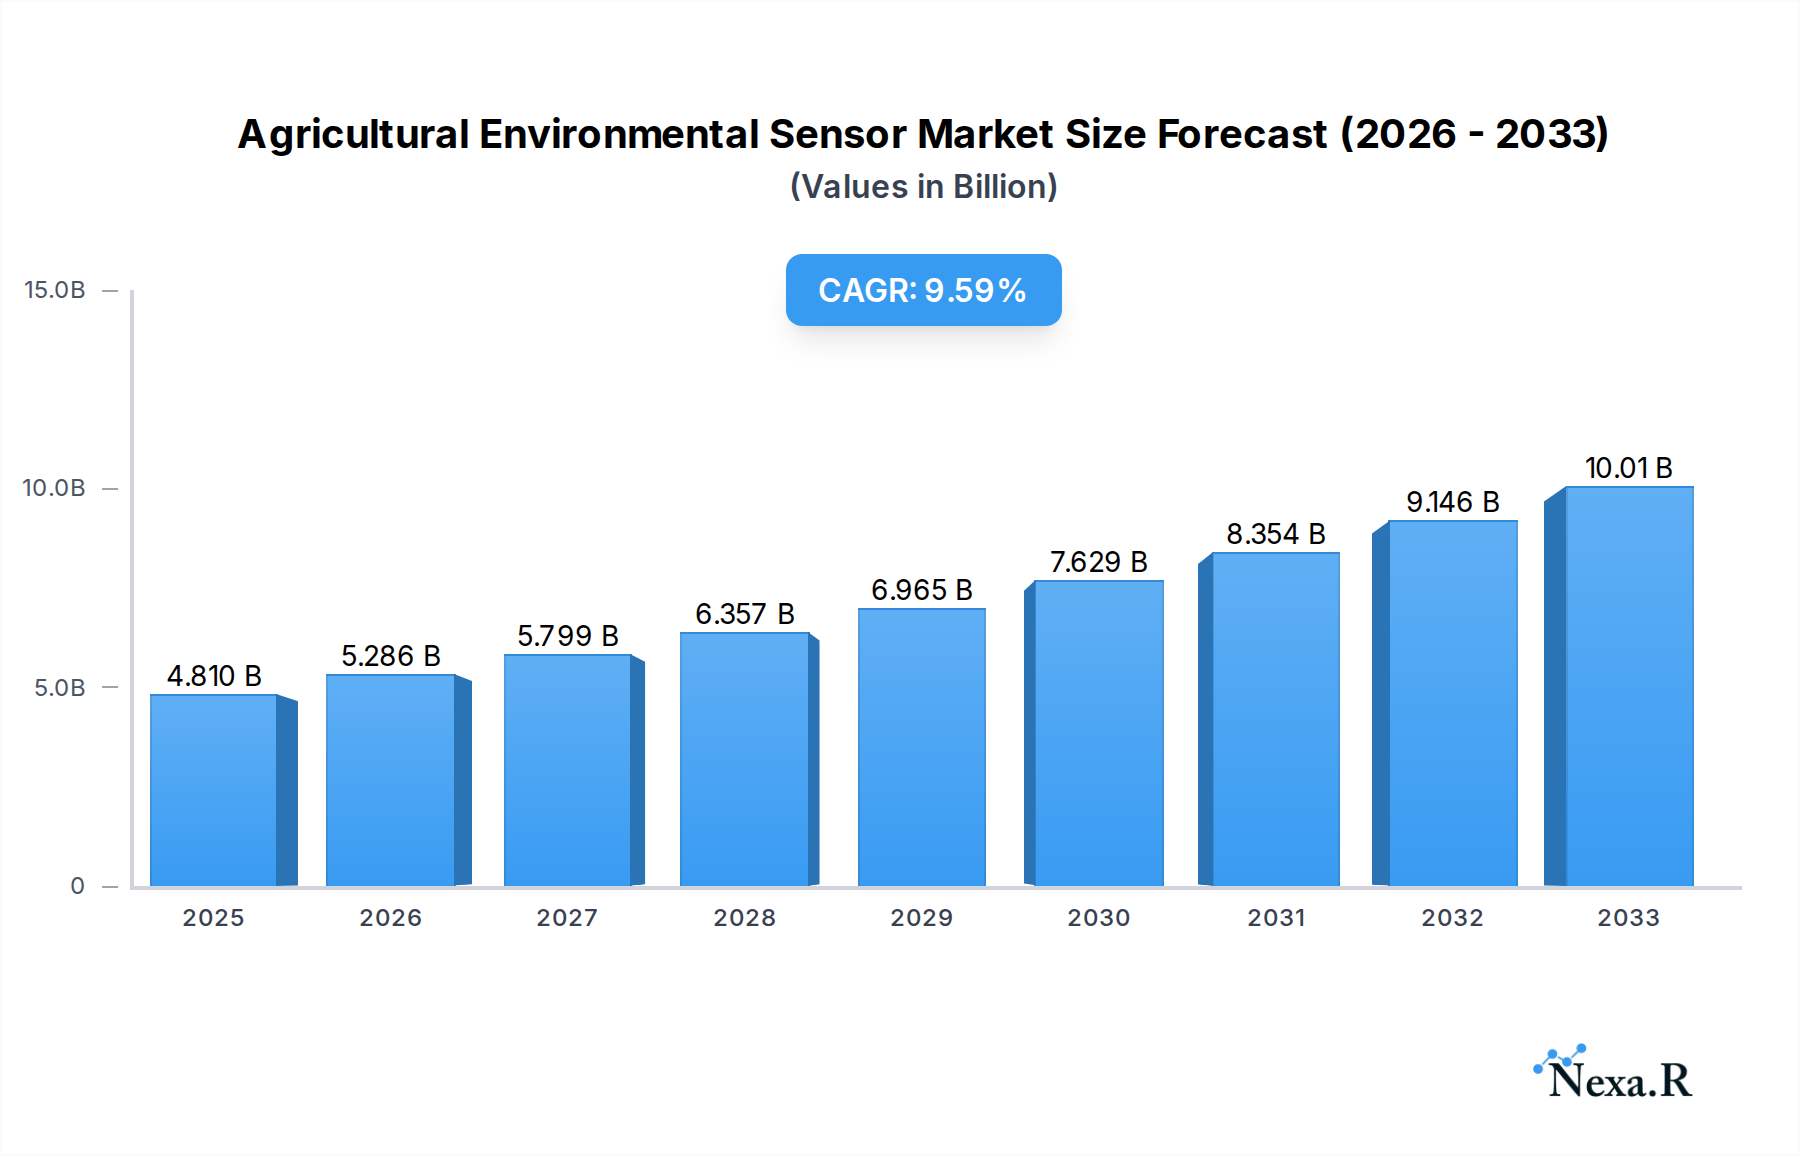
Agricultural Environmental Sensor Company Market Share
Agricultural Environmental Sensor Market Report: Precision Agriculture and Sustainable Farming
This comprehensive market report provides an in-depth analysis of the global Agricultural Environmental Sensor market, a critical component of modern precision agriculture. Spanning from 2019 to 2033, with a base year of 2025 and a forecast period of 2025–2033, this report delves into market dynamics, growth trends, regional dominance, product landscape, key drivers, barriers, emerging opportunities, growth accelerators, and the key players shaping this vital industry. The report is structured to deliver actionable insights for stakeholders, investors, and industry professionals seeking to understand and capitalize on the burgeoning opportunities in smart farming and sustainable agricultural practices.
Agricultural Environmental Sensor Market Dynamics & Structure
The Agricultural Environmental Sensor market is characterized by a moderately concentrated structure, with several key players dominating the landscape, alongside a growing number of innovative SMEs. Technological innovation is a primary driver, with advancements in IoT, AI, and miniaturization enabling more accurate and cost-effective sensor solutions. Regulatory frameworks are evolving to promote sustainable agriculture and data-driven farming, indirectly boosting sensor adoption. Competitive product substitutes are limited, with the primary competition arising from alternative data acquisition methods and integrated farm management systems. End-user demographics are shifting towards younger, tech-savvy farmers and larger agricultural corporations seeking efficiency and yield optimization. Merger and acquisition (M&A) activity is expected to remain robust as larger companies seek to integrate specialized sensor technologies and expand their market reach.
- Market Concentration: Key players like Rika, Murata, and DICKEY-john hold significant market share, but the market is increasingly fragmented with specialized solution providers.
- Technological Innovation Drivers: Miniaturization, wireless connectivity (LoRaWAN, NB-IoT), AI-powered data analytics, and low-power consumption are crucial for sensor development.
- Regulatory Frameworks: Government incentives for precision agriculture, environmental protection mandates, and data privacy regulations influence sensor deployment.
- Competitive Product Substitutes: Manual data collection, satellite imagery analysis, and older, less sophisticated measurement tools represent indirect competition.
- End-User Demographics: Farmers aged 30-55, agricultural cooperatives, research institutions, and large agribusinesses are the primary adopters.
- M&A Trends: Strategic acquisitions by AgTech giants to enhance their IoT offerings and data analytics capabilities are anticipated.
Agricultural Environmental Sensor Growth Trends & Insights
The global Agricultural Environmental Sensor market is poised for significant expansion, driven by the imperative for enhanced crop yields, optimized resource utilization, and sustainable farming practices. The market is projected to witness a Compound Annual Growth Rate (CAGR) of xx% during the forecast period, escalating from an estimated $xx billion in 2025 to an anticipated $xx billion by 2033. This robust growth trajectory is underpinned by increasing global food demand, the rising costs of traditional farming inputs, and a growing awareness of the environmental impact of agriculture. The adoption of precision agriculture techniques, which rely heavily on real-time data from environmental sensors, is a key catalyst. Technological advancements in sensor accuracy, connectivity, and data processing capabilities are further democratizing access to these solutions, making them viable for a wider range of agricultural operations, from smallholder farms to large-scale agribusinesses.
The shift towards climate-smart agriculture is a significant consumer behavior shift, compelling farmers to adopt technologies that enable them to adapt to changing weather patterns and mitigate the effects of climate change. This includes sensors that monitor soil moisture, temperature, humidity, and nutrient levels, providing crucial data for informed decision-making. The integration of these sensors with IoT platforms and cloud-based analytics enables predictive modeling, helping farmers to anticipate pest outbreaks, optimize irrigation schedules, and fine-tune fertilization strategies, thereby reducing waste and improving profitability. The market penetration of environmental sensors is expected to increase substantially as awareness grows and the return on investment (ROI) becomes more evident. Furthermore, government initiatives and subsidies aimed at promoting technological adoption in agriculture are playing a crucial role in accelerating market growth. The increasing availability of data visualization tools and user-friendly interfaces is also reducing the technical barrier to entry for farmers, fostering wider adoption.
The parent market for Agricultural Environmental Sensors, encompassing the broader AgTech and Smart Farming sectors, is estimated to be valued at over $xx billion in 2025, with environmental sensors representing a substantial and rapidly growing segment. The child market, focusing on specific sensor types like Temperature Sensors and Humidity Sensors, also demonstrates significant growth, driven by their fundamental role in monitoring critical environmental parameters for optimal crop health and yield. The evolution of sensor networks, where multiple sensors collaborate to provide a holistic view of the farm environment, is another key trend. This interconnectedness allows for more sophisticated data analysis and prescriptive actions, further enhancing the value proposition of these technologies.
Dominant Regions, Countries, or Segments in Agricultural Environmental Sensor
North America is projected to emerge as the dominant region in the global Agricultural Environmental Sensor market, driven by a confluence of factors including a highly developed agricultural sector, significant investment in AgTech research and development, and proactive government policies supporting precision farming. The United States, in particular, is a leading adopter of advanced agricultural technologies, spurred by the need to enhance productivity and manage resource scarcity in large-scale farming operations. The robust infrastructure for internet connectivity and the presence of leading AgTech companies further solidify its position. Within North America, the Application segment of Agricultural Farming is expected to exhibit the strongest growth, encompassing a wide range of crop types and livestock management systems that benefit from precise environmental monitoring.
- North America's Dominance: Driven by technological adoption, R&D investment, and supportive government policies.
- Key Country: United States: Leading in precision agriculture adoption, with significant investments in AgTech.
- Dominant Application Segment: Agricultural Farming: Encompasses diverse farming operations requiring detailed environmental data for yield optimization and resource management.
- Growth Potential: Significant market share and high growth potential due to large farm sizes and advanced farming practices.
- Economic Policies: Subsidies and tax incentives for adopting precision agriculture technologies are key drivers.
- Infrastructure: Advanced irrigation systems, widespread internet access, and established logistics networks facilitate sensor deployment and data management.
- Market Share: North America is estimated to hold xx% of the global market share in 2025.
- CAGR: The region is expected to witness a CAGR of xx% during the forecast period.
The Types segment of Temperature Sensors and Humidity Sensors are fundamental components driving market growth across all applications. Their widespread applicability in monitoring crucial parameters for plant growth, soil health, and livestock well-being makes them indispensable. Agricultural Cultivation and Agricultural Irrigation are also significant application segments, with sensors playing a pivotal role in optimizing water usage and ensuring optimal growing conditions. The increasing focus on water conservation and efficient irrigation techniques further amplifies the demand for these sensor technologies. The Others application segment, encompassing specialized areas like controlled environment agriculture (CEA) and vertical farming, is also a rapidly expanding niche.
Agricultural Environmental Sensor Product Landscape
The Agricultural Environmental Sensor market is witnessing a surge in innovative product offerings designed for enhanced precision and durability in challenging farm environments. These include advanced Temperature Sensors capable of withstanding extreme conditions and providing real-time data, alongside sophisticated Humidity Sensors that accurately measure atmospheric and soil moisture levels. Companies like CropX and Arable are at the forefront, offering integrated sensor platforms that collect a multitude of environmental parameters, including soil temperature, humidity, electrical conductivity, and light intensity. Soil Scout Ltd and Sensoterra are recognized for their robust wireless soil sensors, providing granular insights into sub-surface conditions. Innovations focus on miniaturization, low-power consumption for extended battery life, and seamless integration with IoT networks and farm management software for data-driven decision-making.
Key Drivers, Barriers & Challenges in Agricultural Environmental Sensor
The Agricultural Environmental Sensor market is propelled by several key drivers, primarily the escalating need for increased agricultural productivity and efficiency in the face of a growing global population. The drive towards sustainable farming practices, aiming to reduce water usage, minimize chemical inputs, and mitigate environmental impact, further fuels demand. Technological advancements in IoT, AI, and wireless communication have made sophisticated sensor solutions more accessible and cost-effective. Government initiatives and subsidies promoting precision agriculture also act as significant growth accelerators.
- Key Drivers:
- Need for increased crop yields and food security.
- Growing demand for sustainable and resource-efficient farming.
- Technological advancements in IoT, AI, and data analytics.
- Government support and subsidies for precision agriculture.
- Rising operational costs in traditional farming.
However, the market faces several barriers and challenges. High initial investment costs for comprehensive sensor systems can be a deterrent for smallholder farmers. Connectivity issues in remote agricultural areas and the need for reliable power sources for sensors remain significant hurdles. Data management and the lack of skilled personnel to interpret complex data can also impede adoption. Furthermore, the interoperability of different sensor systems and platforms requires standardization to ensure seamless integration.
- Key Barriers & Challenges:
- High upfront investment costs for sensor systems.
- Limited internet connectivity in remote agricultural regions.
- Need for reliable and sustainable power sources for sensors.
- Challenges in data management and interpretation.
- Lack of skilled labor for operating and maintaining sensor systems.
- Interoperability issues between different sensor platforms.
Emerging Opportunities in Agricultural Environmental Sensor
Emerging opportunities within the Agricultural Environmental Sensor market lie in the development of hyper-spectral sensors for advanced crop health diagnostics and disease detection. The integration of AI and machine learning algorithms with sensor data to provide predictive analytics for yield forecasting and pest outbreak prevention presents a significant growth avenue. Furthermore, the expansion of sensor networks into emerging markets in Asia and Africa, where the adoption of precision agriculture is still nascent, offers untapped potential. The development of biodegradable and self-powered sensors, reducing electronic waste and maintenance needs, is another exciting area for innovation and market penetration.
Growth Accelerators in the Agricultural Environmental Sensor Industry
Long-term growth in the Agricultural Environmental Sensor industry is being significantly accelerated by breakthroughs in sensor technology, such as advancements in miniaturization leading to smaller, more discreet, and less invasive sensors. Strategic partnerships between sensor manufacturers, AgTech companies, and agricultural cooperatives are crucial for expanding market reach and providing integrated solutions. Market expansion strategies targeting developing economies, where the adoption of modern farming techniques is rapidly increasing, will further boost growth. The increasing focus on data standardization and open-source platforms will foster greater interoperability and innovation, driving wider adoption and creating new business models.
Key Players Shaping the Agricultural Environmental Sensor Market
- Rika
- Hindawi
- AKVA Group
- Ecomatik
- Spezia Srl
- Murata
- CropX
- Arable
- Farm21
- Sensoterra
- Soil Scout Ltd
- Veris Technologies
- Dacom
- FunaPhotonics ApS
- StyX Neutronica GmbH
- DICKEY-john
- GreenEye
- Agricultural Engineering Associates
Notable Milestones in Agricultural Environmental Sensor Sector
- 2019: Increased adoption of LoRaWAN technology for long-range, low-power sensor networks in agriculture.
- 2020: Launch of AI-powered analytics platforms integrating environmental sensor data for predictive farming insights.
- 2021: Growing interest in graphene-based sensors for improved sensitivity and durability in agricultural applications.
- 2022: Expansion of IoT ecosystems with seamless integration of diverse agricultural environmental sensors.
- 2023: Advancements in miniaturization leading to smaller, more unobtrusive soil moisture and temperature sensors.
- 2024: Increased focus on data security and privacy protocols for agricultural sensor networks.
In-Depth Agricultural Environmental Sensor Market Outlook
The outlook for the Agricultural Environmental Sensor market remains exceptionally bright, driven by the persistent global demand for food security and the imperative for sustainable agricultural practices. Growth accelerators such as ongoing technological innovation, particularly in AI-driven analytics and more efficient sensor designs, will continue to fuel market expansion. Strategic collaborations and market expansion into underserved regions will unlock significant untapped potential. The increasing recognition of sensors as an indispensable tool for optimizing resource management, reducing environmental impact, and enhancing profitability positions the Agricultural Environmental Sensor market for sustained and robust growth in the coming years, with a projected market value exceeding $xx billion by 2033.
Agricultural Environmental Sensor Segmentation
-
1. Application
- 1.1. Agricultural Cultivation
- 1.2. Agricultural Farming
- 1.3. Agricultural Irrigation
- 1.4. Agricultural Research
- 1.5. Others
-
2. Types
- 2.1. Temperature Sensor
- 2.2. Humidity Sensor
Agricultural Environmental Sensor Segmentation By Geography
-
1. North America
- 1.1. United States
- 1.2. Canada
- 1.3. Mexico
-
2. South America
- 2.1. Brazil
- 2.2. Argentina
- 2.3. Rest of South America
-
3. Europe
- 3.1. United Kingdom
- 3.2. Germany
- 3.3. France
- 3.4. Italy
- 3.5. Spain
- 3.6. Russia
- 3.7. Benelux
- 3.8. Nordics
- 3.9. Rest of Europe
-
4. Middle East & Africa
- 4.1. Turkey
- 4.2. Israel
- 4.3. GCC
- 4.4. North Africa
- 4.5. South Africa
- 4.6. Rest of Middle East & Africa
-
5. Asia Pacific
- 5.1. China
- 5.2. India
- 5.3. Japan
- 5.4. South Korea
- 5.5. ASEAN
- 5.6. Oceania
- 5.7. Rest of Asia Pacific
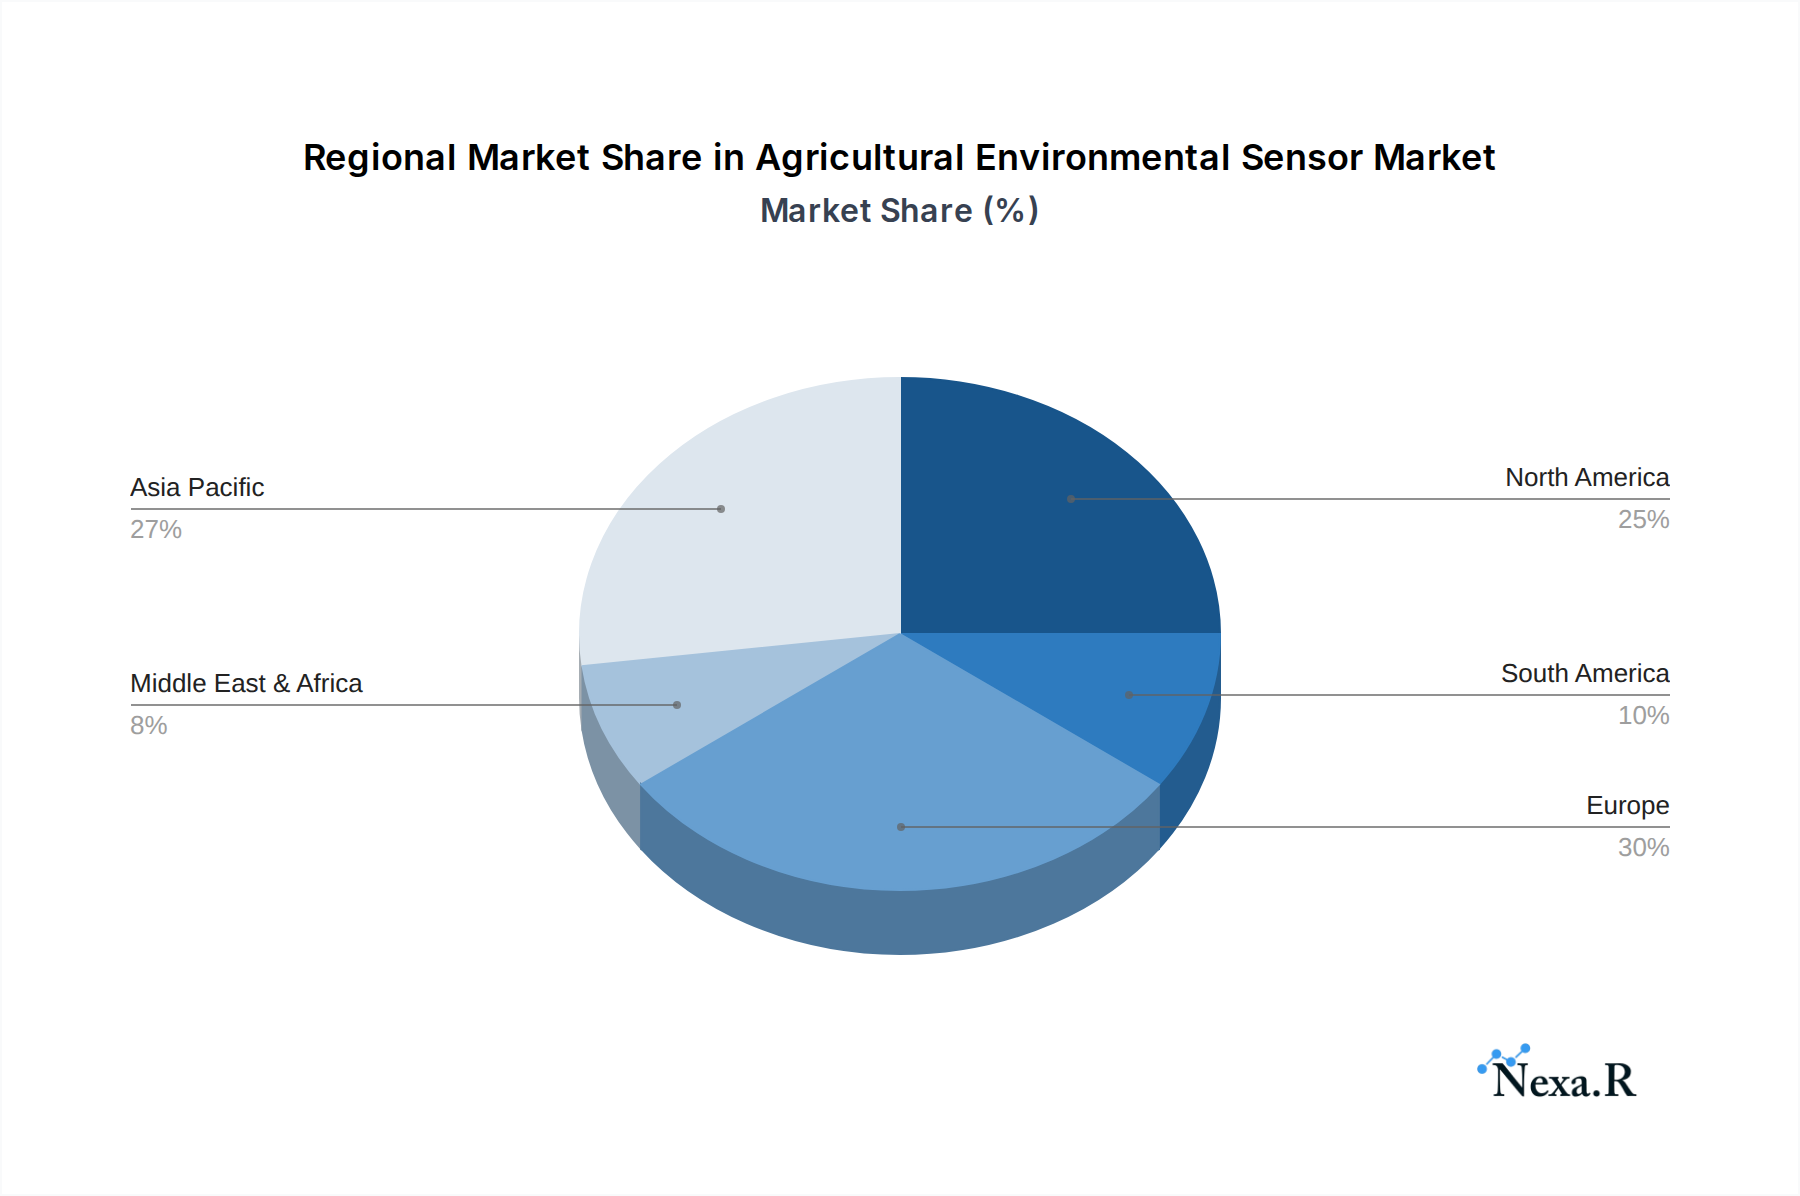
Agricultural Environmental Sensor Regional Market Share
Geographic Coverage of Agricultural Environmental Sensor
Agricultural Environmental Sensor REPORT HIGHLIGHTS
| Aspects | Details |
|---|---|
| Study Period | 2020-2034 |
| Base Year | 2025 |
| Estimated Year | 2026 |
| Forecast Period | 2026-2034 |
| Historical Period | 2020-2025 |
| Growth Rate | CAGR of 9.9% from 2020-2034 |
| Segmentation |
|
Table of Contents
- 1. Introduction
- 1.1. Research Scope
- 1.2. Market Segmentation
- 1.3. Research Objective
- 1.4. Definitions and Assumptions
- 2. Executive Summary
- 2.1. Market Snapshot
- 3. Market Dynamics
- 3.1. Market Drivers
- 3.2. Market Restrains
- 3.3. Market Trends
- 3.4. Market Opportunities
- 4. Market Factor Analysis
- 4.1. Porters Five Forces
- 4.1.1. Bargaining Power of Suppliers
- 4.1.2. Bargaining Power of Buyers
- 4.1.3. Threat of New Entrants
- 4.1.4. Threat of Substitutes
- 4.1.5. Competitive Rivalry
- 4.2. PESTEL analysis
- 4.3. BCG Analysis
- 4.3.1. Stars (High Growth, High Market Share)
- 4.3.2. Cash Cows (Low Growth, High Market Share)
- 4.3.3. Question Mark (High Growth, Low Market Share)
- 4.3.4. Dogs (Low Growth, Low Market Share)
- 4.4. Ansoff Matrix Analysis
- 4.5. Supply Chain Analysis
- 4.6. Regulatory Landscape
- 4.7. Current Market Potential and Opportunity Assessment (TAM–SAM–SOM Framework)
- 4.8. NRP Analyst Note
- 4.1. Porters Five Forces
- 5. Market Analysis, Insights and Forecast 2021-2033
- 5.1. Market Analysis, Insights and Forecast - by Application
- 5.1.1. Agricultural Cultivation
- 5.1.2. Agricultural Farming
- 5.1.3. Agricultural Irrigation
- 5.1.4. Agricultural Research
- 5.1.5. Others
- 5.2. Market Analysis, Insights and Forecast - by Types
- 5.2.1. Temperature Sensor
- 5.2.2. Humidity Sensor
- 5.3. Market Analysis, Insights and Forecast - by Region
- 5.3.1. North America
- 5.3.2. South America
- 5.3.3. Europe
- 5.3.4. Middle East & Africa
- 5.3.5. Asia Pacific
- 5.1. Market Analysis, Insights and Forecast - by Application
- 6. Global Agricultural Environmental Sensor Analysis, Insights and Forecast, 2021-2033
- 6.1. Market Analysis, Insights and Forecast - by Application
- 6.1.1. Agricultural Cultivation
- 6.1.2. Agricultural Farming
- 6.1.3. Agricultural Irrigation
- 6.1.4. Agricultural Research
- 6.1.5. Others
- 6.2. Market Analysis, Insights and Forecast - by Types
- 6.2.1. Temperature Sensor
- 6.2.2. Humidity Sensor
- 6.1. Market Analysis, Insights and Forecast - by Application
- 7. North America Agricultural Environmental Sensor Analysis, Insights and Forecast, 2020-2032
- 7.1. Market Analysis, Insights and Forecast - by Application
- 7.1.1. Agricultural Cultivation
- 7.1.2. Agricultural Farming
- 7.1.3. Agricultural Irrigation
- 7.1.4. Agricultural Research
- 7.1.5. Others
- 7.2. Market Analysis, Insights and Forecast - by Types
- 7.2.1. Temperature Sensor
- 7.2.2. Humidity Sensor
- 7.1. Market Analysis, Insights and Forecast - by Application
- 8. South America Agricultural Environmental Sensor Analysis, Insights and Forecast, 2020-2032
- 8.1. Market Analysis, Insights and Forecast - by Application
- 8.1.1. Agricultural Cultivation
- 8.1.2. Agricultural Farming
- 8.1.3. Agricultural Irrigation
- 8.1.4. Agricultural Research
- 8.1.5. Others
- 8.2. Market Analysis, Insights and Forecast - by Types
- 8.2.1. Temperature Sensor
- 8.2.2. Humidity Sensor
- 8.1. Market Analysis, Insights and Forecast - by Application
- 9. Europe Agricultural Environmental Sensor Analysis, Insights and Forecast, 2020-2032
- 9.1. Market Analysis, Insights and Forecast - by Application
- 9.1.1. Agricultural Cultivation
- 9.1.2. Agricultural Farming
- 9.1.3. Agricultural Irrigation
- 9.1.4. Agricultural Research
- 9.1.5. Others
- 9.2. Market Analysis, Insights and Forecast - by Types
- 9.2.1. Temperature Sensor
- 9.2.2. Humidity Sensor
- 9.1. Market Analysis, Insights and Forecast - by Application
- 10. Middle East & Africa Agricultural Environmental Sensor Analysis, Insights and Forecast, 2020-2032
- 10.1. Market Analysis, Insights and Forecast - by Application
- 10.1.1. Agricultural Cultivation
- 10.1.2. Agricultural Farming
- 10.1.3. Agricultural Irrigation
- 10.1.4. Agricultural Research
- 10.1.5. Others
- 10.2. Market Analysis, Insights and Forecast - by Types
- 10.2.1. Temperature Sensor
- 10.2.2. Humidity Sensor
- 10.1. Market Analysis, Insights and Forecast - by Application
- 11. Asia Pacific Agricultural Environmental Sensor Analysis, Insights and Forecast, 2020-2032
- 11.1. Market Analysis, Insights and Forecast - by Application
- 11.1.1. Agricultural Cultivation
- 11.1.2. Agricultural Farming
- 11.1.3. Agricultural Irrigation
- 11.1.4. Agricultural Research
- 11.1.5. Others
- 11.2. Market Analysis, Insights and Forecast - by Types
- 11.2.1. Temperature Sensor
- 11.2.2. Humidity Sensor
- 11.1. Market Analysis, Insights and Forecast - by Application
- 12. Competitive Analysis
- 12.1. Company Profiles
- 12.1.1 Rika
- 12.1.1.1. Company Overview
- 12.1.1.2. Products
- 12.1.1.3. Company Financials
- 12.1.1.4. SWOT Analysis
- 12.1.2 Hindawi
- 12.1.2.1. Company Overview
- 12.1.2.2. Products
- 12.1.2.3. Company Financials
- 12.1.2.4. SWOT Analysis
- 12.1.3 AKVA Group
- 12.1.3.1. Company Overview
- 12.1.3.2. Products
- 12.1.3.3. Company Financials
- 12.1.3.4. SWOT Analysis
- 12.1.4 Ecomatik
- 12.1.4.1. Company Overview
- 12.1.4.2. Products
- 12.1.4.3. Company Financials
- 12.1.4.4. SWOT Analysis
- 12.1.5 Spezia Srl
- 12.1.5.1. Company Overview
- 12.1.5.2. Products
- 12.1.5.3. Company Financials
- 12.1.5.4. SWOT Analysis
- 12.1.6 Murata
- 12.1.6.1. Company Overview
- 12.1.6.2. Products
- 12.1.6.3. Company Financials
- 12.1.6.4. SWOT Analysis
- 12.1.7 CropX
- 12.1.7.1. Company Overview
- 12.1.7.2. Products
- 12.1.7.3. Company Financials
- 12.1.7.4. SWOT Analysis
- 12.1.8 Arable
- 12.1.8.1. Company Overview
- 12.1.8.2. Products
- 12.1.8.3. Company Financials
- 12.1.8.4. SWOT Analysis
- 12.1.9 Farm21
- 12.1.9.1. Company Overview
- 12.1.9.2. Products
- 12.1.9.3. Company Financials
- 12.1.9.4. SWOT Analysis
- 12.1.10 Sensoterra
- 12.1.10.1. Company Overview
- 12.1.10.2. Products
- 12.1.10.3. Company Financials
- 12.1.10.4. SWOT Analysis
- 12.1.11 Soil Scout Ltd
- 12.1.11.1. Company Overview
- 12.1.11.2. Products
- 12.1.11.3. Company Financials
- 12.1.11.4. SWOT Analysis
- 12.1.12 Veris Technologies
- 12.1.12.1. Company Overview
- 12.1.12.2. Products
- 12.1.12.3. Company Financials
- 12.1.12.4. SWOT Analysis
- 12.1.13 Dacom
- 12.1.13.1. Company Overview
- 12.1.13.2. Products
- 12.1.13.3. Company Financials
- 12.1.13.4. SWOT Analysis
- 12.1.14 FunaPhotonics ApS
- 12.1.14.1. Company Overview
- 12.1.14.2. Products
- 12.1.14.3. Company Financials
- 12.1.14.4. SWOT Analysis
- 12.1.15 StyX Neutronica GmbH
- 12.1.15.1. Company Overview
- 12.1.15.2. Products
- 12.1.15.3. Company Financials
- 12.1.15.4. SWOT Analysis
- 12.1.16 DICKEY-john
- 12.1.16.1. Company Overview
- 12.1.16.2. Products
- 12.1.16.3. Company Financials
- 12.1.16.4. SWOT Analysis
- 12.1.17 GreenEye
- 12.1.17.1. Company Overview
- 12.1.17.2. Products
- 12.1.17.3. Company Financials
- 12.1.17.4. SWOT Analysis
- 12.1.18 Agricultural Engineering Associates
- 12.1.18.1. Company Overview
- 12.1.18.2. Products
- 12.1.18.3. Company Financials
- 12.1.18.4. SWOT Analysis
- 12.1.1 Rika
- 12.2. Market Entropy
- 12.2.1 Company's Key Areas Served
- 12.2.2 Recent Developments
- 12.3. Company Market Share Analysis 2025
- 12.3.1 Top 5 Companies Market Share Analysis
- 12.3.2 Top 3 Companies Market Share Analysis
- 12.4. List of Potential Customers
- 13. Research Methodology
List of Figures
- Figure 1: Global Agricultural Environmental Sensor Revenue Breakdown (billion, %) by Region 2025 & 2033
- Figure 2: Global Agricultural Environmental Sensor Volume Breakdown (K, %) by Region 2025 & 2033
- Figure 3: North America Agricultural Environmental Sensor Revenue (billion), by Application 2025 & 2033
- Figure 4: North America Agricultural Environmental Sensor Volume (K), by Application 2025 & 2033
- Figure 5: North America Agricultural Environmental Sensor Revenue Share (%), by Application 2025 & 2033
- Figure 6: North America Agricultural Environmental Sensor Volume Share (%), by Application 2025 & 2033
- Figure 7: North America Agricultural Environmental Sensor Revenue (billion), by Types 2025 & 2033
- Figure 8: North America Agricultural Environmental Sensor Volume (K), by Types 2025 & 2033
- Figure 9: North America Agricultural Environmental Sensor Revenue Share (%), by Types 2025 & 2033
- Figure 10: North America Agricultural Environmental Sensor Volume Share (%), by Types 2025 & 2033
- Figure 11: North America Agricultural Environmental Sensor Revenue (billion), by Country 2025 & 2033
- Figure 12: North America Agricultural Environmental Sensor Volume (K), by Country 2025 & 2033
- Figure 13: North America Agricultural Environmental Sensor Revenue Share (%), by Country 2025 & 2033
- Figure 14: North America Agricultural Environmental Sensor Volume Share (%), by Country 2025 & 2033
- Figure 15: South America Agricultural Environmental Sensor Revenue (billion), by Application 2025 & 2033
- Figure 16: South America Agricultural Environmental Sensor Volume (K), by Application 2025 & 2033
- Figure 17: South America Agricultural Environmental Sensor Revenue Share (%), by Application 2025 & 2033
- Figure 18: South America Agricultural Environmental Sensor Volume Share (%), by Application 2025 & 2033
- Figure 19: South America Agricultural Environmental Sensor Revenue (billion), by Types 2025 & 2033
- Figure 20: South America Agricultural Environmental Sensor Volume (K), by Types 2025 & 2033
- Figure 21: South America Agricultural Environmental Sensor Revenue Share (%), by Types 2025 & 2033
- Figure 22: South America Agricultural Environmental Sensor Volume Share (%), by Types 2025 & 2033
- Figure 23: South America Agricultural Environmental Sensor Revenue (billion), by Country 2025 & 2033
- Figure 24: South America Agricultural Environmental Sensor Volume (K), by Country 2025 & 2033
- Figure 25: South America Agricultural Environmental Sensor Revenue Share (%), by Country 2025 & 2033
- Figure 26: South America Agricultural Environmental Sensor Volume Share (%), by Country 2025 & 2033
- Figure 27: Europe Agricultural Environmental Sensor Revenue (billion), by Application 2025 & 2033
- Figure 28: Europe Agricultural Environmental Sensor Volume (K), by Application 2025 & 2033
- Figure 29: Europe Agricultural Environmental Sensor Revenue Share (%), by Application 2025 & 2033
- Figure 30: Europe Agricultural Environmental Sensor Volume Share (%), by Application 2025 & 2033
- Figure 31: Europe Agricultural Environmental Sensor Revenue (billion), by Types 2025 & 2033
- Figure 32: Europe Agricultural Environmental Sensor Volume (K), by Types 2025 & 2033
- Figure 33: Europe Agricultural Environmental Sensor Revenue Share (%), by Types 2025 & 2033
- Figure 34: Europe Agricultural Environmental Sensor Volume Share (%), by Types 2025 & 2033
- Figure 35: Europe Agricultural Environmental Sensor Revenue (billion), by Country 2025 & 2033
- Figure 36: Europe Agricultural Environmental Sensor Volume (K), by Country 2025 & 2033
- Figure 37: Europe Agricultural Environmental Sensor Revenue Share (%), by Country 2025 & 2033
- Figure 38: Europe Agricultural Environmental Sensor Volume Share (%), by Country 2025 & 2033
- Figure 39: Middle East & Africa Agricultural Environmental Sensor Revenue (billion), by Application 2025 & 2033
- Figure 40: Middle East & Africa Agricultural Environmental Sensor Volume (K), by Application 2025 & 2033
- Figure 41: Middle East & Africa Agricultural Environmental Sensor Revenue Share (%), by Application 2025 & 2033
- Figure 42: Middle East & Africa Agricultural Environmental Sensor Volume Share (%), by Application 2025 & 2033
- Figure 43: Middle East & Africa Agricultural Environmental Sensor Revenue (billion), by Types 2025 & 2033
- Figure 44: Middle East & Africa Agricultural Environmental Sensor Volume (K), by Types 2025 & 2033
- Figure 45: Middle East & Africa Agricultural Environmental Sensor Revenue Share (%), by Types 2025 & 2033
- Figure 46: Middle East & Africa Agricultural Environmental Sensor Volume Share (%), by Types 2025 & 2033
- Figure 47: Middle East & Africa Agricultural Environmental Sensor Revenue (billion), by Country 2025 & 2033
- Figure 48: Middle East & Africa Agricultural Environmental Sensor Volume (K), by Country 2025 & 2033
- Figure 49: Middle East & Africa Agricultural Environmental Sensor Revenue Share (%), by Country 2025 & 2033
- Figure 50: Middle East & Africa Agricultural Environmental Sensor Volume Share (%), by Country 2025 & 2033
- Figure 51: Asia Pacific Agricultural Environmental Sensor Revenue (billion), by Application 2025 & 2033
- Figure 52: Asia Pacific Agricultural Environmental Sensor Volume (K), by Application 2025 & 2033
- Figure 53: Asia Pacific Agricultural Environmental Sensor Revenue Share (%), by Application 2025 & 2033
- Figure 54: Asia Pacific Agricultural Environmental Sensor Volume Share (%), by Application 2025 & 2033
- Figure 55: Asia Pacific Agricultural Environmental Sensor Revenue (billion), by Types 2025 & 2033
- Figure 56: Asia Pacific Agricultural Environmental Sensor Volume (K), by Types 2025 & 2033
- Figure 57: Asia Pacific Agricultural Environmental Sensor Revenue Share (%), by Types 2025 & 2033
- Figure 58: Asia Pacific Agricultural Environmental Sensor Volume Share (%), by Types 2025 & 2033
- Figure 59: Asia Pacific Agricultural Environmental Sensor Revenue (billion), by Country 2025 & 2033
- Figure 60: Asia Pacific Agricultural Environmental Sensor Volume (K), by Country 2025 & 2033
- Figure 61: Asia Pacific Agricultural Environmental Sensor Revenue Share (%), by Country 2025 & 2033
- Figure 62: Asia Pacific Agricultural Environmental Sensor Volume Share (%), by Country 2025 & 2033
List of Tables
- Table 1: Global Agricultural Environmental Sensor Revenue billion Forecast, by Application 2020 & 2033
- Table 2: Global Agricultural Environmental Sensor Volume K Forecast, by Application 2020 & 2033
- Table 3: Global Agricultural Environmental Sensor Revenue billion Forecast, by Types 2020 & 2033
- Table 4: Global Agricultural Environmental Sensor Volume K Forecast, by Types 2020 & 2033
- Table 5: Global Agricultural Environmental Sensor Revenue billion Forecast, by Region 2020 & 2033
- Table 6: Global Agricultural Environmental Sensor Volume K Forecast, by Region 2020 & 2033
- Table 7: Global Agricultural Environmental Sensor Revenue billion Forecast, by Application 2020 & 2033
- Table 8: Global Agricultural Environmental Sensor Volume K Forecast, by Application 2020 & 2033
- Table 9: Global Agricultural Environmental Sensor Revenue billion Forecast, by Types 2020 & 2033
- Table 10: Global Agricultural Environmental Sensor Volume K Forecast, by Types 2020 & 2033
- Table 11: Global Agricultural Environmental Sensor Revenue billion Forecast, by Country 2020 & 2033
- Table 12: Global Agricultural Environmental Sensor Volume K Forecast, by Country 2020 & 2033
- Table 13: United States Agricultural Environmental Sensor Revenue (billion) Forecast, by Application 2020 & 2033
- Table 14: United States Agricultural Environmental Sensor Volume (K) Forecast, by Application 2020 & 2033
- Table 15: Canada Agricultural Environmental Sensor Revenue (billion) Forecast, by Application 2020 & 2033
- Table 16: Canada Agricultural Environmental Sensor Volume (K) Forecast, by Application 2020 & 2033
- Table 17: Mexico Agricultural Environmental Sensor Revenue (billion) Forecast, by Application 2020 & 2033
- Table 18: Mexico Agricultural Environmental Sensor Volume (K) Forecast, by Application 2020 & 2033
- Table 19: Global Agricultural Environmental Sensor Revenue billion Forecast, by Application 2020 & 2033
- Table 20: Global Agricultural Environmental Sensor Volume K Forecast, by Application 2020 & 2033
- Table 21: Global Agricultural Environmental Sensor Revenue billion Forecast, by Types 2020 & 2033
- Table 22: Global Agricultural Environmental Sensor Volume K Forecast, by Types 2020 & 2033
- Table 23: Global Agricultural Environmental Sensor Revenue billion Forecast, by Country 2020 & 2033
- Table 24: Global Agricultural Environmental Sensor Volume K Forecast, by Country 2020 & 2033
- Table 25: Brazil Agricultural Environmental Sensor Revenue (billion) Forecast, by Application 2020 & 2033
- Table 26: Brazil Agricultural Environmental Sensor Volume (K) Forecast, by Application 2020 & 2033
- Table 27: Argentina Agricultural Environmental Sensor Revenue (billion) Forecast, by Application 2020 & 2033
- Table 28: Argentina Agricultural Environmental Sensor Volume (K) Forecast, by Application 2020 & 2033
- Table 29: Rest of South America Agricultural Environmental Sensor Revenue (billion) Forecast, by Application 2020 & 2033
- Table 30: Rest of South America Agricultural Environmental Sensor Volume (K) Forecast, by Application 2020 & 2033
- Table 31: Global Agricultural Environmental Sensor Revenue billion Forecast, by Application 2020 & 2033
- Table 32: Global Agricultural Environmental Sensor Volume K Forecast, by Application 2020 & 2033
- Table 33: Global Agricultural Environmental Sensor Revenue billion Forecast, by Types 2020 & 2033
- Table 34: Global Agricultural Environmental Sensor Volume K Forecast, by Types 2020 & 2033
- Table 35: Global Agricultural Environmental Sensor Revenue billion Forecast, by Country 2020 & 2033
- Table 36: Global Agricultural Environmental Sensor Volume K Forecast, by Country 2020 & 2033
- Table 37: United Kingdom Agricultural Environmental Sensor Revenue (billion) Forecast, by Application 2020 & 2033
- Table 38: United Kingdom Agricultural Environmental Sensor Volume (K) Forecast, by Application 2020 & 2033
- Table 39: Germany Agricultural Environmental Sensor Revenue (billion) Forecast, by Application 2020 & 2033
- Table 40: Germany Agricultural Environmental Sensor Volume (K) Forecast, by Application 2020 & 2033
- Table 41: France Agricultural Environmental Sensor Revenue (billion) Forecast, by Application 2020 & 2033
- Table 42: France Agricultural Environmental Sensor Volume (K) Forecast, by Application 2020 & 2033
- Table 43: Italy Agricultural Environmental Sensor Revenue (billion) Forecast, by Application 2020 & 2033
- Table 44: Italy Agricultural Environmental Sensor Volume (K) Forecast, by Application 2020 & 2033
- Table 45: Spain Agricultural Environmental Sensor Revenue (billion) Forecast, by Application 2020 & 2033
- Table 46: Spain Agricultural Environmental Sensor Volume (K) Forecast, by Application 2020 & 2033
- Table 47: Russia Agricultural Environmental Sensor Revenue (billion) Forecast, by Application 2020 & 2033
- Table 48: Russia Agricultural Environmental Sensor Volume (K) Forecast, by Application 2020 & 2033
- Table 49: Benelux Agricultural Environmental Sensor Revenue (billion) Forecast, by Application 2020 & 2033
- Table 50: Benelux Agricultural Environmental Sensor Volume (K) Forecast, by Application 2020 & 2033
- Table 51: Nordics Agricultural Environmental Sensor Revenue (billion) Forecast, by Application 2020 & 2033
- Table 52: Nordics Agricultural Environmental Sensor Volume (K) Forecast, by Application 2020 & 2033
- Table 53: Rest of Europe Agricultural Environmental Sensor Revenue (billion) Forecast, by Application 2020 & 2033
- Table 54: Rest of Europe Agricultural Environmental Sensor Volume (K) Forecast, by Application 2020 & 2033
- Table 55: Global Agricultural Environmental Sensor Revenue billion Forecast, by Application 2020 & 2033
- Table 56: Global Agricultural Environmental Sensor Volume K Forecast, by Application 2020 & 2033
- Table 57: Global Agricultural Environmental Sensor Revenue billion Forecast, by Types 2020 & 2033
- Table 58: Global Agricultural Environmental Sensor Volume K Forecast, by Types 2020 & 2033
- Table 59: Global Agricultural Environmental Sensor Revenue billion Forecast, by Country 2020 & 2033
- Table 60: Global Agricultural Environmental Sensor Volume K Forecast, by Country 2020 & 2033
- Table 61: Turkey Agricultural Environmental Sensor Revenue (billion) Forecast, by Application 2020 & 2033
- Table 62: Turkey Agricultural Environmental Sensor Volume (K) Forecast, by Application 2020 & 2033
- Table 63: Israel Agricultural Environmental Sensor Revenue (billion) Forecast, by Application 2020 & 2033
- Table 64: Israel Agricultural Environmental Sensor Volume (K) Forecast, by Application 2020 & 2033
- Table 65: GCC Agricultural Environmental Sensor Revenue (billion) Forecast, by Application 2020 & 2033
- Table 66: GCC Agricultural Environmental Sensor Volume (K) Forecast, by Application 2020 & 2033
- Table 67: North Africa Agricultural Environmental Sensor Revenue (billion) Forecast, by Application 2020 & 2033
- Table 68: North Africa Agricultural Environmental Sensor Volume (K) Forecast, by Application 2020 & 2033
- Table 69: South Africa Agricultural Environmental Sensor Revenue (billion) Forecast, by Application 2020 & 2033
- Table 70: South Africa Agricultural Environmental Sensor Volume (K) Forecast, by Application 2020 & 2033
- Table 71: Rest of Middle East & Africa Agricultural Environmental Sensor Revenue (billion) Forecast, by Application 2020 & 2033
- Table 72: Rest of Middle East & Africa Agricultural Environmental Sensor Volume (K) Forecast, by Application 2020 & 2033
- Table 73: Global Agricultural Environmental Sensor Revenue billion Forecast, by Application 2020 & 2033
- Table 74: Global Agricultural Environmental Sensor Volume K Forecast, by Application 2020 & 2033
- Table 75: Global Agricultural Environmental Sensor Revenue billion Forecast, by Types 2020 & 2033
- Table 76: Global Agricultural Environmental Sensor Volume K Forecast, by Types 2020 & 2033
- Table 77: Global Agricultural Environmental Sensor Revenue billion Forecast, by Country 2020 & 2033
- Table 78: Global Agricultural Environmental Sensor Volume K Forecast, by Country 2020 & 2033
- Table 79: China Agricultural Environmental Sensor Revenue (billion) Forecast, by Application 2020 & 2033
- Table 80: China Agricultural Environmental Sensor Volume (K) Forecast, by Application 2020 & 2033
- Table 81: India Agricultural Environmental Sensor Revenue (billion) Forecast, by Application 2020 & 2033
- Table 82: India Agricultural Environmental Sensor Volume (K) Forecast, by Application 2020 & 2033
- Table 83: Japan Agricultural Environmental Sensor Revenue (billion) Forecast, by Application 2020 & 2033
- Table 84: Japan Agricultural Environmental Sensor Volume (K) Forecast, by Application 2020 & 2033
- Table 85: South Korea Agricultural Environmental Sensor Revenue (billion) Forecast, by Application 2020 & 2033
- Table 86: South Korea Agricultural Environmental Sensor Volume (K) Forecast, by Application 2020 & 2033
- Table 87: ASEAN Agricultural Environmental Sensor Revenue (billion) Forecast, by Application 2020 & 2033
- Table 88: ASEAN Agricultural Environmental Sensor Volume (K) Forecast, by Application 2020 & 2033
- Table 89: Oceania Agricultural Environmental Sensor Revenue (billion) Forecast, by Application 2020 & 2033
- Table 90: Oceania Agricultural Environmental Sensor Volume (K) Forecast, by Application 2020 & 2033
- Table 91: Rest of Asia Pacific Agricultural Environmental Sensor Revenue (billion) Forecast, by Application 2020 & 2033
- Table 92: Rest of Asia Pacific Agricultural Environmental Sensor Volume (K) Forecast, by Application 2020 & 2033
Frequently Asked Questions
1. What is the projected Compound Annual Growth Rate (CAGR) of the Agricultural Environmental Sensor?
The projected CAGR is approximately 9.9%.
2. Which companies are prominent players in the Agricultural Environmental Sensor?
Key companies in the market include Rika, Hindawi, AKVA Group, Ecomatik, Spezia Srl, Murata, CropX, Arable, Farm21, Sensoterra, Soil Scout Ltd, Veris Technologies, Dacom, FunaPhotonics ApS, StyX Neutronica GmbH, DICKEY-john, GreenEye, Agricultural Engineering Associates.
3. What are the main segments of the Agricultural Environmental Sensor?
The market segments include Application, Types.
4. Can you provide details about the market size?
The market size is estimated to be USD 4.81 billion as of 2022.
5. What are some drivers contributing to market growth?
N/A
6. What are the notable trends driving market growth?
N/A
7. Are there any restraints impacting market growth?
N/A
8. Can you provide examples of recent developments in the market?
N/A
9. What pricing options are available for accessing the report?
Pricing options include single-user, multi-user, and enterprise licenses priced at USD 3950.00, USD 5925.00, and USD 7900.00 respectively.
10. Is the market size provided in terms of value or volume?
The market size is provided in terms of value, measured in billion and volume, measured in K.
11. Are there any specific market keywords associated with the report?
Yes, the market keyword associated with the report is "Agricultural Environmental Sensor," which aids in identifying and referencing the specific market segment covered.
12. How do I determine which pricing option suits my needs best?
The pricing options vary based on user requirements and access needs. Individual users may opt for single-user licenses, while businesses requiring broader access may choose multi-user or enterprise licenses for cost-effective access to the report.
13. Are there any additional resources or data provided in the Agricultural Environmental Sensor report?
While the report offers comprehensive insights, it's advisable to review the specific contents or supplementary materials provided to ascertain if additional resources or data are available.
14. How can I stay updated on further developments or reports in the Agricultural Environmental Sensor?
To stay informed about further developments, trends, and reports in the Agricultural Environmental Sensor, consider subscribing to industry newsletters, following relevant companies and organizations, or regularly checking reputable industry news sources and publications.
Methodology
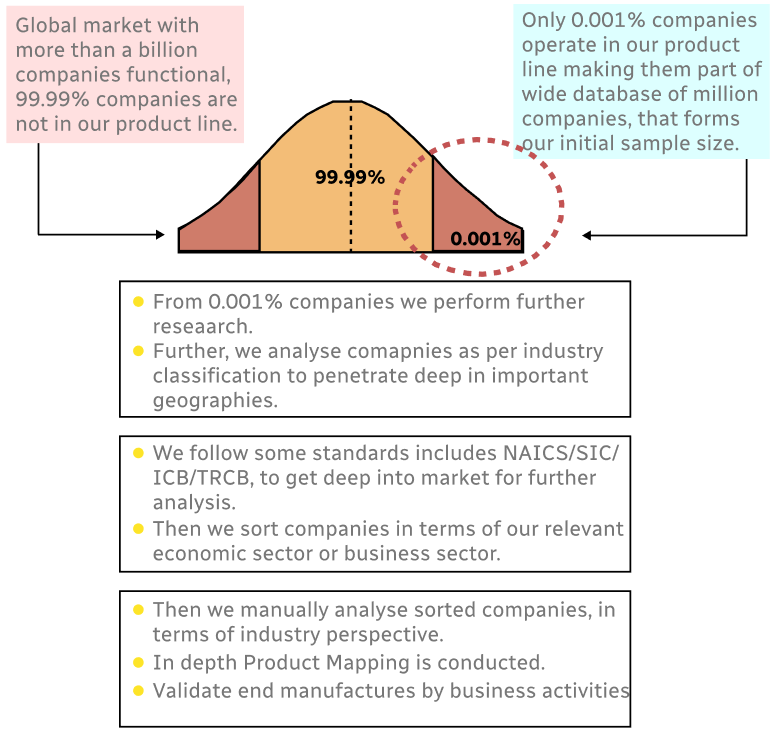
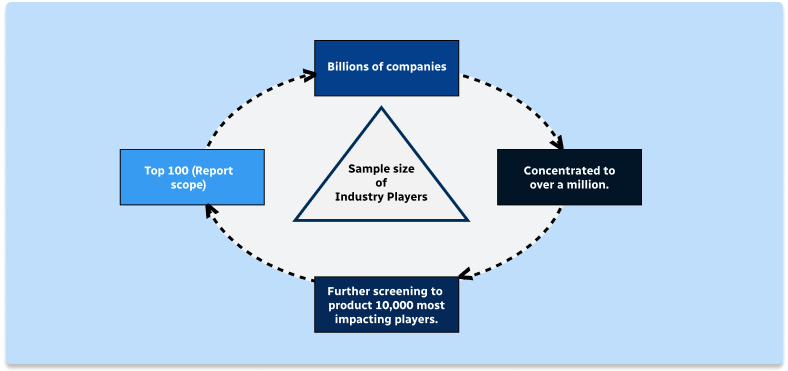
Step 1 - Identification of Relevant Samples Size from Population Database
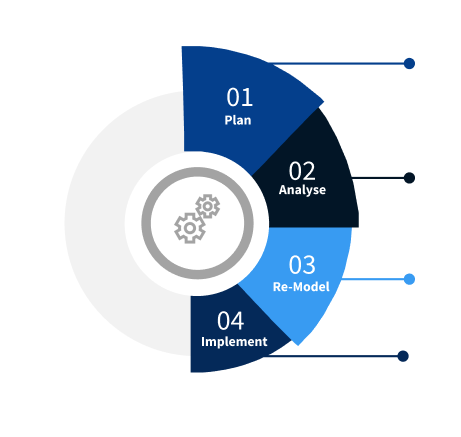
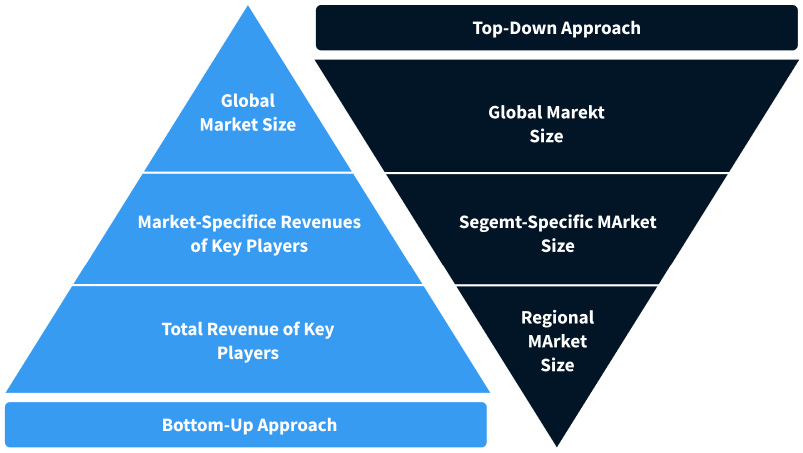
Step 2 - Approaches for Defining Global Market Size (Value, Volume* & Price*)
Note*: In applicable scenarios
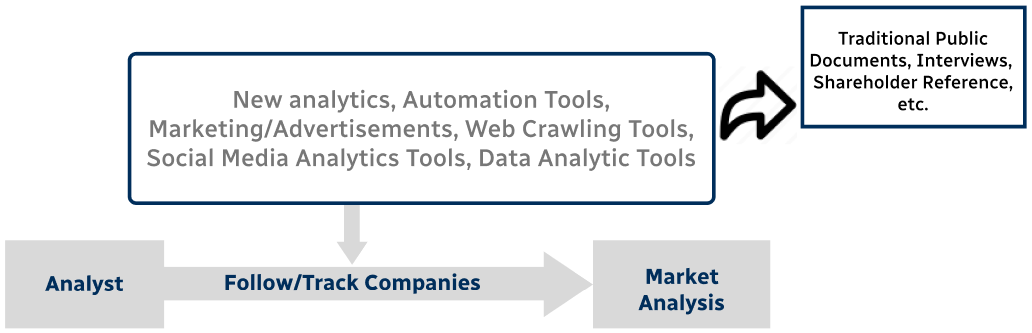
Step 3 - Data Sources
Primary Research
- Web Analytics
- Survey Reports
- Research Institute
- Latest Research Reports
- Opinion Leaders
Secondary Research
- Annual Reports
- White Paper
- Latest Press Release
- Industry Association
- Paid Database
- Investor Presentations
Step 4 - Data Triangulation
Involves using different sources of information in order to increase the validity of a study
These sources are likely to be stakeholders in a program - participants, other researchers, program staff, other community members, and so on.
Then we put all data in single framework & apply various statistical tools to find out the dynamic on the market.
During the analysis stage, feedback from the stakeholder groups would be compared to determine areas of agreement as well as areas of divergence