

Key Insights
The Augmented Analytics market is poised for explosive growth, with a projected market size of USD 23.27 billion and an impressive Compound Annual Growth Rate (CAGR) of 28.09% during the forecast period of 2025-2033. This surge is primarily driven by the increasing need for businesses to extract actionable insights from vast datasets with enhanced speed and accuracy. Key market drivers include the proliferation of big data, the growing adoption of artificial intelligence (AI) and machine learning (ML) across industries, and the demand for self-service analytics solutions that empower non-technical users. The continuous evolution of AI and ML capabilities, coupled with advancements in natural language processing (NLP) and natural language generation (NLG), are further fueling this market expansion. Organizations are increasingly recognizing the competitive advantage offered by augmented analytics in areas such as predictive modeling, anomaly detection, and automated report generation, leading to significant investment in these technologies.
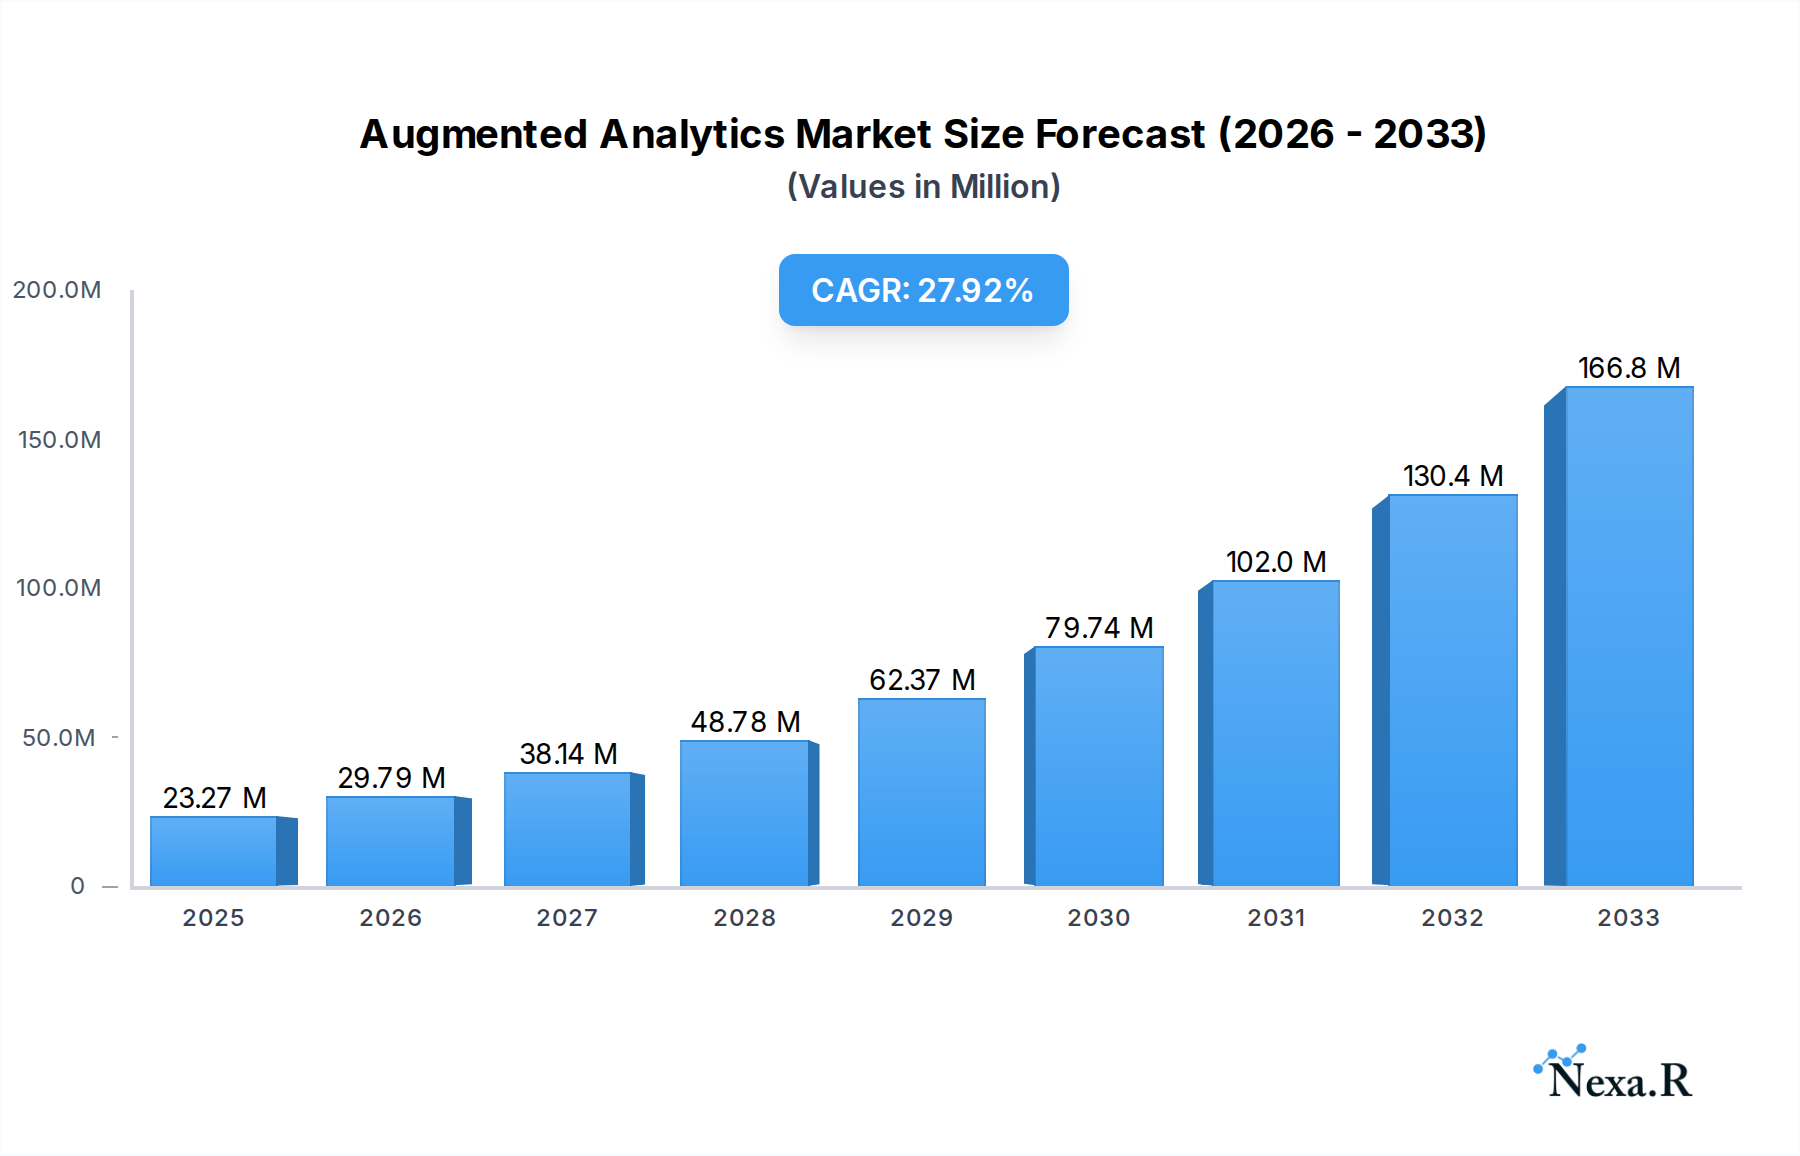
Augmented Analytics Market Market Size (In Million)
The augmented analytics landscape is characterized by a dynamic interplay of trends and challenges. Key trends include the integration of augmented analytics into existing business intelligence (BI) platforms, the rise of AI-powered data preparation and visualization, and the growing focus on ethical AI and data governance within augmented analytics solutions. While the benefits are substantial, the market also faces certain restraints. These include the complexity of integrating augmented analytics into legacy systems, the shortage of skilled data scientists and analysts capable of leveraging these advanced tools, and concerns surrounding data privacy and security. Nevertheless, the overwhelming advantages in terms of efficiency, accuracy, and democratized data access are expected to outweigh these challenges, propelling the market forward. The market segmentation reveals a strong preference for cloud-based deployments, catering to the agility and scalability demands of modern enterprises. Furthermore, the BFSI, Telecom & IT, and Retail sectors are leading the adoption, leveraging augmented analytics for enhanced customer understanding, risk management, and operational optimization.

Augmented Analytics Market Company Market Share
Augmented Analytics Market Report: Unlocking Data-Driven Insights and Business Transformation
This comprehensive Augmented Analytics Market report delves into the dynamic landscape of intelligent data analysis solutions, providing an in-depth analysis of market trends, growth drivers, and future opportunities from 2019 to 2033. The report focuses on the burgeoning demand for advanced analytics that leverage AI and machine learning to automate data preparation, discovery, and insight generation, empowering businesses across all sectors to make faster, more informed decisions. Explore the intricate dynamics of this rapidly evolving market, uncovering key strategies and technologies that are shaping the future of business intelligence and data science.
Augmented Analytics Market Market Dynamics & Structure
The augmented analytics market is characterized by intense technological innovation, a highly competitive landscape, and evolving regulatory frameworks. Market concentration is moderately fragmented, with key players investing heavily in AI and machine learning capabilities to differentiate their offerings. Technological innovation is primarily driven by advancements in natural language processing (NLP), automated machine learning (AutoML), and predictive modeling, all crucial for enhancing the user experience and democratizing data analysis. Regulatory frameworks, particularly concerning data privacy and security, are increasingly influencing market development, pushing for robust governance and ethical AI practices. Competitive product substitutes include traditional business intelligence tools and manual data analysis methods, but augmented analytics offers a significant leap in efficiency and insight depth. End-user demographics are broadening, with an increasing adoption across diverse industries, including BFSI, Telecom & IT, Retail, Healthcare, and Manufacturing, as organizations recognize the strategic imperative of data-driven decision-making. Mergers and acquisitions (M&A) trends are active, with larger tech companies acquiring specialized augmented analytics startups to enhance their product portfolios and expand their market reach. For instance, recent M&A activities indicate a surge in acquiring companies with strong AI/ML expertise.
- Market Concentration: Moderately fragmented with a growing dominance of cloud-native solutions.
- Technological Innovation Drivers: NLP, AutoML, explainable AI (XAI), and real-time data processing.
- Regulatory Frameworks: GDPR, CCPA, and industry-specific data governance mandates.
- Competitive Product Substitutes: Traditional BI tools, spreadsheets, and manual data exploration.
- End-User Demographics: Expansion across SMBs and enterprises in BFSI, Telecom, Retail, Healthcare, Manufacturing, and Media & Entertainment.
- M&A Trends: Strategic acquisitions for AI/ML capabilities and market expansion.
Augmented Analytics Market Growth Trends & Insights
The augmented analytics market size is poised for substantial growth, driven by the pervasive need for businesses to extract actionable insights from ever-increasing volumes of data. Market adoption rates are accelerating as organizations shift from reactive reporting to proactive, predictive analytics. Technological disruptions, such as the maturation of AI algorithms and the development of user-friendly interfaces, are making augmented analytics accessible to a wider range of users, including business analysts and domain experts. Consumer behavior shifts towards data-informed strategies are further fueling demand, as companies aim to personalize customer experiences, optimize operations, and identify new market opportunities. The global augmented analytics market is projected to witness a Compound Annual Growth Rate (CAGR) of approximately xx% during the forecast period of 2025–2033. Market penetration is expected to deepen across all end-user industries, with cloud deployments becoming the dominant preference due to scalability and cost-effectiveness. The integration of augmented analytics into existing enterprise resource planning (ERP) and customer relationship management (CRM) systems is a significant trend, embedding intelligent insights directly into daily workflows. The evolution of data visualization techniques, powered by augmented analytics, is also enhancing user engagement and the ability to communicate complex findings effectively. Furthermore, the increasing availability of pre-trained AI models and APIs is lowering the barrier to entry for many organizations, enabling them to leverage advanced analytical capabilities without extensive in-house expertise. The competitive landscape is evolving with a focus on industry-specific solutions and enhanced explainability of AI-driven insights, addressing concerns about "black box" algorithms.
Dominant Regions, Countries, or Segments in Augmented Analytics Market
The cloud deployment segment is anticipated to be the dominant force driving growth in the augmented analytics market. This dominance stems from the inherent scalability, flexibility, and cost-effectiveness offered by cloud platforms, which align perfectly with the dynamic needs of businesses seeking to leverage advanced analytics. Cloud-based solutions enable organizations to deploy and scale augmented analytics capabilities rapidly without significant upfront investments in hardware infrastructure.
- North America is expected to emerge as a leading region, driven by its strong technological infrastructure, high adoption of advanced technologies, and a significant presence of key market players. The region's mature digital economy and a strong focus on data-driven innovation foster a fertile ground for augmented analytics.
- Within end-user industries, the BFSI (Banking, Financial Services, and Insurance) sector is projected to exhibit the most robust growth. This is attributed to the sector's critical need for risk management, fraud detection, customer segmentation, and personalized financial product offerings. Augmented analytics enables BFSI institutions to derive deeper insights from vast datasets, enhancing operational efficiency and improving customer satisfaction.
- Telecom & IT is another significant growth driver, as these industries grapple with massive data volumes from network operations, customer interactions, and service usage. Augmented analytics helps optimize network performance, predict customer churn, and personalize service offerings.
Key Drivers of Dominance:
- Technological Advancement: Proliferation of AI and ML capabilities, enhanced cloud infrastructure.
- Economic Policies: Government initiatives promoting digital transformation and innovation.
- Infrastructure: Advanced digital infrastructure and high internet penetration rates.
- Industry-Specific Demand: Critical need for data-driven insights in BFSI, Telecom & IT, and Healthcare for competitive advantage.
Augmented Analytics Market Product Landscape
The augmented analytics market is characterized by continuous product innovation focused on democratizing data analysis and enhancing user experience. Key product advancements include the integration of natural language processing (NLP) for intuitive querying, automated feature engineering, and intelligent anomaly detection. These innovations enable users to discover insights faster and with less technical expertise. Performance metrics are increasingly defined by the speed of insight generation, the accuracy of predictions, and the ease of integration with existing data ecosystems. Unique selling propositions revolve around providing actionable intelligence rather than just raw data, with a focus on explainable AI to build trust and transparency. The application landscape spans business performance monitoring, customer churn prediction, risk assessment, fraud detection, and personalized marketing campaigns.
Key Drivers, Barriers & Challenges in Augmented Analytics Market
Key Drivers:
The augmented analytics market is propelled by several key drivers: the exponential growth of data, the increasing demand for faster and more accurate decision-making, and the need for advanced analytical capabilities to gain a competitive edge. Technological advancements in AI and machine learning, coupled with the growing adoption of cloud computing, further accelerate market growth. The drive for digital transformation across industries is a significant catalyst, pushing organizations to leverage data for strategic advantage.
- Data Proliferation: The continuous generation of vast datasets across all industries.
- Demand for Actionable Insights: Businesses need to move beyond raw data to actionable intelligence for improved decision-making.
- Competitive Pressures: The need to outperform competitors through data-driven strategies.
- Technological Advancements: Maturation of AI, ML, and NLP technologies.
- Cloud Adoption: Increased accessibility and scalability of analytical tools via the cloud.
Barriers & Challenges:
Despite its strong growth trajectory, the augmented analytics market faces several barriers and challenges. Data quality and integration issues remain significant hurdles, as poor data can lead to flawed insights. The scarcity of skilled data scientists and analysts capable of effectively utilizing these advanced tools poses a challenge. Moreover, concerns around data privacy, security, and the ethical implications of AI can create resistance to adoption. The high cost of implementation and ongoing maintenance for some advanced solutions can also be a deterrent for smaller organizations.
- Data Quality and Integration: Inconsistent or incomplete data can hinder the effectiveness of augmented analytics.
- Talent Gap: Shortage of skilled professionals to leverage and manage advanced analytical tools.
- Data Privacy and Security Concerns: Ensuring compliance with regulations and protecting sensitive data.
- Implementation Costs: Initial investment and ongoing maintenance expenses can be substantial.
- Resistance to Change: Overcoming organizational inertia and fostering a data-driven culture.
- Explainability of AI: Addressing the "black box" nature of some AI algorithms and building trust.
Emerging Opportunities in Augmented Analytics Market
Emerging opportunities in the augmented analytics market lie in the untapped potential of niche industries, the development of more sophisticated explainable AI (XAI) capabilities, and the increasing demand for industry-specific augmented analytics solutions. The growing adoption of the Internet of Things (IoT) is generating massive amounts of real-time data, creating a significant opportunity for augmented analytics to provide instant operational intelligence. Furthermore, the personalization trend across various sectors, from e-commerce to healthcare, is driving the need for hyper-personalized insights derived from individual customer data. The integration of augmented analytics with other emerging technologies like blockchain for data provenance and security also presents a novel avenue for growth.
Growth Accelerators in the Augmented Analytics Market Industry
Catalysts driving long-term growth in the augmented analytics market industry are manifold. Technological breakthroughs in AI, particularly in areas like deep learning and reinforcement learning, will enable more sophisticated predictive and prescriptive analytics. Strategic partnerships between augmented analytics providers and cloud infrastructure giants will expand market reach and accessibility. Furthermore, a growing emphasis on data literacy and democratization across organizations will empower a broader user base to leverage these powerful tools, thereby accelerating adoption and driving market expansion. The development of industry-specific augmented analytics platforms tailored to the unique needs of sectors like manufacturing, healthcare, and retail will further unlock growth potential.
Key Players Shaping the Augmented Analytics Market Market
- SAS Institute Inc
- TIBCO Software Inc
- IBM Corporation
- ThoughtSpot Inc
- GoodData Corporation
- Microsoft Corporation
- QlikTech International AB
- Sisense Inc
- SAP SE
- MicroStrategy Inc
- Salesforce com inc
Notable Milestones in Augmented Analytics Market Sector
- May 2023: TrinityLife Sciences partnered with WhizAI to enable life sciences companies to quickly generate and share AI-driven insights via augmented analytics on enterprise reporting platforms.
- January 2023: Seerist Inc. enhanced its augmented analytics solution for threat and security professionals with new capabilities for contextual intelligence and data "noise" extraction.
In-Depth Augmented Analytics Market Market Outlook
The augmented analytics market is set for an upward trajectory, fueled by the persistent need for intelligent data interpretation and accelerated decision-making. Growth accelerators such as the continuous advancements in AI and machine learning algorithms, coupled with the widespread adoption of cloud-based infrastructure, are creating a highly conducive environment for market expansion. The increasing focus on data democratization and the development of user-friendly interfaces will empower a broader spectrum of business users, driving wider adoption. Emerging opportunities in niche industries and the demand for specialized, industry-tailored augmented analytics solutions will further bolster the market's potential. Strategic collaborations and the continuous innovation in predictive and prescriptive analytics capabilities will solidify augmented analytics as an indispensable tool for businesses aiming to thrive in the data-driven era.
Augmented Analytics Market Segmentation
-
1. Deployment
- 1.1. On-premise
- 1.2. Cloud
-
2. End-user Industry
- 2.1. BFSI
- 2.2. Telecom & IT
- 2.3. Retail
- 2.4. Healthcare
- 2.5. Manufacturing
- 2.6. Media & Entertainment
- 2.7. Other End-user Industries
Augmented Analytics Market Segmentation By Geography
- 1. North America
- 2. Europe
- 3. Asia Pacific
- 4. Rest of the World
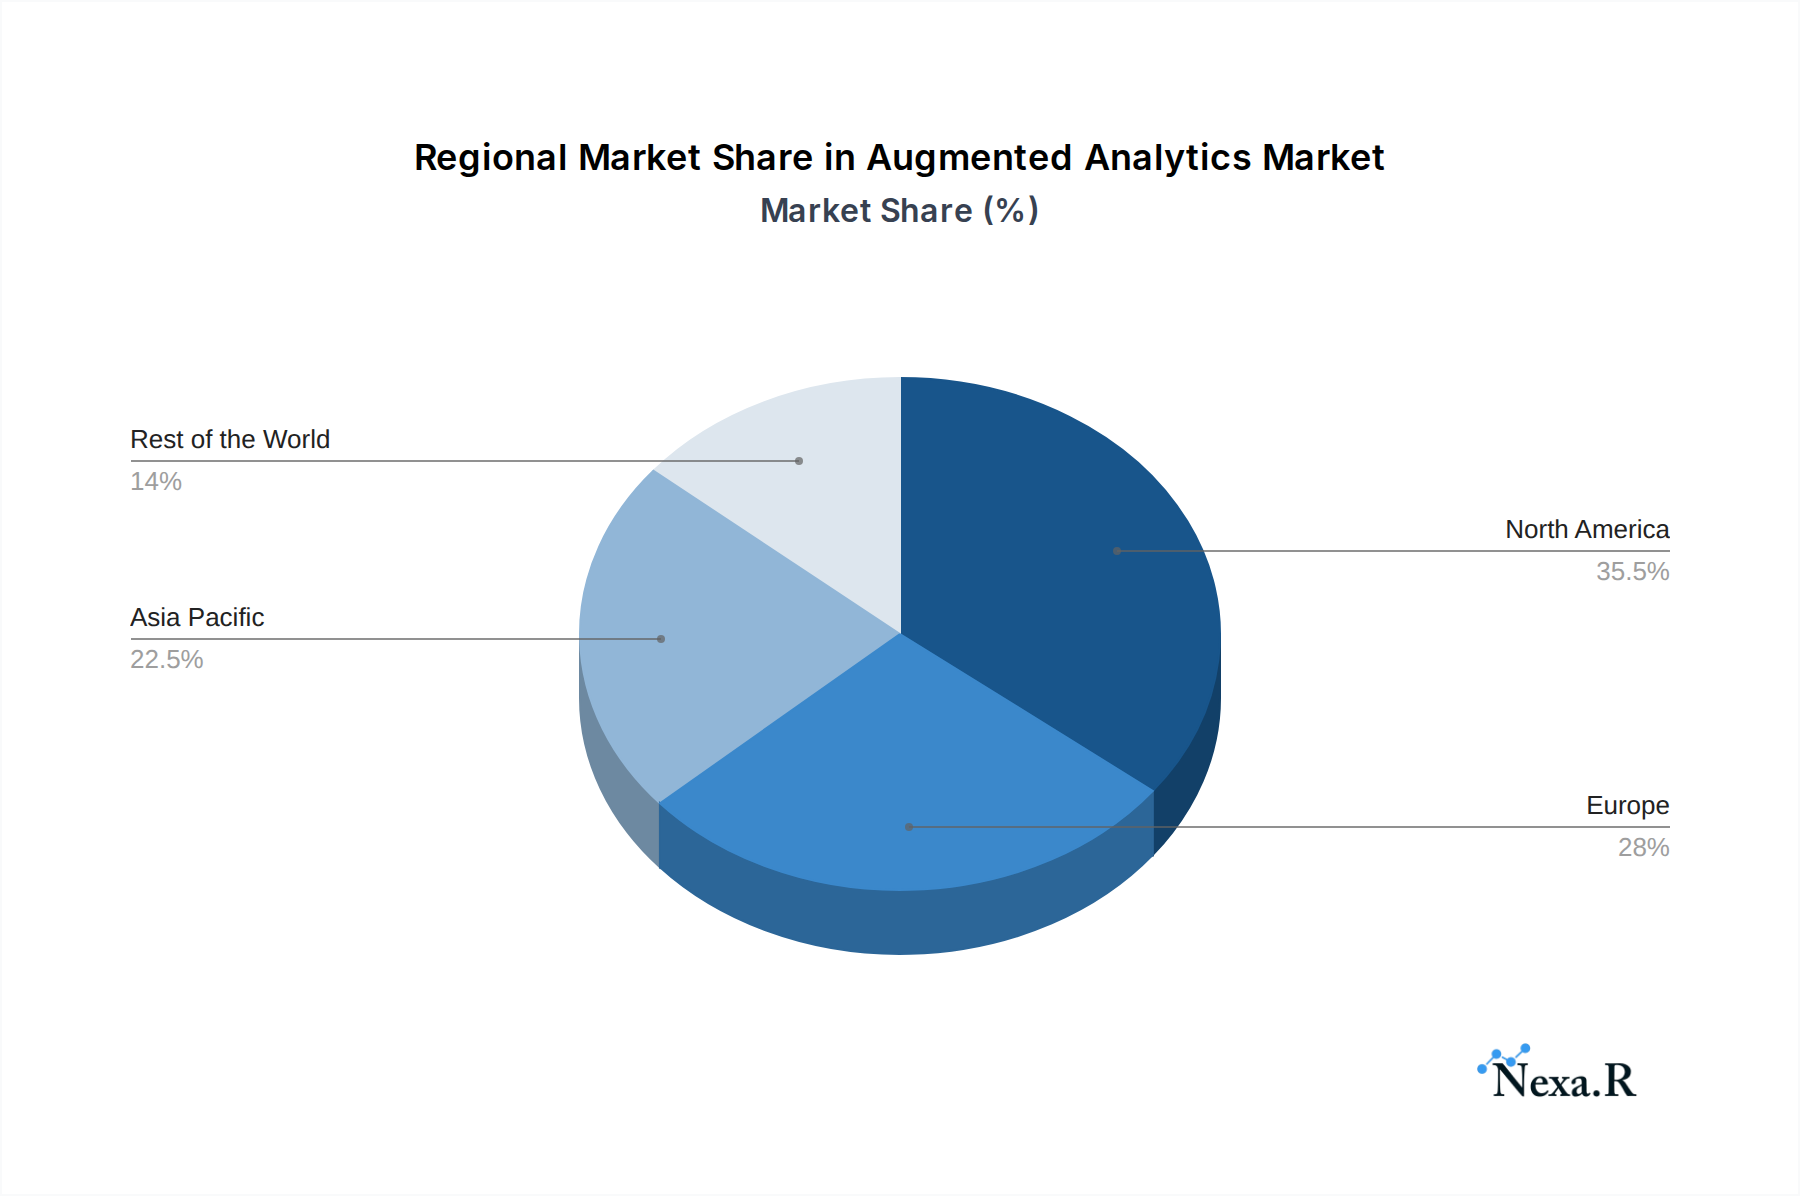
Augmented Analytics Market Regional Market Share
Geographic Coverage of Augmented Analytics Market
Augmented Analytics Market REPORT HIGHLIGHTS
| Aspects | Details |
|---|---|
| Study Period | 2020-2034 |
| Base Year | 2025 |
| Estimated Year | 2026 |
| Forecast Period | 2026-2034 |
| Historical Period | 2020-2025 |
| Growth Rate | CAGR of 28.09% from 2020-2034 |
| Segmentation |
|
Table of Contents
- 1. Introduction
- 1.1. Research Scope
- 1.2. Market Segmentation
- 1.3. Research Objective
- 1.4. Definitions and Assumptions
- 2. Executive Summary
- 2.1. Market Snapshot
- 3. Market Dynamics
- 3.1. Market Drivers
- 3.2. Market Restrains
- 3.3. Market Trends
- 3.4. Market Opportunities
- 4. Market Factor Analysis
- 4.1. Porters Five Forces
- 4.1.1. Bargaining Power of Suppliers
- 4.1.2. Bargaining Power of Buyers
- 4.1.3. Threat of New Entrants
- 4.1.4. Threat of Substitutes
- 4.1.5. Competitive Rivalry
- 4.2. PESTEL analysis
- 4.3. BCG Analysis
- 4.3.1. Stars (High Growth, High Market Share)
- 4.3.2. Cash Cows (Low Growth, High Market Share)
- 4.3.3. Question Mark (High Growth, Low Market Share)
- 4.3.4. Dogs (Low Growth, Low Market Share)
- 4.4. Ansoff Matrix Analysis
- 4.5. Supply Chain Analysis
- 4.6. Regulatory Landscape
- 4.7. Current Market Potential and Opportunity Assessment (TAM–SAM–SOM Framework)
- 4.8. NRP Analyst Note
- 4.1. Porters Five Forces
- 5. Market Analysis, Insights and Forecast 2021-2033
- 5.1. Market Analysis, Insights and Forecast - by Deployment
- 5.1.1. On-premise
- 5.1.2. Cloud
- 5.2. Market Analysis, Insights and Forecast - by End-user Industry
- 5.2.1. BFSI
- 5.2.2. Telecom & IT
- 5.2.3. Retail
- 5.2.4. Healthcare
- 5.2.5. Manufacturing
- 5.2.6. Media & Entertainment
- 5.2.7. Other End-user Industries
- 5.3. Market Analysis, Insights and Forecast - by Region
- 5.3.1. North America
- 5.3.2. Europe
- 5.3.3. Asia Pacific
- 5.3.4. Rest of the World
- 5.1. Market Analysis, Insights and Forecast - by Deployment
- 6. Global Augmented Analytics Market Analysis, Insights and Forecast, 2021-2033
- 6.1. Market Analysis, Insights and Forecast - by Deployment
- 6.1.1. On-premise
- 6.1.2. Cloud
- 6.2. Market Analysis, Insights and Forecast - by End-user Industry
- 6.2.1. BFSI
- 6.2.2. Telecom & IT
- 6.2.3. Retail
- 6.2.4. Healthcare
- 6.2.5. Manufacturing
- 6.2.6. Media & Entertainment
- 6.2.7. Other End-user Industries
- 6.1. Market Analysis, Insights and Forecast - by Deployment
- 7. North America Augmented Analytics Market Analysis, Insights and Forecast, 2020-2032
- 7.1. Market Analysis, Insights and Forecast - by Deployment
- 7.1.1. On-premise
- 7.1.2. Cloud
- 7.2. Market Analysis, Insights and Forecast - by End-user Industry
- 7.2.1. BFSI
- 7.2.2. Telecom & IT
- 7.2.3. Retail
- 7.2.4. Healthcare
- 7.2.5. Manufacturing
- 7.2.6. Media & Entertainment
- 7.2.7. Other End-user Industries
- 7.1. Market Analysis, Insights and Forecast - by Deployment
- 8. Europe Augmented Analytics Market Analysis, Insights and Forecast, 2020-2032
- 8.1. Market Analysis, Insights and Forecast - by Deployment
- 8.1.1. On-premise
- 8.1.2. Cloud
- 8.2. Market Analysis, Insights and Forecast - by End-user Industry
- 8.2.1. BFSI
- 8.2.2. Telecom & IT
- 8.2.3. Retail
- 8.2.4. Healthcare
- 8.2.5. Manufacturing
- 8.2.6. Media & Entertainment
- 8.2.7. Other End-user Industries
- 8.1. Market Analysis, Insights and Forecast - by Deployment
- 9. Asia Pacific Augmented Analytics Market Analysis, Insights and Forecast, 2020-2032
- 9.1. Market Analysis, Insights and Forecast - by Deployment
- 9.1.1. On-premise
- 9.1.2. Cloud
- 9.2. Market Analysis, Insights and Forecast - by End-user Industry
- 9.2.1. BFSI
- 9.2.2. Telecom & IT
- 9.2.3. Retail
- 9.2.4. Healthcare
- 9.2.5. Manufacturing
- 9.2.6. Media & Entertainment
- 9.2.7. Other End-user Industries
- 9.1. Market Analysis, Insights and Forecast - by Deployment
- 10. Rest of the World Augmented Analytics Market Analysis, Insights and Forecast, 2020-2032
- 10.1. Market Analysis, Insights and Forecast - by Deployment
- 10.1.1. On-premise
- 10.1.2. Cloud
- 10.2. Market Analysis, Insights and Forecast - by End-user Industry
- 10.2.1. BFSI
- 10.2.2. Telecom & IT
- 10.2.3. Retail
- 10.2.4. Healthcare
- 10.2.5. Manufacturing
- 10.2.6. Media & Entertainment
- 10.2.7. Other End-user Industries
- 10.1. Market Analysis, Insights and Forecast - by Deployment
- 11. Competitive Analysis
- 11.1. Company Profiles
- 11.1.1 SAS Institute Inc
- 11.1.1.1. Company Overview
- 11.1.1.2. Products
- 11.1.1.3. Company Financials
- 11.1.1.4. SWOT Analysis
- 11.1.2 TIBCO Software Inc
- 11.1.2.1. Company Overview
- 11.1.2.2. Products
- 11.1.2.3. Company Financials
- 11.1.2.4. SWOT Analysis
- 11.1.3 IBM Corporation
- 11.1.3.1. Company Overview
- 11.1.3.2. Products
- 11.1.3.3. Company Financials
- 11.1.3.4. SWOT Analysis
- 11.1.4 ThoughtSpot Inc
- 11.1.4.1. Company Overview
- 11.1.4.2. Products
- 11.1.4.3. Company Financials
- 11.1.4.4. SWOT Analysis
- 11.1.5 GoodData Corporation*List Not Exhaustive
- 11.1.5.1. Company Overview
- 11.1.5.2. Products
- 11.1.5.3. Company Financials
- 11.1.5.4. SWOT Analysis
- 11.1.6 Microsoft Corporation
- 11.1.6.1. Company Overview
- 11.1.6.2. Products
- 11.1.6.3. Company Financials
- 11.1.6.4. SWOT Analysis
- 11.1.7 QlikTech International AB
- 11.1.7.1. Company Overview
- 11.1.7.2. Products
- 11.1.7.3. Company Financials
- 11.1.7.4. SWOT Analysis
- 11.1.8 Sisense Inc
- 11.1.8.1. Company Overview
- 11.1.8.2. Products
- 11.1.8.3. Company Financials
- 11.1.8.4. SWOT Analysis
- 11.1.9 SAP SE
- 11.1.9.1. Company Overview
- 11.1.9.2. Products
- 11.1.9.3. Company Financials
- 11.1.9.4. SWOT Analysis
- 11.1.10 MicroStrategy Inc
- 11.1.10.1. Company Overview
- 11.1.10.2. Products
- 11.1.10.3. Company Financials
- 11.1.10.4. SWOT Analysis
- 11.1.11 Salesforce com inc
- 11.1.11.1. Company Overview
- 11.1.11.2. Products
- 11.1.11.3. Company Financials
- 11.1.11.4. SWOT Analysis
- 11.1.1 SAS Institute Inc
- 11.2. Market Entropy
- 11.2.1 Company's Key Areas Served
- 11.2.2 Recent Developments
- 11.3. Company Market Share Analysis 2025
- 11.3.1 Top 5 Companies Market Share Analysis
- 11.3.2 Top 3 Companies Market Share Analysis
- 11.4. List of Potential Customers
- 12. Research Methodology
List of Figures
- Figure 1: Global Augmented Analytics Market Revenue Breakdown (Million, %) by Region 2025 & 2033
- Figure 2: North America Augmented Analytics Market Revenue (Million), by Deployment 2025 & 2033
- Figure 3: North America Augmented Analytics Market Revenue Share (%), by Deployment 2025 & 2033
- Figure 4: North America Augmented Analytics Market Revenue (Million), by End-user Industry 2025 & 2033
- Figure 5: North America Augmented Analytics Market Revenue Share (%), by End-user Industry 2025 & 2033
- Figure 6: North America Augmented Analytics Market Revenue (Million), by Country 2025 & 2033
- Figure 7: North America Augmented Analytics Market Revenue Share (%), by Country 2025 & 2033
- Figure 8: Europe Augmented Analytics Market Revenue (Million), by Deployment 2025 & 2033
- Figure 9: Europe Augmented Analytics Market Revenue Share (%), by Deployment 2025 & 2033
- Figure 10: Europe Augmented Analytics Market Revenue (Million), by End-user Industry 2025 & 2033
- Figure 11: Europe Augmented Analytics Market Revenue Share (%), by End-user Industry 2025 & 2033
- Figure 12: Europe Augmented Analytics Market Revenue (Million), by Country 2025 & 2033
- Figure 13: Europe Augmented Analytics Market Revenue Share (%), by Country 2025 & 2033
- Figure 14: Asia Pacific Augmented Analytics Market Revenue (Million), by Deployment 2025 & 2033
- Figure 15: Asia Pacific Augmented Analytics Market Revenue Share (%), by Deployment 2025 & 2033
- Figure 16: Asia Pacific Augmented Analytics Market Revenue (Million), by End-user Industry 2025 & 2033
- Figure 17: Asia Pacific Augmented Analytics Market Revenue Share (%), by End-user Industry 2025 & 2033
- Figure 18: Asia Pacific Augmented Analytics Market Revenue (Million), by Country 2025 & 2033
- Figure 19: Asia Pacific Augmented Analytics Market Revenue Share (%), by Country 2025 & 2033
- Figure 20: Rest of the World Augmented Analytics Market Revenue (Million), by Deployment 2025 & 2033
- Figure 21: Rest of the World Augmented Analytics Market Revenue Share (%), by Deployment 2025 & 2033
- Figure 22: Rest of the World Augmented Analytics Market Revenue (Million), by End-user Industry 2025 & 2033
- Figure 23: Rest of the World Augmented Analytics Market Revenue Share (%), by End-user Industry 2025 & 2033
- Figure 24: Rest of the World Augmented Analytics Market Revenue (Million), by Country 2025 & 2033
- Figure 25: Rest of the World Augmented Analytics Market Revenue Share (%), by Country 2025 & 2033
List of Tables
- Table 1: Global Augmented Analytics Market Revenue Million Forecast, by Deployment 2020 & 2033
- Table 2: Global Augmented Analytics Market Revenue Million Forecast, by End-user Industry 2020 & 2033
- Table 3: Global Augmented Analytics Market Revenue Million Forecast, by Region 2020 & 2033
- Table 4: Global Augmented Analytics Market Revenue Million Forecast, by Deployment 2020 & 2033
- Table 5: Global Augmented Analytics Market Revenue Million Forecast, by End-user Industry 2020 & 2033
- Table 6: Global Augmented Analytics Market Revenue Million Forecast, by Country 2020 & 2033
- Table 7: Global Augmented Analytics Market Revenue Million Forecast, by Deployment 2020 & 2033
- Table 8: Global Augmented Analytics Market Revenue Million Forecast, by End-user Industry 2020 & 2033
- Table 9: Global Augmented Analytics Market Revenue Million Forecast, by Country 2020 & 2033
- Table 10: Global Augmented Analytics Market Revenue Million Forecast, by Deployment 2020 & 2033
- Table 11: Global Augmented Analytics Market Revenue Million Forecast, by End-user Industry 2020 & 2033
- Table 12: Global Augmented Analytics Market Revenue Million Forecast, by Country 2020 & 2033
- Table 13: Global Augmented Analytics Market Revenue Million Forecast, by Deployment 2020 & 2033
- Table 14: Global Augmented Analytics Market Revenue Million Forecast, by End-user Industry 2020 & 2033
- Table 15: Global Augmented Analytics Market Revenue Million Forecast, by Country 2020 & 2033
Frequently Asked Questions
1. What is the projected Compound Annual Growth Rate (CAGR) of the Augmented Analytics Market?
The projected CAGR is approximately 28.09%.
2. Which companies are prominent players in the Augmented Analytics Market?
Key companies in the market include SAS Institute Inc, TIBCO Software Inc, IBM Corporation, ThoughtSpot Inc, GoodData Corporation*List Not Exhaustive, Microsoft Corporation, QlikTech International AB, Sisense Inc, SAP SE, MicroStrategy Inc, Salesforce com inc.
3. What are the main segments of the Augmented Analytics Market?
The market segments include Deployment, End-user Industry.
4. Can you provide details about the market size?
The market size is estimated to be USD 23.27 Million as of 2022.
5. What are some drivers contributing to market growth?
Increasing Demand to Cater Complex Business Data; Huge Adoption of Business Intelligence Tools.
6. What are the notable trends driving market growth?
Retail Sector is Expected to Have a Significant Growth During the Forecast Period.
7. Are there any restraints impacting market growth?
Resistance Due to Replacement of Human Intelligence.
8. Can you provide examples of recent developments in the market?
May 2023: TrinityLife Sciences, a leader in global life sciences commercialization solutions, and WhizAI, a leader in AI-powered analytics for life sciences and healthcare, announced a strategic partnership that allows life sciences companies to quickly and easily generate and share AI-driven insights. WhizAI’s augmented analytics can be layered on Trinity’s enterprise reporting platforms to bring insights to more organizational stakeholders.
9. What pricing options are available for accessing the report?
Pricing options include single-user, multi-user, and enterprise licenses priced at USD 4750, USD 5250, and USD 8750 respectively.
10. Is the market size provided in terms of value or volume?
The market size is provided in terms of value, measured in Million.
11. Are there any specific market keywords associated with the report?
Yes, the market keyword associated with the report is "Augmented Analytics Market," which aids in identifying and referencing the specific market segment covered.
12. How do I determine which pricing option suits my needs best?
The pricing options vary based on user requirements and access needs. Individual users may opt for single-user licenses, while businesses requiring broader access may choose multi-user or enterprise licenses for cost-effective access to the report.
13. Are there any additional resources or data provided in the Augmented Analytics Market report?
While the report offers comprehensive insights, it's advisable to review the specific contents or supplementary materials provided to ascertain if additional resources or data are available.
14. How can I stay updated on further developments or reports in the Augmented Analytics Market?
To stay informed about further developments, trends, and reports in the Augmented Analytics Market, consider subscribing to industry newsletters, following relevant companies and organizations, or regularly checking reputable industry news sources and publications.
Methodology
Step 1 - Identification of Relevant Samples Size from Population Database


Step 2 - Approaches for Defining Global Market Size (Value, Volume* & Price*)

Note*: In applicable scenarios
Step 3 - Data Sources
Primary Research
- Web Analytics
- Survey Reports
- Research Institute
- Latest Research Reports
- Opinion Leaders
Secondary Research
- Annual Reports
- White Paper
- Latest Press Release
- Industry Association
- Paid Database
- Investor Presentations

Step 4 - Data Triangulation
Involves using different sources of information in order to increase the validity of a study
These sources are likely to be stakeholders in a program - participants, other researchers, program staff, other community members, and so on.
Then we put all data in single framework & apply various statistical tools to find out the dynamic on the market.
During the analysis stage, feedback from the stakeholder groups would be compared to determine areas of agreement as well as areas of divergence