

Key Insights
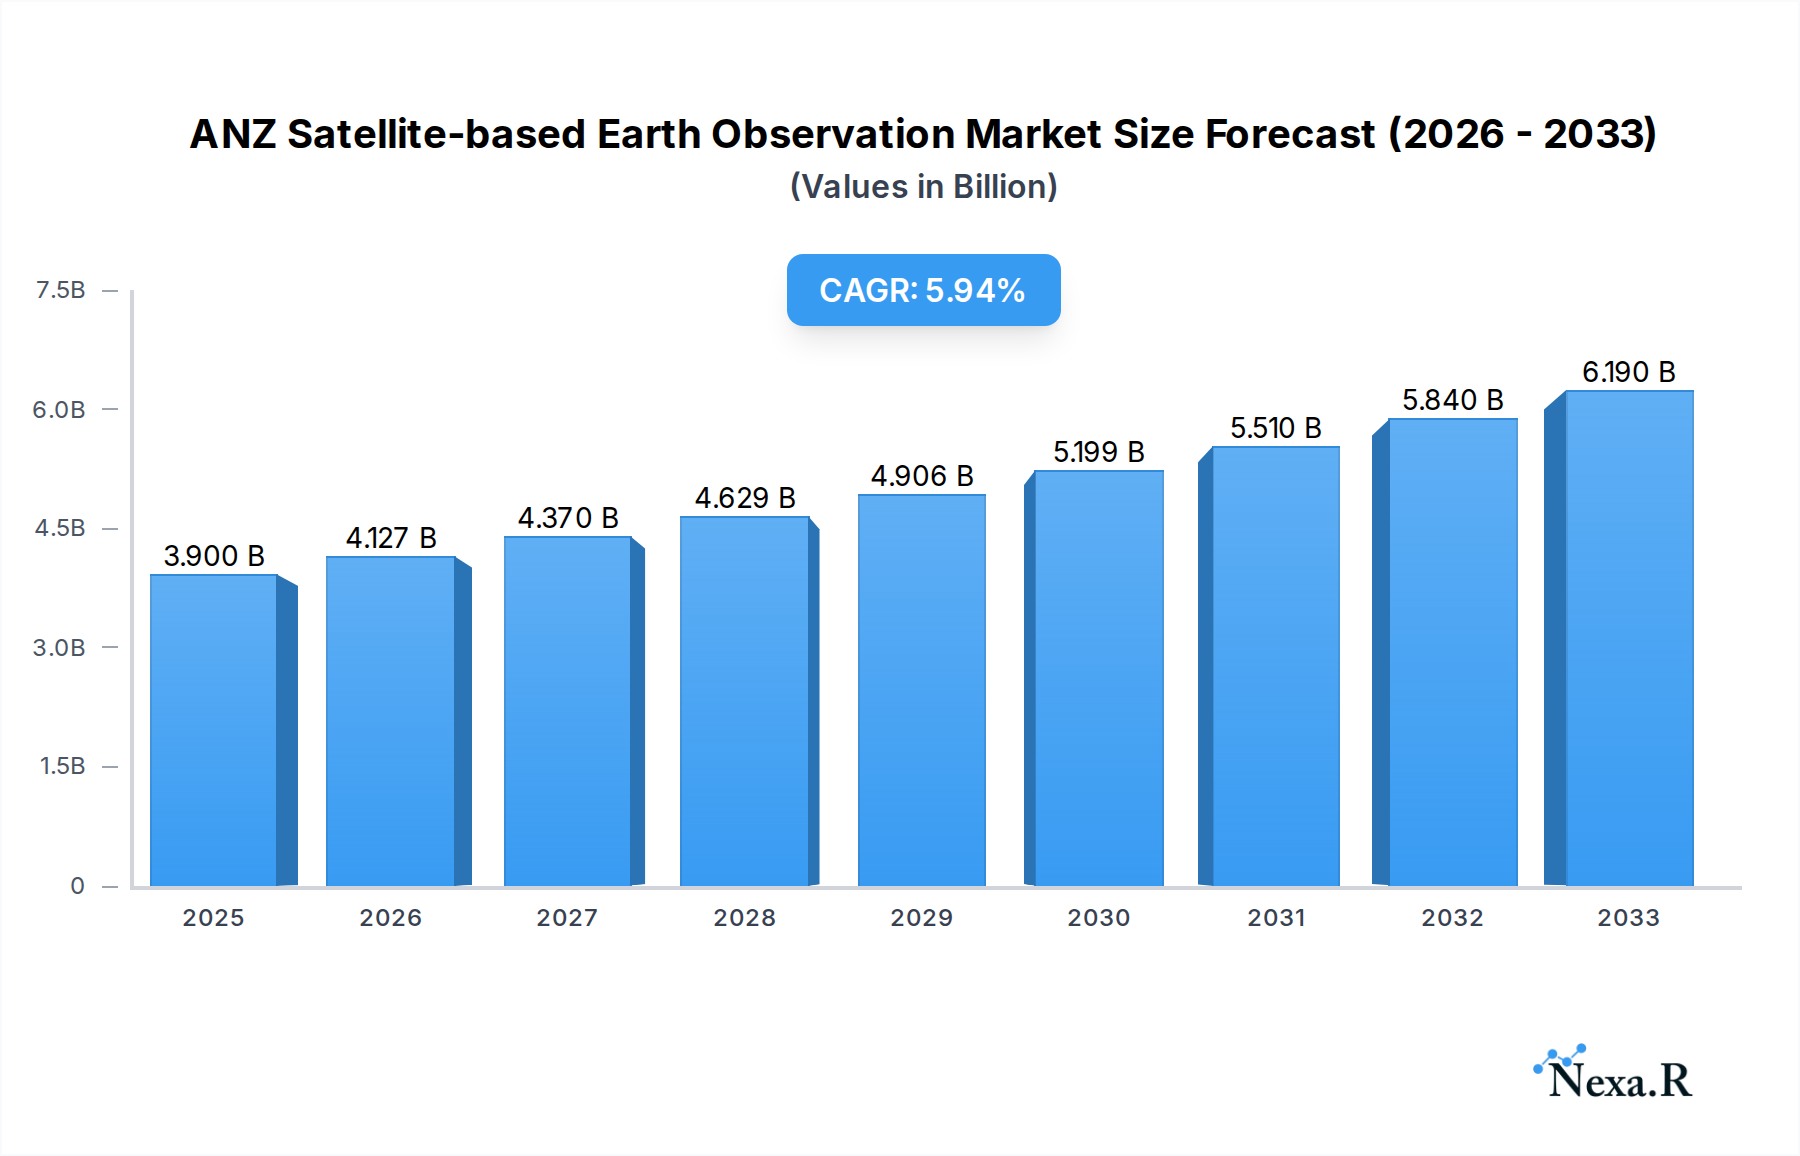
The ANZ Satellite-based Earth Observation Market is poised for significant expansion, projected to reach an estimated USD 3.9 billion in 2025. This growth is fueled by increasing demand across diverse sectors, including urban development, agriculture, climate services, and infrastructure. The market is expected to witness a robust Compound Annual Growth Rate (CAGR) of 5.9% from 2025 to 2033, indicating sustained momentum and evolving market dynamics. Key drivers of this expansion include advancements in satellite technology, leading to higher resolution imagery and more frequent data acquisition, alongside the growing need for actionable insights derived from Earth observation data. Furthermore, the increasing adoption of value-added services, which transform raw satellite data into specialized applications, is a critical factor propelling market growth. Companies are investing in sophisticated analytical tools and platforms to extract maximum value from this data, catering to the specific needs of end-users.

ANZ Satellite-based Earth Observation Market Market Size (In Billion)
The market's trajectory is also shaped by several key trends. The proliferation of Low Earth Orbit (LEO) satellites is enhancing revisit capabilities and data timeliness, crucial for dynamic applications. Geostationary Orbit (GEO) satellites continue to provide essential continuous monitoring for broad-scale phenomena. The integration of artificial intelligence (AI) and machine learning (ML) is revolutionizing data processing and analysis, enabling automated feature extraction and predictive modeling. While the market presents substantial opportunities, restraints such as data accessibility challenges and the high cost of initial satellite deployment and ground infrastructure can pose hurdles. However, the continuous innovation in data analytics and the growing awareness of Earth observation's utility in addressing critical global challenges, such as climate change adaptation and sustainable resource management, are expected to outweigh these limitations, ensuring a dynamic and thriving ANZ Satellite-based Earth Observation Market.
ANZ Satellite-based Earth Observation Market Company Market Share
ANZ Satellite-based Earth Observation Market: Comprehensive Market Analysis & Future Outlook (2019-2033)
This in-depth report provides a definitive analysis of the ANZ Satellite-based Earth Observation Market, delving into market dynamics, growth trends, dominant segments, and key players. With a forecast period extending to 2033, this study is crucial for understanding the evolving landscape of satellite data and value-added services across Australia and New Zealand, encompassing critical end-use industries such as Agriculture, Climate Services, and Infrastructure. Our analysis leverages high-traffic keywords to ensure maximum visibility and engagement for industry professionals seeking strategic insights into this rapidly expanding sector. The report examines parent and child market dynamics, offering a holistic view of the ecosystem.
ANZ Satellite-based Earth Observation Market Market Dynamics & Structure
The ANZ Satellite-based Earth Observation Market exhibits a dynamic and evolving structure characterized by a growing number of innovative companies and increasing adoption of space-based technologies. Market concentration is moderately fragmented, with both established global players and agile local startups vying for market share. Technological innovation is a primary driver, fueled by advancements in sensor technology, AI-driven data analytics, and miniaturized satellite systems. Regulatory frameworks, while developing, are becoming more supportive of space initiatives in the region, encouraging investment and innovation. Competitive product substitutes, such as aerial imagery and ground-based sensors, are present but increasingly challenged by the scalability and comprehensive coverage offered by satellite Earth Observation (EO). End-user demographics are expanding beyond traditional government agencies to include a diverse range of commercial enterprises. Mergers and acquisitions (M&A) are expected to play a significant role in consolidating the market and accelerating growth.
- Market Concentration: Moderately fragmented with a mix of established global providers and emerging regional players.
- Technological Innovation Drivers: Advances in AI/ML for data processing, high-resolution imaging, satellite constellation development, and cloud-based platforms.
- Regulatory Frameworks: Evolving government policies supporting space infrastructure, data access, and commercialization initiatives in Australia and New Zealand.
- Competitive Product Substitutes: Aerial photography, drone-based surveying, and ground-based sensor networks, offering localized data but lacking broad-scale coverage.
- End-User Demographics: Expanding from government and defense to include agriculture, mining, urban planning, insurance, and environmental monitoring sectors.
- M&A Trends: Anticipated increase in strategic partnerships and acquisitions to gain market share, access new technologies, and expand service offerings.
ANZ Satellite-based Earth Observation Market Growth Trends & Insights
The ANZ Satellite-based Earth Observation Market is poised for significant expansion, driven by increasing demand for actionable insights derived from satellite data. The market size is projected to witness robust growth, with a compound annual growth rate (CAGR) estimated at 18.5% during the forecast period of 2025–2033. This growth trajectory is underpinned by rising adoption rates across various industries, facilitated by greater accessibility to EO data and increasingly sophisticated value-added services. Technological disruptions, such as the proliferation of small satellite constellations and enhanced data processing capabilities, are fundamentally reshaping how businesses and governments utilize geospatial information. Consumer behavior is shifting towards proactive decision-making informed by real-time or near-real-time Earth observation data, leading to a surge in demand for predictive analytics and monitoring solutions.
The market's evolution is marked by a transition from raw data provision to integrated, application-specific solutions. The base year of 2025 is expected to see a market value of approximately $3.8 billion, with projections indicating a substantial increase to over $10.5 billion by 2033. This growth is fueled by the increasing realization of the economic and societal benefits of satellite EO, including improved resource management, enhanced disaster response, and more efficient infrastructure development. The penetration of satellite-based solutions is deepening across both developed and developing sectors within Australia and New Zealand. For instance, the agriculture sector is leveraging EO for precision farming, optimizing crop yields and minimizing resource waste, while climate services are relying on it for accurate climate modeling and impact assessment. The energy and raw materials sector benefits from detailed geological surveys and environmental monitoring. Infrastructure development utilizes satellite data for planning, construction oversight, and maintenance. The "Others" segment, encompassing areas like urban development and cultural heritage, also presents substantial growth opportunities as stakeholders recognize the value of detailed geospatial intelligence. The increasing availability of high-resolution imagery and advanced analytical tools is democratizing access to this powerful technology, allowing smaller businesses and specialized organizations to benefit.
Dominant Regions, Countries, or Segments in ANZ Satellite-based Earth Observation Market
Australia stands as the dominant country within the ANZ Satellite-based Earth Observation Market, driven by its vast landmass, diverse environmental challenges, and a rapidly growing national space industry. Its economic policies actively encourage investment in space technologies, and significant investments in infrastructure and resource management necessitate advanced geospatial solutions. New Zealand, while smaller in scale, also contributes significantly, with a strong focus on environmental monitoring, agriculture, and disaster management.
Within the market segments, Earth Observation Data is currently the largest segment, forming the foundational layer for most applications. However, the Value Added Services segment is experiencing the most rapid growth. This indicates a shift towards sophisticated data analysis, interpretation, and application-specific solutions that transform raw imagery into actionable intelligence. Companies like Critchlow Geospatial, Geoimage Australia, and Spiral Blue are at the forefront of developing these value-added services.
Considering satellite orbits, Low Earth Orbit (LEO) satellites are becoming increasingly dominant due to their ability to provide higher resolution imagery and more frequent revisit times, crucial for applications requiring real-time or near-real-time data. LEO constellations operated by companies like Airbus SE and potentially future ventures by entities like Rocket Lab Australia are crucial. Medium Earth Orbit (MEO) and Geostationary Orbit (GEO) satellites continue to play vital roles, particularly for navigation and broader weather monitoring, respectively.
The End-use segments driving market growth are multifaceted:
- Agriculture: Precision farming, crop health monitoring, yield prediction, and soil analysis are critical applications, significantly boosted by satellite EO. Companies like Arlula Pty Ltd are enabling wider access to this data for agricultural users.
- Climate Services: Monitoring deforestation, ice melt, sea-level rise, and extreme weather events is essential for understanding and mitigating climate change impacts. Geoscience Australia plays a key role in this domain.
- Infrastructure: Planning, construction, and maintenance of roads, railways, utilities, and urban environments benefit immensely from detailed satellite imagery and change detection.
- Energy and Raw Materials: Exploration, resource mapping, environmental impact assessment, and operational monitoring in the mining and energy sectors are heavily reliant on satellite EO.
The interplay of these segments, coupled with supportive government initiatives and private sector investment, underscores the dynamic growth potential of the ANZ Satellite-based Earth Observation Market.
ANZ Satellite-based Earth Observation Market Product Landscape
The product landscape in the ANZ Satellite-based Earth Observation Market is characterized by innovation in high-resolution optical and radar imagery, alongside advanced data analytics platforms. Companies are increasingly offering integrated solutions that combine raw data with sophisticated processing capabilities, machine learning algorithms, and application-specific dashboards. Unique selling propositions often lie in the frequency of data acquisition, the level of detail in imagery, and the ease of access to insights. For instance, Arlula Pty Ltd focuses on democratizing access to EO data for a wider range of users, while Spiral Blue is developing AI-powered insights for various industries. Technological advancements are enabling real-time anomaly detection, change monitoring, and predictive modeling, transforming raw satellite feeds into actionable intelligence for urban development, agriculture, climate services, and infrastructure management.
Key Drivers, Barriers & Challenges in ANZ Satellite-based Earth Observation Market
Key Drivers:
- Technological Advancements: Miniaturization of satellites, improved sensor resolution, and AI/ML for data analysis are making EO more accessible and powerful.
- Increasing Demand for Data-Driven Decisions: Industries across the ANZ region are recognizing the value of geospatial intelligence for efficiency, risk management, and sustainability.
- Government Support and Initiatives: National space agencies and favorable policies are fostering innovation and investment in the sector.
- Environmental Monitoring Needs: Growing concerns about climate change, natural resource management, and disaster preparedness are driving demand for satellite EO.
- Cost Reduction: The decreasing cost of satellite launches and data acquisition is broadening market accessibility.
Barriers & Challenges:
- Data Interpretation Expertise: A shortage of skilled professionals capable of interpreting and applying complex satellite data remains a challenge.
- High Initial Investment: While costs are decreasing, the initial investment for certain advanced EO solutions can still be prohibitive for some smaller businesses.
- Data Integration Complexity: Integrating satellite data with existing enterprise systems can be technically challenging and time-consuming.
- Regulatory Hurdles: While improving, evolving regulations and data sharing protocols can sometimes create complexities.
- Competition from Alternative Technologies: Ground-based and drone-based solutions offer niche advantages that can sometimes compete with satellite-based offerings.
- Cloud Cover Limitations: Optical satellite imagery can be affected by cloud cover, necessitating the use of radar or multi-spectral approaches.
Emerging Opportunities in the ANZ Satellite-based Earth Observation Market
Emerging opportunities in the ANZ Satellite-based Earth Observation Market lie in the expansion of AI-powered analytics for predictive modeling, particularly in agriculture and climate change adaptation. The growing demand for hyper-localised environmental monitoring and sustainable resource management presents untapped markets. Furthermore, the integration of satellite data with other IoT devices and big data platforms is creating new avenues for comprehensive situational awareness. The development of specialized EO applications for niche sectors like cultural heritage preservation and urban planning is also a significant growth area. The increasing focus on space-based defense and security applications within Australia and New Zealand also represents a burgeoning opportunity.
Growth Accelerators in the ANZ Satellite-based Earth Observation Market Industry
The ANZ Satellite-based Earth Observation Market is propelled by several key growth accelerators. Technological breakthroughs in satellite design, such as constellation scaling and advanced sensor capabilities, are continuously enhancing data quality and accessibility. Strategic partnerships between satellite operators, data providers, and end-users are crucial for developing tailored solutions and fostering wider adoption. Market expansion strategies, including the development of user-friendly platforms and the provision of comprehensive training, are making EO technology more accessible to a broader audience. The increasing global focus on climate action and sustainable development further fuels the demand for the insights provided by satellite Earth Observation. Investment from venture capital firms and government grants, as evidenced by Arlula's recent funding round, acts as a significant catalyst for innovation and market growth.
Key Players Shaping the ANZ Satellite-based Earth Observation Market Market
- Spiral Blue
- Critchlow Geospatial
- Lockheed Martin Corporation
- Airbus SE
- Arlula Pty Ltd
- Geoscience Australia
- NEC Corporation
- Maitec
- Go2Q Pty Ltd
- LatConnect60 Pty Ltd
- Geoimage Australia
Notable Milestones in ANZ Satellite-based Earth Observation Market Sector
- March 2023: Rocket Lab USA, Inc announced the establishment of Rocket Lab Australia, signaling a commitment to supporting the expansion of Australia's national space capabilities and highlighting the market growth potential for satellite-based Earth Observation.
- May 2023: Australian space tech startup Arlula announced it had raised USD 1.5 million from Main Sequence, Australia's deep tech investment fund founded by CSIRO, to expand access to Earth Observation (EO) data and imagery, enabling broader utilization by individuals, small businesses, and large enterprises.
In-Depth ANZ Satellite-based Earth Observation Market Market Outlook
The future outlook for the ANZ Satellite-based Earth Observation Market is exceptionally promising, driven by sustained technological innovation and an ever-increasing demand for data-driven decision-making. Growth accelerators, including the expansion of LEO satellite constellations, advancements in AI for geospatial analytics, and a growing ecosystem of value-added service providers, will continue to fuel market expansion. Strategic partnerships and collaborations will be pivotal in unlocking new applications and driving market penetration across diverse sectors. The increasing awareness of climate change impacts and the imperative for sustainable resource management will create sustained demand for satellite EO solutions. Future market potential is significant, with a focus on developing highly specialized applications and democratizing access to advanced geospatial intelligence for a wider range of stakeholders.
ANZ Satellite-based Earth Observation Market Segmentation
-
1. Type
- 1.1. Earth Observation Data
- 1.2. Value Added Services
-
2. Satellite Orbit
- 2.1. Low Earth Orbit
- 2.2. Medium Earth Orbit
- 2.3. Geostationary Orbit
-
3. End-use
- 3.1. Urban Development and Cultural Heritage
- 3.2. Agriculture
- 3.3. Climate Services
- 3.4. Energy and Raw Materials
- 3.5. Infrastructure
- 3.6. Others
ANZ Satellite-based Earth Observation Market Segmentation By Geography
-
1. North America
- 1.1. United States
- 1.2. Canada
- 1.3. Mexico
-
2. South America
- 2.1. Brazil
- 2.2. Argentina
- 2.3. Rest of South America
-
3. Europe
- 3.1. United Kingdom
- 3.2. Germany
- 3.3. France
- 3.4. Italy
- 3.5. Spain
- 3.6. Russia
- 3.7. Benelux
- 3.8. Nordics
- 3.9. Rest of Europe
-
4. Middle East & Africa
- 4.1. Turkey
- 4.2. Israel
- 4.3. GCC
- 4.4. North Africa
- 4.5. South Africa
- 4.6. Rest of Middle East & Africa
-
5. Asia Pacific
- 5.1. China
- 5.2. India
- 5.3. Japan
- 5.4. South Korea
- 5.5. ASEAN
- 5.6. Oceania
- 5.7. Rest of Asia Pacific
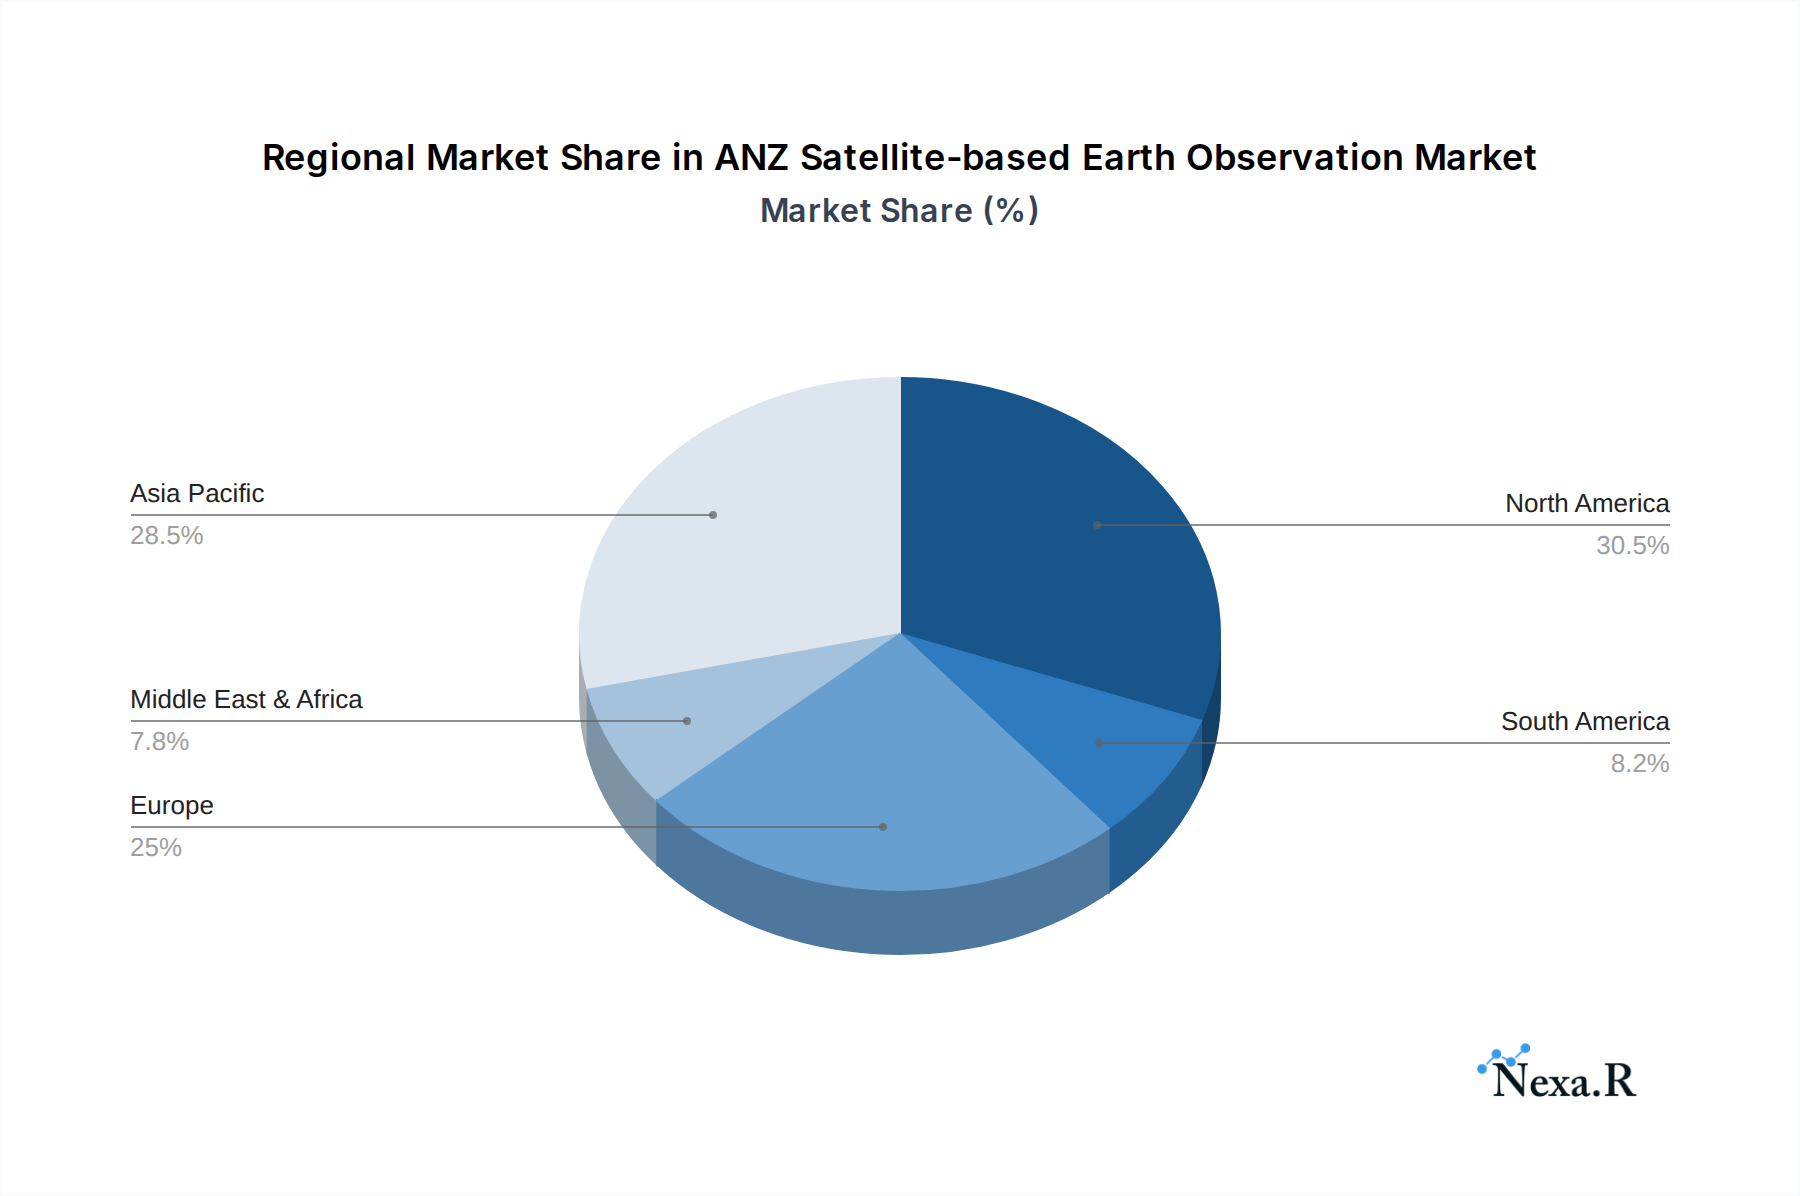
ANZ Satellite-based Earth Observation Market Regional Market Share
Geographic Coverage of ANZ Satellite-based Earth Observation Market
ANZ Satellite-based Earth Observation Market REPORT HIGHLIGHTS
| Aspects | Details |
|---|---|
| Study Period | 2020-2034 |
| Base Year | 2025 |
| Estimated Year | 2026 |
| Forecast Period | 2026-2034 |
| Historical Period | 2020-2025 |
| Growth Rate | CAGR of 5.9% from 2020-2034 |
| Segmentation |
|
Table of Contents
- 1. Introduction
- 1.1. Research Scope
- 1.2. Market Segmentation
- 1.3. Research Objective
- 1.4. Definitions and Assumptions
- 2. Executive Summary
- 2.1. Market Snapshot
- 3. Market Dynamics
- 3.1. Market Drivers
- 3.2. Market Restrains
- 3.3. Market Trends
- 3.4. Market Opportunities
- 4. Market Factor Analysis
- 4.1. Porters Five Forces
- 4.1.1. Bargaining Power of Suppliers
- 4.1.2. Bargaining Power of Buyers
- 4.1.3. Threat of New Entrants
- 4.1.4. Threat of Substitutes
- 4.1.5. Competitive Rivalry
- 4.2. PESTEL analysis
- 4.3. BCG Analysis
- 4.3.1. Stars (High Growth, High Market Share)
- 4.3.2. Cash Cows (Low Growth, High Market Share)
- 4.3.3. Question Mark (High Growth, Low Market Share)
- 4.3.4. Dogs (Low Growth, Low Market Share)
- 4.4. Ansoff Matrix Analysis
- 4.5. Supply Chain Analysis
- 4.6. Regulatory Landscape
- 4.7. Current Market Potential and Opportunity Assessment (TAM–SAM–SOM Framework)
- 4.8. NRP Analyst Note
- 4.1. Porters Five Forces
- 5. Market Analysis, Insights and Forecast 2021-2033
- 5.1. Market Analysis, Insights and Forecast - by Type
- 5.1.1. Earth Observation Data
- 5.1.2. Value Added Services
- 5.2. Market Analysis, Insights and Forecast - by Satellite Orbit
- 5.2.1. Low Earth Orbit
- 5.2.2. Medium Earth Orbit
- 5.2.3. Geostationary Orbit
- 5.3. Market Analysis, Insights and Forecast - by End-use
- 5.3.1. Urban Development and Cultural Heritage
- 5.3.2. Agriculture
- 5.3.3. Climate Services
- 5.3.4. Energy and Raw Materials
- 5.3.5. Infrastructure
- 5.3.6. Others
- 5.4. Market Analysis, Insights and Forecast - by Region
- 5.4.1. North America
- 5.4.2. South America
- 5.4.3. Europe
- 5.4.4. Middle East & Africa
- 5.4.5. Asia Pacific
- 5.1. Market Analysis, Insights and Forecast - by Type
- 6. Global ANZ Satellite-based Earth Observation Market Analysis, Insights and Forecast, 2021-2033
- 6.1. Market Analysis, Insights and Forecast - by Type
- 6.1.1. Earth Observation Data
- 6.1.2. Value Added Services
- 6.2. Market Analysis, Insights and Forecast - by Satellite Orbit
- 6.2.1. Low Earth Orbit
- 6.2.2. Medium Earth Orbit
- 6.2.3. Geostationary Orbit
- 6.3. Market Analysis, Insights and Forecast - by End-use
- 6.3.1. Urban Development and Cultural Heritage
- 6.3.2. Agriculture
- 6.3.3. Climate Services
- 6.3.4. Energy and Raw Materials
- 6.3.5. Infrastructure
- 6.3.6. Others
- 6.1. Market Analysis, Insights and Forecast - by Type
- 7. North America ANZ Satellite-based Earth Observation Market Analysis, Insights and Forecast, 2020-2032
- 7.1. Market Analysis, Insights and Forecast - by Type
- 7.1.1. Earth Observation Data
- 7.1.2. Value Added Services
- 7.2. Market Analysis, Insights and Forecast - by Satellite Orbit
- 7.2.1. Low Earth Orbit
- 7.2.2. Medium Earth Orbit
- 7.2.3. Geostationary Orbit
- 7.3. Market Analysis, Insights and Forecast - by End-use
- 7.3.1. Urban Development and Cultural Heritage
- 7.3.2. Agriculture
- 7.3.3. Climate Services
- 7.3.4. Energy and Raw Materials
- 7.3.5. Infrastructure
- 7.3.6. Others
- 7.1. Market Analysis, Insights and Forecast - by Type
- 8. South America ANZ Satellite-based Earth Observation Market Analysis, Insights and Forecast, 2020-2032
- 8.1. Market Analysis, Insights and Forecast - by Type
- 8.1.1. Earth Observation Data
- 8.1.2. Value Added Services
- 8.2. Market Analysis, Insights and Forecast - by Satellite Orbit
- 8.2.1. Low Earth Orbit
- 8.2.2. Medium Earth Orbit
- 8.2.3. Geostationary Orbit
- 8.3. Market Analysis, Insights and Forecast - by End-use
- 8.3.1. Urban Development and Cultural Heritage
- 8.3.2. Agriculture
- 8.3.3. Climate Services
- 8.3.4. Energy and Raw Materials
- 8.3.5. Infrastructure
- 8.3.6. Others
- 8.1. Market Analysis, Insights and Forecast - by Type
- 9. Europe ANZ Satellite-based Earth Observation Market Analysis, Insights and Forecast, 2020-2032
- 9.1. Market Analysis, Insights and Forecast - by Type
- 9.1.1. Earth Observation Data
- 9.1.2. Value Added Services
- 9.2. Market Analysis, Insights and Forecast - by Satellite Orbit
- 9.2.1. Low Earth Orbit
- 9.2.2. Medium Earth Orbit
- 9.2.3. Geostationary Orbit
- 9.3. Market Analysis, Insights and Forecast - by End-use
- 9.3.1. Urban Development and Cultural Heritage
- 9.3.2. Agriculture
- 9.3.3. Climate Services
- 9.3.4. Energy and Raw Materials
- 9.3.5. Infrastructure
- 9.3.6. Others
- 9.1. Market Analysis, Insights and Forecast - by Type
- 10. Middle East & Africa ANZ Satellite-based Earth Observation Market Analysis, Insights and Forecast, 2020-2032
- 10.1. Market Analysis, Insights and Forecast - by Type
- 10.1.1. Earth Observation Data
- 10.1.2. Value Added Services
- 10.2. Market Analysis, Insights and Forecast - by Satellite Orbit
- 10.2.1. Low Earth Orbit
- 10.2.2. Medium Earth Orbit
- 10.2.3. Geostationary Orbit
- 10.3. Market Analysis, Insights and Forecast - by End-use
- 10.3.1. Urban Development and Cultural Heritage
- 10.3.2. Agriculture
- 10.3.3. Climate Services
- 10.3.4. Energy and Raw Materials
- 10.3.5. Infrastructure
- 10.3.6. Others
- 10.1. Market Analysis, Insights and Forecast - by Type
- 11. Asia Pacific ANZ Satellite-based Earth Observation Market Analysis, Insights and Forecast, 2020-2032
- 11.1. Market Analysis, Insights and Forecast - by Type
- 11.1.1. Earth Observation Data
- 11.1.2. Value Added Services
- 11.2. Market Analysis, Insights and Forecast - by Satellite Orbit
- 11.2.1. Low Earth Orbit
- 11.2.2. Medium Earth Orbit
- 11.2.3. Geostationary Orbit
- 11.3. Market Analysis, Insights and Forecast - by End-use
- 11.3.1. Urban Development and Cultural Heritage
- 11.3.2. Agriculture
- 11.3.3. Climate Services
- 11.3.4. Energy and Raw Materials
- 11.3.5. Infrastructure
- 11.3.6. Others
- 11.1. Market Analysis, Insights and Forecast - by Type
- 12. Competitive Analysis
- 12.1. Company Profiles
- 12.1.1 Spiral Blue
- 12.1.1.1. Company Overview
- 12.1.1.2. Products
- 12.1.1.3. Company Financials
- 12.1.1.4. SWOT Analysis
- 12.1.2 Critchlow Geospatial
- 12.1.2.1. Company Overview
- 12.1.2.2. Products
- 12.1.2.3. Company Financials
- 12.1.2.4. SWOT Analysis
- 12.1.3 lockheed martin corporation
- 12.1.3.1. Company Overview
- 12.1.3.2. Products
- 12.1.3.3. Company Financials
- 12.1.3.4. SWOT Analysis
- 12.1.4 Airbus SE
- 12.1.4.1. Company Overview
- 12.1.4.2. Products
- 12.1.4.3. Company Financials
- 12.1.4.4. SWOT Analysis
- 12.1.5 Arlula Pty Ltd
- 12.1.5.1. Company Overview
- 12.1.5.2. Products
- 12.1.5.3. Company Financials
- 12.1.5.4. SWOT Analysis
- 12.1.6 Geoscience Australia
- 12.1.6.1. Company Overview
- 12.1.6.2. Products
- 12.1.6.3. Company Financials
- 12.1.6.4. SWOT Analysis
- 12.1.7 NEC Corporation
- 12.1.7.1. Company Overview
- 12.1.7.2. Products
- 12.1.7.3. Company Financials
- 12.1.7.4. SWOT Analysis
- 12.1.8 maitec
- 12.1.8.1. Company Overview
- 12.1.8.2. Products
- 12.1.8.3. Company Financials
- 12.1.8.4. SWOT Analysis
- 12.1.9 Go2Q Pty Ltd
- 12.1.9.1. Company Overview
- 12.1.9.2. Products
- 12.1.9.3. Company Financials
- 12.1.9.4. SWOT Analysis
- 12.1.10 LatConnect60 Pty Ltd
- 12.1.10.1. Company Overview
- 12.1.10.2. Products
- 12.1.10.3. Company Financials
- 12.1.10.4. SWOT Analysis
- 12.1.11 Geoimage Australia
- 12.1.11.1. Company Overview
- 12.1.11.2. Products
- 12.1.11.3. Company Financials
- 12.1.11.4. SWOT Analysis
- 12.1.1 Spiral Blue
- 12.2. Market Entropy
- 12.2.1 Company's Key Areas Served
- 12.2.2 Recent Developments
- 12.3. Company Market Share Analysis 2025
- 12.3.1 Top 5 Companies Market Share Analysis
- 12.3.2 Top 3 Companies Market Share Analysis
- 12.4. List of Potential Customers
- 13. Research Methodology
List of Figures
- Figure 1: Global ANZ Satellite-based Earth Observation Market Revenue Breakdown (billion, %) by Region 2025 & 2033
- Figure 2: Global ANZ Satellite-based Earth Observation Market Volume Breakdown (K Unit, %) by Region 2025 & 2033
- Figure 3: North America ANZ Satellite-based Earth Observation Market Revenue (billion), by Type 2025 & 2033
- Figure 4: North America ANZ Satellite-based Earth Observation Market Volume (K Unit), by Type 2025 & 2033
- Figure 5: North America ANZ Satellite-based Earth Observation Market Revenue Share (%), by Type 2025 & 2033
- Figure 6: North America ANZ Satellite-based Earth Observation Market Volume Share (%), by Type 2025 & 2033
- Figure 7: North America ANZ Satellite-based Earth Observation Market Revenue (billion), by Satellite Orbit 2025 & 2033
- Figure 8: North America ANZ Satellite-based Earth Observation Market Volume (K Unit), by Satellite Orbit 2025 & 2033
- Figure 9: North America ANZ Satellite-based Earth Observation Market Revenue Share (%), by Satellite Orbit 2025 & 2033
- Figure 10: North America ANZ Satellite-based Earth Observation Market Volume Share (%), by Satellite Orbit 2025 & 2033
- Figure 11: North America ANZ Satellite-based Earth Observation Market Revenue (billion), by End-use 2025 & 2033
- Figure 12: North America ANZ Satellite-based Earth Observation Market Volume (K Unit), by End-use 2025 & 2033
- Figure 13: North America ANZ Satellite-based Earth Observation Market Revenue Share (%), by End-use 2025 & 2033
- Figure 14: North America ANZ Satellite-based Earth Observation Market Volume Share (%), by End-use 2025 & 2033
- Figure 15: North America ANZ Satellite-based Earth Observation Market Revenue (billion), by Country 2025 & 2033
- Figure 16: North America ANZ Satellite-based Earth Observation Market Volume (K Unit), by Country 2025 & 2033
- Figure 17: North America ANZ Satellite-based Earth Observation Market Revenue Share (%), by Country 2025 & 2033
- Figure 18: North America ANZ Satellite-based Earth Observation Market Volume Share (%), by Country 2025 & 2033
- Figure 19: South America ANZ Satellite-based Earth Observation Market Revenue (billion), by Type 2025 & 2033
- Figure 20: South America ANZ Satellite-based Earth Observation Market Volume (K Unit), by Type 2025 & 2033
- Figure 21: South America ANZ Satellite-based Earth Observation Market Revenue Share (%), by Type 2025 & 2033
- Figure 22: South America ANZ Satellite-based Earth Observation Market Volume Share (%), by Type 2025 & 2033
- Figure 23: South America ANZ Satellite-based Earth Observation Market Revenue (billion), by Satellite Orbit 2025 & 2033
- Figure 24: South America ANZ Satellite-based Earth Observation Market Volume (K Unit), by Satellite Orbit 2025 & 2033
- Figure 25: South America ANZ Satellite-based Earth Observation Market Revenue Share (%), by Satellite Orbit 2025 & 2033
- Figure 26: South America ANZ Satellite-based Earth Observation Market Volume Share (%), by Satellite Orbit 2025 & 2033
- Figure 27: South America ANZ Satellite-based Earth Observation Market Revenue (billion), by End-use 2025 & 2033
- Figure 28: South America ANZ Satellite-based Earth Observation Market Volume (K Unit), by End-use 2025 & 2033
- Figure 29: South America ANZ Satellite-based Earth Observation Market Revenue Share (%), by End-use 2025 & 2033
- Figure 30: South America ANZ Satellite-based Earth Observation Market Volume Share (%), by End-use 2025 & 2033
- Figure 31: South America ANZ Satellite-based Earth Observation Market Revenue (billion), by Country 2025 & 2033
- Figure 32: South America ANZ Satellite-based Earth Observation Market Volume (K Unit), by Country 2025 & 2033
- Figure 33: South America ANZ Satellite-based Earth Observation Market Revenue Share (%), by Country 2025 & 2033
- Figure 34: South America ANZ Satellite-based Earth Observation Market Volume Share (%), by Country 2025 & 2033
- Figure 35: Europe ANZ Satellite-based Earth Observation Market Revenue (billion), by Type 2025 & 2033
- Figure 36: Europe ANZ Satellite-based Earth Observation Market Volume (K Unit), by Type 2025 & 2033
- Figure 37: Europe ANZ Satellite-based Earth Observation Market Revenue Share (%), by Type 2025 & 2033
- Figure 38: Europe ANZ Satellite-based Earth Observation Market Volume Share (%), by Type 2025 & 2033
- Figure 39: Europe ANZ Satellite-based Earth Observation Market Revenue (billion), by Satellite Orbit 2025 & 2033
- Figure 40: Europe ANZ Satellite-based Earth Observation Market Volume (K Unit), by Satellite Orbit 2025 & 2033
- Figure 41: Europe ANZ Satellite-based Earth Observation Market Revenue Share (%), by Satellite Orbit 2025 & 2033
- Figure 42: Europe ANZ Satellite-based Earth Observation Market Volume Share (%), by Satellite Orbit 2025 & 2033
- Figure 43: Europe ANZ Satellite-based Earth Observation Market Revenue (billion), by End-use 2025 & 2033
- Figure 44: Europe ANZ Satellite-based Earth Observation Market Volume (K Unit), by End-use 2025 & 2033
- Figure 45: Europe ANZ Satellite-based Earth Observation Market Revenue Share (%), by End-use 2025 & 2033
- Figure 46: Europe ANZ Satellite-based Earth Observation Market Volume Share (%), by End-use 2025 & 2033
- Figure 47: Europe ANZ Satellite-based Earth Observation Market Revenue (billion), by Country 2025 & 2033
- Figure 48: Europe ANZ Satellite-based Earth Observation Market Volume (K Unit), by Country 2025 & 2033
- Figure 49: Europe ANZ Satellite-based Earth Observation Market Revenue Share (%), by Country 2025 & 2033
- Figure 50: Europe ANZ Satellite-based Earth Observation Market Volume Share (%), by Country 2025 & 2033
- Figure 51: Middle East & Africa ANZ Satellite-based Earth Observation Market Revenue (billion), by Type 2025 & 2033
- Figure 52: Middle East & Africa ANZ Satellite-based Earth Observation Market Volume (K Unit), by Type 2025 & 2033
- Figure 53: Middle East & Africa ANZ Satellite-based Earth Observation Market Revenue Share (%), by Type 2025 & 2033
- Figure 54: Middle East & Africa ANZ Satellite-based Earth Observation Market Volume Share (%), by Type 2025 & 2033
- Figure 55: Middle East & Africa ANZ Satellite-based Earth Observation Market Revenue (billion), by Satellite Orbit 2025 & 2033
- Figure 56: Middle East & Africa ANZ Satellite-based Earth Observation Market Volume (K Unit), by Satellite Orbit 2025 & 2033
- Figure 57: Middle East & Africa ANZ Satellite-based Earth Observation Market Revenue Share (%), by Satellite Orbit 2025 & 2033
- Figure 58: Middle East & Africa ANZ Satellite-based Earth Observation Market Volume Share (%), by Satellite Orbit 2025 & 2033
- Figure 59: Middle East & Africa ANZ Satellite-based Earth Observation Market Revenue (billion), by End-use 2025 & 2033
- Figure 60: Middle East & Africa ANZ Satellite-based Earth Observation Market Volume (K Unit), by End-use 2025 & 2033
- Figure 61: Middle East & Africa ANZ Satellite-based Earth Observation Market Revenue Share (%), by End-use 2025 & 2033
- Figure 62: Middle East & Africa ANZ Satellite-based Earth Observation Market Volume Share (%), by End-use 2025 & 2033
- Figure 63: Middle East & Africa ANZ Satellite-based Earth Observation Market Revenue (billion), by Country 2025 & 2033
- Figure 64: Middle East & Africa ANZ Satellite-based Earth Observation Market Volume (K Unit), by Country 2025 & 2033
- Figure 65: Middle East & Africa ANZ Satellite-based Earth Observation Market Revenue Share (%), by Country 2025 & 2033
- Figure 66: Middle East & Africa ANZ Satellite-based Earth Observation Market Volume Share (%), by Country 2025 & 2033
- Figure 67: Asia Pacific ANZ Satellite-based Earth Observation Market Revenue (billion), by Type 2025 & 2033
- Figure 68: Asia Pacific ANZ Satellite-based Earth Observation Market Volume (K Unit), by Type 2025 & 2033
- Figure 69: Asia Pacific ANZ Satellite-based Earth Observation Market Revenue Share (%), by Type 2025 & 2033
- Figure 70: Asia Pacific ANZ Satellite-based Earth Observation Market Volume Share (%), by Type 2025 & 2033
- Figure 71: Asia Pacific ANZ Satellite-based Earth Observation Market Revenue (billion), by Satellite Orbit 2025 & 2033
- Figure 72: Asia Pacific ANZ Satellite-based Earth Observation Market Volume (K Unit), by Satellite Orbit 2025 & 2033
- Figure 73: Asia Pacific ANZ Satellite-based Earth Observation Market Revenue Share (%), by Satellite Orbit 2025 & 2033
- Figure 74: Asia Pacific ANZ Satellite-based Earth Observation Market Volume Share (%), by Satellite Orbit 2025 & 2033
- Figure 75: Asia Pacific ANZ Satellite-based Earth Observation Market Revenue (billion), by End-use 2025 & 2033
- Figure 76: Asia Pacific ANZ Satellite-based Earth Observation Market Volume (K Unit), by End-use 2025 & 2033
- Figure 77: Asia Pacific ANZ Satellite-based Earth Observation Market Revenue Share (%), by End-use 2025 & 2033
- Figure 78: Asia Pacific ANZ Satellite-based Earth Observation Market Volume Share (%), by End-use 2025 & 2033
- Figure 79: Asia Pacific ANZ Satellite-based Earth Observation Market Revenue (billion), by Country 2025 & 2033
- Figure 80: Asia Pacific ANZ Satellite-based Earth Observation Market Volume (K Unit), by Country 2025 & 2033
- Figure 81: Asia Pacific ANZ Satellite-based Earth Observation Market Revenue Share (%), by Country 2025 & 2033
- Figure 82: Asia Pacific ANZ Satellite-based Earth Observation Market Volume Share (%), by Country 2025 & 2033
List of Tables
- Table 1: Global ANZ Satellite-based Earth Observation Market Revenue billion Forecast, by Type 2020 & 2033
- Table 2: Global ANZ Satellite-based Earth Observation Market Volume K Unit Forecast, by Type 2020 & 2033
- Table 3: Global ANZ Satellite-based Earth Observation Market Revenue billion Forecast, by Satellite Orbit 2020 & 2033
- Table 4: Global ANZ Satellite-based Earth Observation Market Volume K Unit Forecast, by Satellite Orbit 2020 & 2033
- Table 5: Global ANZ Satellite-based Earth Observation Market Revenue billion Forecast, by End-use 2020 & 2033
- Table 6: Global ANZ Satellite-based Earth Observation Market Volume K Unit Forecast, by End-use 2020 & 2033
- Table 7: Global ANZ Satellite-based Earth Observation Market Revenue billion Forecast, by Region 2020 & 2033
- Table 8: Global ANZ Satellite-based Earth Observation Market Volume K Unit Forecast, by Region 2020 & 2033
- Table 9: Global ANZ Satellite-based Earth Observation Market Revenue billion Forecast, by Type 2020 & 2033
- Table 10: Global ANZ Satellite-based Earth Observation Market Volume K Unit Forecast, by Type 2020 & 2033
- Table 11: Global ANZ Satellite-based Earth Observation Market Revenue billion Forecast, by Satellite Orbit 2020 & 2033
- Table 12: Global ANZ Satellite-based Earth Observation Market Volume K Unit Forecast, by Satellite Orbit 2020 & 2033
- Table 13: Global ANZ Satellite-based Earth Observation Market Revenue billion Forecast, by End-use 2020 & 2033
- Table 14: Global ANZ Satellite-based Earth Observation Market Volume K Unit Forecast, by End-use 2020 & 2033
- Table 15: Global ANZ Satellite-based Earth Observation Market Revenue billion Forecast, by Country 2020 & 2033
- Table 16: Global ANZ Satellite-based Earth Observation Market Volume K Unit Forecast, by Country 2020 & 2033
- Table 17: United States ANZ Satellite-based Earth Observation Market Revenue (billion) Forecast, by Application 2020 & 2033
- Table 18: United States ANZ Satellite-based Earth Observation Market Volume (K Unit) Forecast, by Application 2020 & 2033
- Table 19: Canada ANZ Satellite-based Earth Observation Market Revenue (billion) Forecast, by Application 2020 & 2033
- Table 20: Canada ANZ Satellite-based Earth Observation Market Volume (K Unit) Forecast, by Application 2020 & 2033
- Table 21: Mexico ANZ Satellite-based Earth Observation Market Revenue (billion) Forecast, by Application 2020 & 2033
- Table 22: Mexico ANZ Satellite-based Earth Observation Market Volume (K Unit) Forecast, by Application 2020 & 2033
- Table 23: Global ANZ Satellite-based Earth Observation Market Revenue billion Forecast, by Type 2020 & 2033
- Table 24: Global ANZ Satellite-based Earth Observation Market Volume K Unit Forecast, by Type 2020 & 2033
- Table 25: Global ANZ Satellite-based Earth Observation Market Revenue billion Forecast, by Satellite Orbit 2020 & 2033
- Table 26: Global ANZ Satellite-based Earth Observation Market Volume K Unit Forecast, by Satellite Orbit 2020 & 2033
- Table 27: Global ANZ Satellite-based Earth Observation Market Revenue billion Forecast, by End-use 2020 & 2033
- Table 28: Global ANZ Satellite-based Earth Observation Market Volume K Unit Forecast, by End-use 2020 & 2033
- Table 29: Global ANZ Satellite-based Earth Observation Market Revenue billion Forecast, by Country 2020 & 2033
- Table 30: Global ANZ Satellite-based Earth Observation Market Volume K Unit Forecast, by Country 2020 & 2033
- Table 31: Brazil ANZ Satellite-based Earth Observation Market Revenue (billion) Forecast, by Application 2020 & 2033
- Table 32: Brazil ANZ Satellite-based Earth Observation Market Volume (K Unit) Forecast, by Application 2020 & 2033
- Table 33: Argentina ANZ Satellite-based Earth Observation Market Revenue (billion) Forecast, by Application 2020 & 2033
- Table 34: Argentina ANZ Satellite-based Earth Observation Market Volume (K Unit) Forecast, by Application 2020 & 2033
- Table 35: Rest of South America ANZ Satellite-based Earth Observation Market Revenue (billion) Forecast, by Application 2020 & 2033
- Table 36: Rest of South America ANZ Satellite-based Earth Observation Market Volume (K Unit) Forecast, by Application 2020 & 2033
- Table 37: Global ANZ Satellite-based Earth Observation Market Revenue billion Forecast, by Type 2020 & 2033
- Table 38: Global ANZ Satellite-based Earth Observation Market Volume K Unit Forecast, by Type 2020 & 2033
- Table 39: Global ANZ Satellite-based Earth Observation Market Revenue billion Forecast, by Satellite Orbit 2020 & 2033
- Table 40: Global ANZ Satellite-based Earth Observation Market Volume K Unit Forecast, by Satellite Orbit 2020 & 2033
- Table 41: Global ANZ Satellite-based Earth Observation Market Revenue billion Forecast, by End-use 2020 & 2033
- Table 42: Global ANZ Satellite-based Earth Observation Market Volume K Unit Forecast, by End-use 2020 & 2033
- Table 43: Global ANZ Satellite-based Earth Observation Market Revenue billion Forecast, by Country 2020 & 2033
- Table 44: Global ANZ Satellite-based Earth Observation Market Volume K Unit Forecast, by Country 2020 & 2033
- Table 45: United Kingdom ANZ Satellite-based Earth Observation Market Revenue (billion) Forecast, by Application 2020 & 2033
- Table 46: United Kingdom ANZ Satellite-based Earth Observation Market Volume (K Unit) Forecast, by Application 2020 & 2033
- Table 47: Germany ANZ Satellite-based Earth Observation Market Revenue (billion) Forecast, by Application 2020 & 2033
- Table 48: Germany ANZ Satellite-based Earth Observation Market Volume (K Unit) Forecast, by Application 2020 & 2033
- Table 49: France ANZ Satellite-based Earth Observation Market Revenue (billion) Forecast, by Application 2020 & 2033
- Table 50: France ANZ Satellite-based Earth Observation Market Volume (K Unit) Forecast, by Application 2020 & 2033
- Table 51: Italy ANZ Satellite-based Earth Observation Market Revenue (billion) Forecast, by Application 2020 & 2033
- Table 52: Italy ANZ Satellite-based Earth Observation Market Volume (K Unit) Forecast, by Application 2020 & 2033
- Table 53: Spain ANZ Satellite-based Earth Observation Market Revenue (billion) Forecast, by Application 2020 & 2033
- Table 54: Spain ANZ Satellite-based Earth Observation Market Volume (K Unit) Forecast, by Application 2020 & 2033
- Table 55: Russia ANZ Satellite-based Earth Observation Market Revenue (billion) Forecast, by Application 2020 & 2033
- Table 56: Russia ANZ Satellite-based Earth Observation Market Volume (K Unit) Forecast, by Application 2020 & 2033
- Table 57: Benelux ANZ Satellite-based Earth Observation Market Revenue (billion) Forecast, by Application 2020 & 2033
- Table 58: Benelux ANZ Satellite-based Earth Observation Market Volume (K Unit) Forecast, by Application 2020 & 2033
- Table 59: Nordics ANZ Satellite-based Earth Observation Market Revenue (billion) Forecast, by Application 2020 & 2033
- Table 60: Nordics ANZ Satellite-based Earth Observation Market Volume (K Unit) Forecast, by Application 2020 & 2033
- Table 61: Rest of Europe ANZ Satellite-based Earth Observation Market Revenue (billion) Forecast, by Application 2020 & 2033
- Table 62: Rest of Europe ANZ Satellite-based Earth Observation Market Volume (K Unit) Forecast, by Application 2020 & 2033
- Table 63: Global ANZ Satellite-based Earth Observation Market Revenue billion Forecast, by Type 2020 & 2033
- Table 64: Global ANZ Satellite-based Earth Observation Market Volume K Unit Forecast, by Type 2020 & 2033
- Table 65: Global ANZ Satellite-based Earth Observation Market Revenue billion Forecast, by Satellite Orbit 2020 & 2033
- Table 66: Global ANZ Satellite-based Earth Observation Market Volume K Unit Forecast, by Satellite Orbit 2020 & 2033
- Table 67: Global ANZ Satellite-based Earth Observation Market Revenue billion Forecast, by End-use 2020 & 2033
- Table 68: Global ANZ Satellite-based Earth Observation Market Volume K Unit Forecast, by End-use 2020 & 2033
- Table 69: Global ANZ Satellite-based Earth Observation Market Revenue billion Forecast, by Country 2020 & 2033
- Table 70: Global ANZ Satellite-based Earth Observation Market Volume K Unit Forecast, by Country 2020 & 2033
- Table 71: Turkey ANZ Satellite-based Earth Observation Market Revenue (billion) Forecast, by Application 2020 & 2033
- Table 72: Turkey ANZ Satellite-based Earth Observation Market Volume (K Unit) Forecast, by Application 2020 & 2033
- Table 73: Israel ANZ Satellite-based Earth Observation Market Revenue (billion) Forecast, by Application 2020 & 2033
- Table 74: Israel ANZ Satellite-based Earth Observation Market Volume (K Unit) Forecast, by Application 2020 & 2033
- Table 75: GCC ANZ Satellite-based Earth Observation Market Revenue (billion) Forecast, by Application 2020 & 2033
- Table 76: GCC ANZ Satellite-based Earth Observation Market Volume (K Unit) Forecast, by Application 2020 & 2033
- Table 77: North Africa ANZ Satellite-based Earth Observation Market Revenue (billion) Forecast, by Application 2020 & 2033
- Table 78: North Africa ANZ Satellite-based Earth Observation Market Volume (K Unit) Forecast, by Application 2020 & 2033
- Table 79: South Africa ANZ Satellite-based Earth Observation Market Revenue (billion) Forecast, by Application 2020 & 2033
- Table 80: South Africa ANZ Satellite-based Earth Observation Market Volume (K Unit) Forecast, by Application 2020 & 2033
- Table 81: Rest of Middle East & Africa ANZ Satellite-based Earth Observation Market Revenue (billion) Forecast, by Application 2020 & 2033
- Table 82: Rest of Middle East & Africa ANZ Satellite-based Earth Observation Market Volume (K Unit) Forecast, by Application 2020 & 2033
- Table 83: Global ANZ Satellite-based Earth Observation Market Revenue billion Forecast, by Type 2020 & 2033
- Table 84: Global ANZ Satellite-based Earth Observation Market Volume K Unit Forecast, by Type 2020 & 2033
- Table 85: Global ANZ Satellite-based Earth Observation Market Revenue billion Forecast, by Satellite Orbit 2020 & 2033
- Table 86: Global ANZ Satellite-based Earth Observation Market Volume K Unit Forecast, by Satellite Orbit 2020 & 2033
- Table 87: Global ANZ Satellite-based Earth Observation Market Revenue billion Forecast, by End-use 2020 & 2033
- Table 88: Global ANZ Satellite-based Earth Observation Market Volume K Unit Forecast, by End-use 2020 & 2033
- Table 89: Global ANZ Satellite-based Earth Observation Market Revenue billion Forecast, by Country 2020 & 2033
- Table 90: Global ANZ Satellite-based Earth Observation Market Volume K Unit Forecast, by Country 2020 & 2033
- Table 91: China ANZ Satellite-based Earth Observation Market Revenue (billion) Forecast, by Application 2020 & 2033
- Table 92: China ANZ Satellite-based Earth Observation Market Volume (K Unit) Forecast, by Application 2020 & 2033
- Table 93: India ANZ Satellite-based Earth Observation Market Revenue (billion) Forecast, by Application 2020 & 2033
- Table 94: India ANZ Satellite-based Earth Observation Market Volume (K Unit) Forecast, by Application 2020 & 2033
- Table 95: Japan ANZ Satellite-based Earth Observation Market Revenue (billion) Forecast, by Application 2020 & 2033
- Table 96: Japan ANZ Satellite-based Earth Observation Market Volume (K Unit) Forecast, by Application 2020 & 2033
- Table 97: South Korea ANZ Satellite-based Earth Observation Market Revenue (billion) Forecast, by Application 2020 & 2033
- Table 98: South Korea ANZ Satellite-based Earth Observation Market Volume (K Unit) Forecast, by Application 2020 & 2033
- Table 99: ASEAN ANZ Satellite-based Earth Observation Market Revenue (billion) Forecast, by Application 2020 & 2033
- Table 100: ASEAN ANZ Satellite-based Earth Observation Market Volume (K Unit) Forecast, by Application 2020 & 2033
- Table 101: Oceania ANZ Satellite-based Earth Observation Market Revenue (billion) Forecast, by Application 2020 & 2033
- Table 102: Oceania ANZ Satellite-based Earth Observation Market Volume (K Unit) Forecast, by Application 2020 & 2033
- Table 103: Rest of Asia Pacific ANZ Satellite-based Earth Observation Market Revenue (billion) Forecast, by Application 2020 & 2033
- Table 104: Rest of Asia Pacific ANZ Satellite-based Earth Observation Market Volume (K Unit) Forecast, by Application 2020 & 2033
Frequently Asked Questions
1. What is the projected Compound Annual Growth Rate (CAGR) of the ANZ Satellite-based Earth Observation Market?
The projected CAGR is approximately 5.9%.
2. Which companies are prominent players in the ANZ Satellite-based Earth Observation Market?
Key companies in the market include Spiral Blue, Critchlow Geospatial, lockheed martin corporation, Airbus SE, Arlula Pty Ltd, Geoscience Australia, NEC Corporation, maitec, Go2Q Pty Ltd, LatConnect60 Pty Ltd, Geoimage Australia.
3. What are the main segments of the ANZ Satellite-based Earth Observation Market?
The market segments include Type, Satellite Orbit, End-use.
4. Can you provide details about the market size?
The market size is estimated to be USD 3.9 billion as of 2022.
5. What are some drivers contributing to market growth?
Government Initiatives and Investments; Technological Advancements.
6. What are the notable trends driving market growth?
Government Initiatives and Investments is Driving the Market.
7. Are there any restraints impacting market growth?
Budget Constraints and Technological Limitations; Regulatory and Legal Challenges.
8. Can you provide examples of recent developments in the market?
March 2023: Rocket Lab USA, Inc, a global leader in launch services and space systems, announced the establishment of a new wholly-owned subsidiary, Rocket Lab Australia, to explore opportunities to support the expansion of Australia's national space capabilities, which shows the market growth potential for the satellite-based earth observation market in the region.
9. What pricing options are available for accessing the report?
Pricing options include single-user, multi-user, and enterprise licenses priced at USD 3800, USD 4500, and USD 5800 respectively.
10. Is the market size provided in terms of value or volume?
The market size is provided in terms of value, measured in billion and volume, measured in K Unit.
11. Are there any specific market keywords associated with the report?
Yes, the market keyword associated with the report is "ANZ Satellite-based Earth Observation Market," which aids in identifying and referencing the specific market segment covered.
12. How do I determine which pricing option suits my needs best?
The pricing options vary based on user requirements and access needs. Individual users may opt for single-user licenses, while businesses requiring broader access may choose multi-user or enterprise licenses for cost-effective access to the report.
13. Are there any additional resources or data provided in the ANZ Satellite-based Earth Observation Market report?
While the report offers comprehensive insights, it's advisable to review the specific contents or supplementary materials provided to ascertain if additional resources or data are available.
14. How can I stay updated on further developments or reports in the ANZ Satellite-based Earth Observation Market?
To stay informed about further developments, trends, and reports in the ANZ Satellite-based Earth Observation Market, consider subscribing to industry newsletters, following relevant companies and organizations, or regularly checking reputable industry news sources and publications.
Methodology
Step 1 - Identification of Relevant Samples Size from Population Database


Step 2 - Approaches for Defining Global Market Size (Value, Volume* & Price*)

Note*: In applicable scenarios
Step 3 - Data Sources
Primary Research
- Web Analytics
- Survey Reports
- Research Institute
- Latest Research Reports
- Opinion Leaders
Secondary Research
- Annual Reports
- White Paper
- Latest Press Release
- Industry Association
- Paid Database
- Investor Presentations

Step 4 - Data Triangulation
Involves using different sources of information in order to increase the validity of a study
These sources are likely to be stakeholders in a program - participants, other researchers, program staff, other community members, and so on.
Then we put all data in single framework & apply various statistical tools to find out the dynamic on the market.
During the analysis stage, feedback from the stakeholder groups would be compared to determine areas of agreement as well as areas of divergence