

Key Insights
The US video game industry is poised for significant expansion, projected to reach a substantial market size of $57.91 million by 2025, exhibiting a robust Compound Annual Growth Rate (CAGR) of 9.41% through 2033. This dynamic growth is propelled by a confluence of powerful drivers, most notably the escalating adoption of mobile gaming, the continued innovation and accessibility of PC gaming platforms, and the enduring popularity of console gaming. The proliferation of high-speed internet and the increasing penetration of smartphones and advanced gaming consoles have democratized access to immersive gaming experiences, making them more accessible to a wider demographic. Furthermore, the rise of esports, compelling subscription models, and free-to-play offerings with in-game purchases have fostered a vibrant and economically sustainable ecosystem.
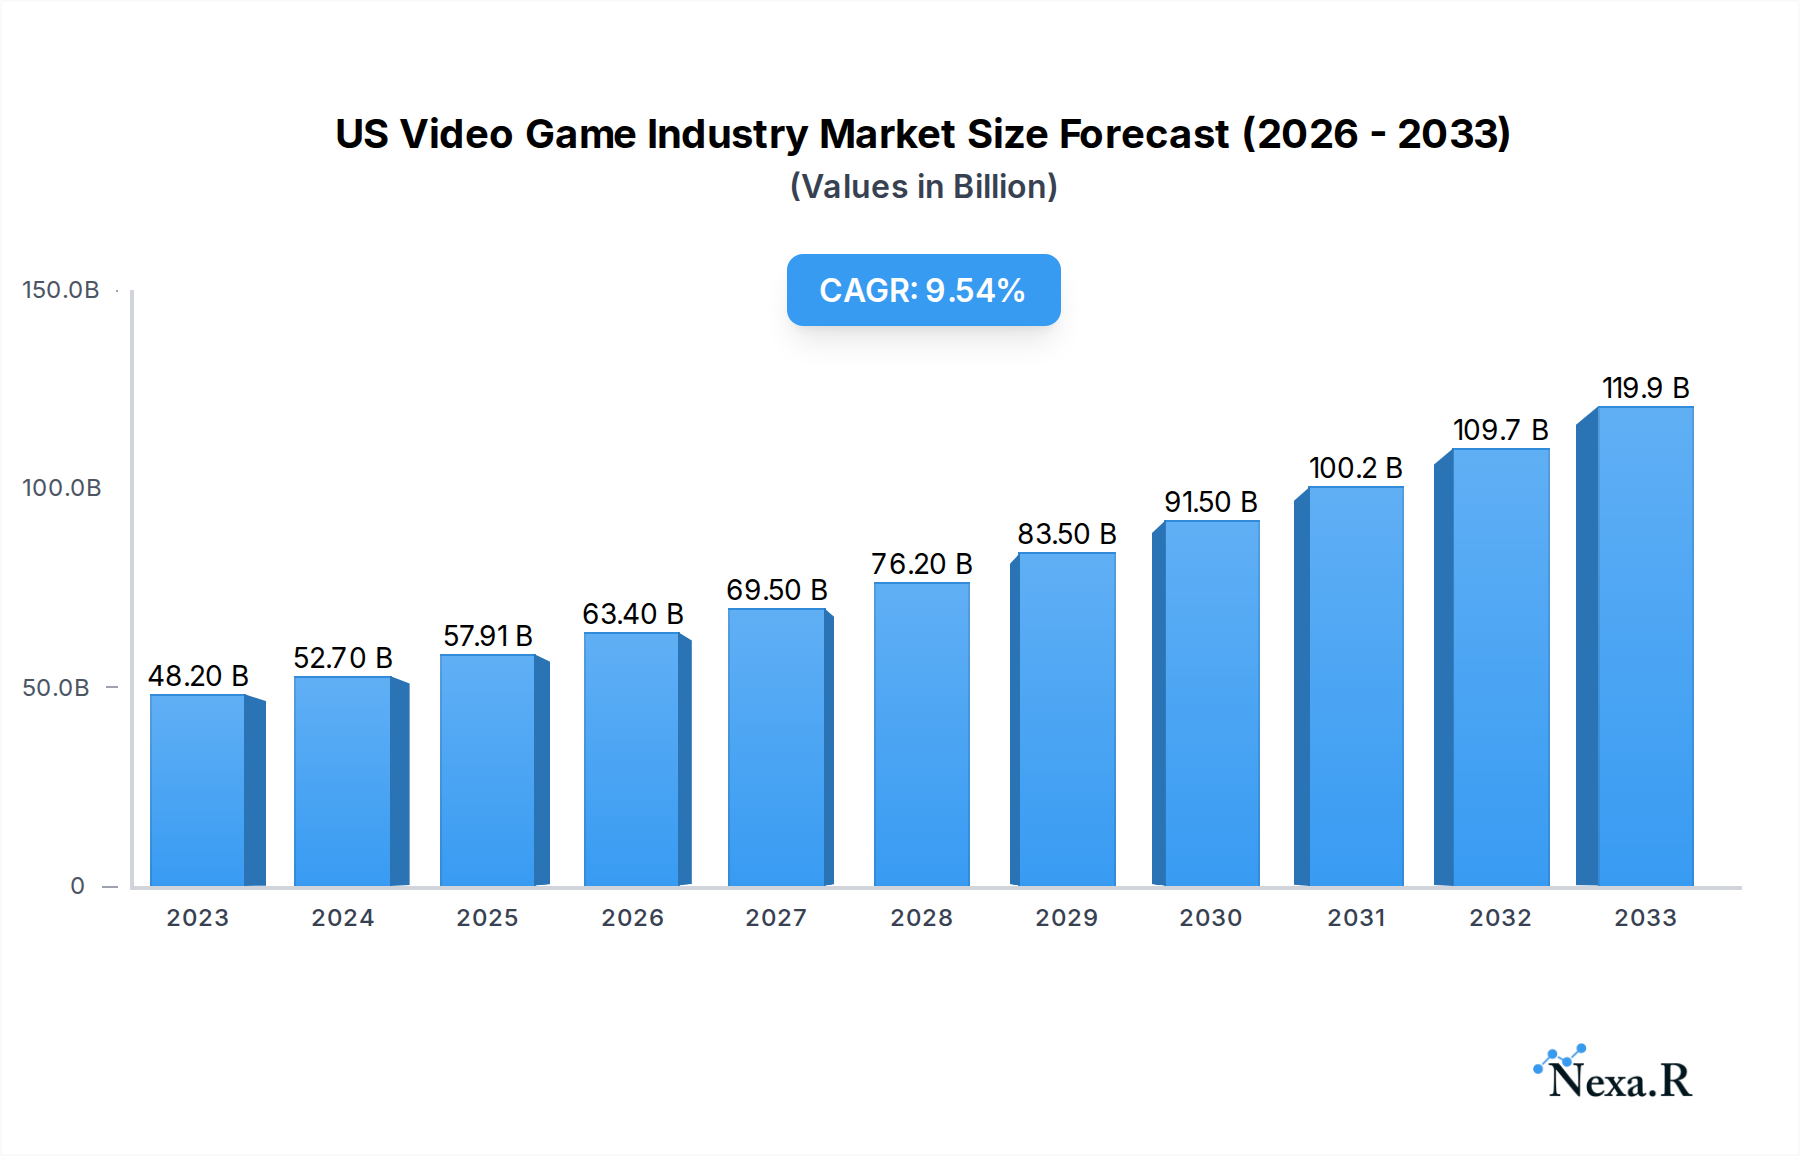
US Video Game Industry Market Size (In Billion)
Key trends shaping the US video game market include the diversification of game genres, with Action, Role-playing, and Strategy titles consistently leading engagement, alongside the growing influence of independent game development. The business models are evolving, with a significant shift towards free-to-play and subscription-based services, catering to diverse player preferences and affordability. While the market benefits from strong consumer demand and technological advancements, potential restraints may arise from increasing development costs, the growing complexity of game production, and the potential for market saturation in certain segments. Nonetheless, the industry's ability to innovate and adapt to evolving player behaviors, coupled with the strong presence of major players like Activision Blizzard, Electronic Arts, and Microsoft, ensures a promising trajectory for the US video game sector.

US Video Game Industry Company Market Share
US Video Game Industry Market Dynamics & Structure
The US video game industry is a dynamic and highly concentrated market, driven by continuous technological innovation and evolving consumer engagement. Companies like Activision Blizzard Inc, Electronic Arts Inc, and Nintendo Co Ltd dominate with established franchises and robust intellectual property portfolios. Market concentration is evident in the significant market share held by these major players, coupled with strategic acquisitions aimed at expanding their reach and capabilities.
- Technological Innovation Drivers: Advancements in cloud gaming, virtual reality (VR), augmented reality (AR), and mobile hardware continuously push the boundaries of player experience. AI-powered game design and procedural content generation are also emerging as key innovation areas.
- Regulatory Frameworks: While generally favorable, the industry navigates evolving regulations concerning data privacy, online safety, and content appropriateness, particularly for younger audiences.
- Competitive Product Substitutes: The primary substitutes for traditional video games include other forms of digital entertainment like streaming services, social media, and short-form video content. However, the immersive and interactive nature of gaming provides a distinct value proposition.
- End-User Demographics: The US video game audience is increasingly diverse, encompassing a wide age range and demographic profile, with a significant portion of players engaging across multiple platforms and genres.
- M&A Trends: Mergers and acquisitions remain a crucial strategy for market consolidation and expansion. Major deals, such as Microsoft's proposed acquisition of Activision Blizzard, signal a trend towards platform consolidation and content acquisition. The historical period (2019-2024) has seen substantial investment in mobile game studios and esports ventures.
US Video Game Industry Growth Trends & Insights
The US video game industry is poised for substantial growth, fueled by increasing digital penetration, innovative business models, and a broadening player base. The market size has witnessed consistent expansion throughout the historical period (2019-2024), with projections indicating a robust Compound Annual Growth Rate (CAGR) through the forecast period (2025-2033). This growth is underpinned by high adoption rates across all segments, driven by increased leisure time and the accessibility of gaming on various devices. Technological disruptions, including the maturation of cloud gaming services and the development of more accessible VR/AR hardware, are reshaping how consumers interact with games.
Shifts in consumer behavior are profoundly impacting market dynamics. There's a growing preference for live-service games that offer continuous engagement through updates and social features. The free-to-play model, particularly in the mobile segment, has achieved remarkable success, lowering the barrier to entry for new players and driving revenue through in-app purchases and microtransactions. Subscription services are also gaining traction, offering players access to extensive game libraries at a fixed monthly cost, mirroring trends seen in other digital media sectors. Furthermore, the rise of esports has transformed gaming from a solitary activity into a spectator sport, attracting significant investment and viewership, and creating new revenue streams through advertising, sponsorships, and media rights. The base year (2025) serves as a critical juncture, reflecting the current landscape before a projected acceleration in the coming years. The estimated year (2025) aligns with this pivotal moment, capturing the immediate momentum.
Dominant Regions, Countries, or Segments in US Video Game Industry
Within the expansive US video game industry, Mobile Gaming consistently emerges as the dominant segment, driving significant market growth. This dominance is attributed to its unparalleled accessibility, broad demographic reach, and the proliferation of affordable smartphones. The mobile platform caters to a vast audience seeking convenient and on-the-go entertainment, making it a lucrative entry point for both established publishers and independent developers.
Types:
- Mobile Gaming: Accounts for the largest share of revenue and active users. Its accessibility and diverse monetization models, including free-to-play, contribute to its leadership.
- Console Gaming: Remains a powerhouse, driven by high-fidelity experiences and strong brand loyalty from franchises developed by companies like Sony Corporation and Nintendo Co Ltd.
- PC Browser/Downloaded: Continues to be a significant segment, particularly for strategy, simulation, and MMORPGs, with platforms like Valve Corporation's Steam driving a large portion of its ecosystem.
Genre:
- Action and Role-playing (RPG) genres, particularly in their mobile and console iterations, consistently attract large player bases and generate substantial revenue.
- Sports games, with their annual releases and dedicated fanbases from companies like Electronic Arts Inc., also hold significant market sway.
Platform:
- Mobile devices lead in terms of active users and revenue generation.
- Consoles (e.g., PlayStation, Xbox, Nintendo Switch) offer premium gaming experiences and strong engagement.
- PCs remain crucial for certain genres and competitive gaming.
Business Model:
- Free-to-play (F2P) is the cornerstone of mobile gaming's success, attracting massive user numbers and generating revenue through in-app purchases.
- Subscription-based models are gaining traction, offering access to extensive game libraries and value for dedicated gamers.
- Pay-to-play remains the traditional model for premium console and PC releases, catering to players seeking full ownership and upfront experiences.
The sustained growth of mobile gaming is further bolstered by ongoing investments in the segment by major players like Zynga Inc., who specialize in social and mobile experiences. The convergence of these factors ensures mobile gaming's continued leadership in the US video game industry throughout the forecast period (2025-2033).
US Video Game Industry Product Landscape
The US video game industry's product landscape is characterized by relentless innovation and diverse applications. Companies are continually pushing graphical fidelity, introducing immersive gameplay mechanics, and leveraging new technologies like AI to create richer, more engaging experiences. From sprawling open-world RPGs on consoles to hyper-casual games on mobile devices, the variety of products caters to every taste and preference. Unique selling propositions often revolve around compelling narratives, competitive multiplayer modes, and the integration of social features. Technological advancements in rendering, physics engines, and cross-platform compatibility are central to maintaining market appeal and driving player engagement.
Key Drivers, Barriers & Challenges in US Video Game Industry
Key Drivers:
- Technological Advancements: Continuous innovation in hardware (consoles, mobile, VR/AR) and software (game engines, AI) fuels new gameplay possibilities and enhances player experiences.
- Growing Digital Infrastructure: Widespread broadband internet access and the increasing adoption of cloud gaming services make games more accessible than ever.
- Diverse Business Models: The success of free-to-play, subscription services, and esports has broadened the market and created new revenue streams.
- Strong Intellectual Property: Established game franchises and strong brand recognition provide a stable foundation for continued consumer interest.
Barriers & Challenges:
- High Development Costs: Creating AAA games requires massive investment, leading to increased pressure for commercial success and potentially limiting creative risks.
- Market Saturation and Competition: The sheer volume of games released creates intense competition for player attention and spending, making discoverability a significant challenge.
- Regulatory Scrutiny: Evolving regulations concerning data privacy, in-game monetization, and child protection can impact business practices.
- Talent Acquisition and Retention: The demand for skilled game developers, artists, and engineers often outstrips supply, leading to challenges in building and maintaining development teams. Supply chain issues for hardware components can also pose a threat.
Emerging Opportunities in US Video Game Industry
Emerging opportunities in the US video game industry lie in the continued expansion of cloud gaming, the maturation of the metaverse concept, and the increasing integration of AI in game development and player engagement. Untapped markets in emerging economies and the growing demand for accessible gaming for individuals with disabilities present significant potential. Furthermore, the evolution of user-generated content platforms and the increasing sophistication of cross-platform play will foster new communities and revenue models. The convergence of gaming with other entertainment forms, such as film and music, offers further avenues for innovation and audience expansion.
Growth Accelerators in the US Video Game Industry Industry
Long-term growth in the US video game industry is significantly accelerated by breakthroughs in cloud infrastructure, enabling seamless gaming experiences across a multitude of devices. Strategic partnerships between traditional media companies and game developers, along with the increasing investment in esports ecosystems, are further propelling market expansion. The ongoing development of immersive technologies like VR and AR, coupled with the anticipated widespread adoption of 5G networks, will unlock entirely new dimensions of interactive entertainment, driving sustained consumer engagement and market growth.
Key Players Shaping the US Video Game Industry Market
- Activision Blizzard Inc
- Electronic Arts Inc
- Microsoft Corporation
- Nintendo Co Ltd
- Sony Corporation
- Take-Two Interactive Software Inc
- Ubisoft Entertainment SA
- Valve Corporation
- Zynga Inc.
- BioWare
Notable Milestones in US Video Game Industry Sector
- May 2022: Electronic Arts partnered with Middle-earth Enterprises to develop The Lord of the Rings: Heroes of Middle-earth, a free-to-play mobile Collectible Role-Playing Game (RPG), aiming to capture both existing fans and new audiences with its strategic, social-competitive experience.
- April 2022: Activision Blizzard, Inc. stockholders approved Microsoft Corporation's proposal to acquire the company, following Microsoft's January 2022 announcement of plans to acquire Activision Blizzard for USD 95.00 per share in an all-cash transaction, with the deal expected to close by Microsoft's fiscal year ending June 30, 2023.
In-Depth US Video Game Industry Market Outlook
The US video game industry's outlook is exceptionally positive, driven by a confluence of accelerating factors. The continued refinement and widespread adoption of cloud gaming technologies are poised to democratize access to high-fidelity gaming experiences, significantly expanding the addressable market. Strategic alliances, particularly those involving major tech conglomerates and established game studios, will foster innovation and consolidate market leadership. Furthermore, the burgeoning esports sector, with its massive viewership and increasing commercial viability, represents a substantial growth engine. The integration of emerging technologies and evolving consumer preferences for interactive, social, and persistent online experiences will collectively propel the industry towards unprecedented growth and market potential in the coming years.
US Video Game Industry Segmentation
-
1. Types
- 1.1. Mobile G
- 1.2. Console Gaming
- 1.3. PC Browser/Downloaded
-
2. Genre
- 2.1. Action
- 2.2. Adventure
- 2.3. Role-playing
- 2.4. Strategy
- 2.5. Simulation
- 2.6. sports
-
3. Platform
- 3.1. PC
- 3.2. console
- 3.3. Mobile device
-
4. Business model
- 4.1. Free-to-play
- 4.2. subscription-based
- 4.3. Pay-to-play
US Video Game Industry Segmentation By Geography
-
1. North America
- 1.1. United States
- 1.2. Canada
- 1.3. Mexico
-
2. South America
- 2.1. Brazil
- 2.2. Argentina
- 2.3. Rest of South America
-
3. Europe
- 3.1. United Kingdom
- 3.2. Germany
- 3.3. France
- 3.4. Italy
- 3.5. Spain
- 3.6. Russia
- 3.7. Benelux
- 3.8. Nordics
- 3.9. Rest of Europe
-
4. Middle East & Africa
- 4.1. Turkey
- 4.2. Israel
- 4.3. GCC
- 4.4. North Africa
- 4.5. South Africa
- 4.6. Rest of Middle East & Africa
-
5. Asia Pacific
- 5.1. China
- 5.2. India
- 5.3. Japan
- 5.4. South Korea
- 5.5. ASEAN
- 5.6. Oceania
- 5.7. Rest of Asia Pacific

US Video Game Industry Regional Market Share
Geographic Coverage of US Video Game Industry
US Video Game Industry REPORT HIGHLIGHTS
| Aspects | Details |
|---|---|
| Study Period | 2020-2034 |
| Base Year | 2025 |
| Estimated Year | 2026 |
| Forecast Period | 2026-2034 |
| Historical Period | 2020-2025 |
| Growth Rate | CAGR of 9.41% from 2020-2034 |
| Segmentation |
|
Table of Contents
- 1. Introduction
- 1.1. Research Scope
- 1.2. Market Segmentation
- 1.3. Research Objective
- 1.4. Definitions and Assumptions
- 2. Executive Summary
- 2.1. Market Snapshot
- 3. Market Dynamics
- 3.1. Market Drivers
- 3.2. Market Restrains
- 3.3. Market Trends
- 3.4. Market Opportunities
- 4. Market Factor Analysis
- 4.1. Porters Five Forces
- 4.1.1. Bargaining Power of Suppliers
- 4.1.2. Bargaining Power of Buyers
- 4.1.3. Threat of New Entrants
- 4.1.4. Threat of Substitutes
- 4.1.5. Competitive Rivalry
- 4.2. PESTEL analysis
- 4.3. BCG Analysis
- 4.3.1. Stars (High Growth, High Market Share)
- 4.3.2. Cash Cows (Low Growth, High Market Share)
- 4.3.3. Question Mark (High Growth, Low Market Share)
- 4.3.4. Dogs (Low Growth, Low Market Share)
- 4.4. Ansoff Matrix Analysis
- 4.5. Supply Chain Analysis
- 4.6. Regulatory Landscape
- 4.7. Current Market Potential and Opportunity Assessment (TAM–SAM–SOM Framework)
- 4.8. NRP Analyst Note
- 4.1. Porters Five Forces
- 5. Market Analysis, Insights and Forecast 2021-2033
- 5.1. Market Analysis, Insights and Forecast - by Types
- 5.1.1. Mobile G
- 5.1.2. Console Gaming
- 5.1.3. PC Browser/Downloaded
- 5.2. Market Analysis, Insights and Forecast - by Genre
- 5.2.1. Action
- 5.2.2. Adventure
- 5.2.3. Role-playing
- 5.2.4. Strategy
- 5.2.5. Simulation
- 5.2.6. sports
- 5.3. Market Analysis, Insights and Forecast - by Platform
- 5.3.1. PC
- 5.3.2. console
- 5.3.3. Mobile device
- 5.4. Market Analysis, Insights and Forecast - by Business model
- 5.4.1. Free-to-play
- 5.4.2. subscription-based
- 5.4.3. Pay-to-play
- 5.5. Market Analysis, Insights and Forecast - by Region
- 5.5.1. North America
- 5.5.2. South America
- 5.5.3. Europe
- 5.5.4. Middle East & Africa
- 5.5.5. Asia Pacific
- 5.1. Market Analysis, Insights and Forecast - by Types
- 6. Global US Video Game Industry Analysis, Insights and Forecast, 2021-2033
- 6.1. Market Analysis, Insights and Forecast - by Types
- 6.1.1. Mobile G
- 6.1.2. Console Gaming
- 6.1.3. PC Browser/Downloaded
- 6.2. Market Analysis, Insights and Forecast - by Genre
- 6.2.1. Action
- 6.2.2. Adventure
- 6.2.3. Role-playing
- 6.2.4. Strategy
- 6.2.5. Simulation
- 6.2.6. sports
- 6.3. Market Analysis, Insights and Forecast - by Platform
- 6.3.1. PC
- 6.3.2. console
- 6.3.3. Mobile device
- 6.4. Market Analysis, Insights and Forecast - by Business model
- 6.4.1. Free-to-play
- 6.4.2. subscription-based
- 6.4.3. Pay-to-play
- 6.1. Market Analysis, Insights and Forecast - by Types
- 7. North America US Video Game Industry Analysis, Insights and Forecast, 2020-2032
- 7.1. Market Analysis, Insights and Forecast - by Types
- 7.1.1. Mobile G
- 7.1.2. Console Gaming
- 7.1.3. PC Browser/Downloaded
- 7.2. Market Analysis, Insights and Forecast - by Genre
- 7.2.1. Action
- 7.2.2. Adventure
- 7.2.3. Role-playing
- 7.2.4. Strategy
- 7.2.5. Simulation
- 7.2.6. sports
- 7.3. Market Analysis, Insights and Forecast - by Platform
- 7.3.1. PC
- 7.3.2. console
- 7.3.3. Mobile device
- 7.4. Market Analysis, Insights and Forecast - by Business model
- 7.4.1. Free-to-play
- 7.4.2. subscription-based
- 7.4.3. Pay-to-play
- 7.1. Market Analysis, Insights and Forecast - by Types
- 8. South America US Video Game Industry Analysis, Insights and Forecast, 2020-2032
- 8.1. Market Analysis, Insights and Forecast - by Types
- 8.1.1. Mobile G
- 8.1.2. Console Gaming
- 8.1.3. PC Browser/Downloaded
- 8.2. Market Analysis, Insights and Forecast - by Genre
- 8.2.1. Action
- 8.2.2. Adventure
- 8.2.3. Role-playing
- 8.2.4. Strategy
- 8.2.5. Simulation
- 8.2.6. sports
- 8.3. Market Analysis, Insights and Forecast - by Platform
- 8.3.1. PC
- 8.3.2. console
- 8.3.3. Mobile device
- 8.4. Market Analysis, Insights and Forecast - by Business model
- 8.4.1. Free-to-play
- 8.4.2. subscription-based
- 8.4.3. Pay-to-play
- 8.1. Market Analysis, Insights and Forecast - by Types
- 9. Europe US Video Game Industry Analysis, Insights and Forecast, 2020-2032
- 9.1. Market Analysis, Insights and Forecast - by Types
- 9.1.1. Mobile G
- 9.1.2. Console Gaming
- 9.1.3. PC Browser/Downloaded
- 9.2. Market Analysis, Insights and Forecast - by Genre
- 9.2.1. Action
- 9.2.2. Adventure
- 9.2.3. Role-playing
- 9.2.4. Strategy
- 9.2.5. Simulation
- 9.2.6. sports
- 9.3. Market Analysis, Insights and Forecast - by Platform
- 9.3.1. PC
- 9.3.2. console
- 9.3.3. Mobile device
- 9.4. Market Analysis, Insights and Forecast - by Business model
- 9.4.1. Free-to-play
- 9.4.2. subscription-based
- 9.4.3. Pay-to-play
- 9.1. Market Analysis, Insights and Forecast - by Types
- 10. Middle East & Africa US Video Game Industry Analysis, Insights and Forecast, 2020-2032
- 10.1. Market Analysis, Insights and Forecast - by Types
- 10.1.1. Mobile G
- 10.1.2. Console Gaming
- 10.1.3. PC Browser/Downloaded
- 10.2. Market Analysis, Insights and Forecast - by Genre
- 10.2.1. Action
- 10.2.2. Adventure
- 10.2.3. Role-playing
- 10.2.4. Strategy
- 10.2.5. Simulation
- 10.2.6. sports
- 10.3. Market Analysis, Insights and Forecast - by Platform
- 10.3.1. PC
- 10.3.2. console
- 10.3.3. Mobile device
- 10.4. Market Analysis, Insights and Forecast - by Business model
- 10.4.1. Free-to-play
- 10.4.2. subscription-based
- 10.4.3. Pay-to-play
- 10.1. Market Analysis, Insights and Forecast - by Types
- 11. Asia Pacific US Video Game Industry Analysis, Insights and Forecast, 2020-2032
- 11.1. Market Analysis, Insights and Forecast - by Types
- 11.1.1. Mobile G
- 11.1.2. Console Gaming
- 11.1.3. PC Browser/Downloaded
- 11.2. Market Analysis, Insights and Forecast - by Genre
- 11.2.1. Action
- 11.2.2. Adventure
- 11.2.3. Role-playing
- 11.2.4. Strategy
- 11.2.5. Simulation
- 11.2.6. sports
- 11.3. Market Analysis, Insights and Forecast - by Platform
- 11.3.1. PC
- 11.3.2. console
- 11.3.3. Mobile device
- 11.4. Market Analysis, Insights and Forecast - by Business model
- 11.4.1. Free-to-play
- 11.4.2. subscription-based
- 11.4.3. Pay-to-play
- 11.1. Market Analysis, Insights and Forecast - by Types
- 12. Competitive Analysis
- 12.1. Company Profiles
- 12.1.1 Zynga Inc
- 12.1.1.1. Company Overview
- 12.1.1.2. Products
- 12.1.1.3. Company Financials
- 12.1.1.4. SWOT Analysis
- 12.1.2 Electronic Arts Inc
- 12.1.2.1. Company Overview
- 12.1.2.2. Products
- 12.1.2.3. Company Financials
- 12.1.2.4. SWOT Analysis
- 12.1.3 BioWare
- 12.1.3.1. Company Overview
- 12.1.3.2. Products
- 12.1.3.3. Company Financials
- 12.1.3.4. SWOT Analysis
- 12.1.4 Activision Blizzard Inc
- 12.1.4.1. Company Overview
- 12.1.4.2. Products
- 12.1.4.3. Company Financials
- 12.1.4.4. SWOT Analysis
- 12.1.5 Microsoft Corporation
- 12.1.5.1. Company Overview
- 12.1.5.2. Products
- 12.1.5.3. Company Financials
- 12.1.5.4. SWOT Analysis
- 12.1.6 Valve Corporation
- 12.1.6.1. Company Overview
- 12.1.6.2. Products
- 12.1.6.3. Company Financials
- 12.1.6.4. SWOT Analysis
- 12.1.7 Ubisoft Entertainment SA
- 12.1.7.1. Company Overview
- 12.1.7.2. Products
- 12.1.7.3. Company Financials
- 12.1.7.4. SWOT Analysis
- 12.1.8 Nintendo Co Ltd
- 12.1.8.1. Company Overview
- 12.1.8.2. Products
- 12.1.8.3. Company Financials
- 12.1.8.4. SWOT Analysis
- 12.1.9 Take-Two Interactive Software Inc
- 12.1.9.1. Company Overview
- 12.1.9.2. Products
- 12.1.9.3. Company Financials
- 12.1.9.4. SWOT Analysis
- 12.1.10 Sony Corporation
- 12.1.10.1. Company Overview
- 12.1.10.2. Products
- 12.1.10.3. Company Financials
- 12.1.10.4. SWOT Analysis
- 12.1.1 Zynga Inc
- 12.2. Market Entropy
- 12.2.1 Company's Key Areas Served
- 12.2.2 Recent Developments
- 12.3. Company Market Share Analysis 2025
- 12.3.1 Top 5 Companies Market Share Analysis
- 12.3.2 Top 3 Companies Market Share Analysis
- 12.4. List of Potential Customers
- 13. Research Methodology
List of Figures
- Figure 1: Global US Video Game Industry Revenue Breakdown (Million, %) by Region 2025 & 2033
- Figure 2: Global US Video Game Industry Volume Breakdown (K Unit, %) by Region 2025 & 2033
- Figure 3: North America US Video Game Industry Revenue (Million), by Types 2025 & 2033
- Figure 4: North America US Video Game Industry Volume (K Unit), by Types 2025 & 2033
- Figure 5: North America US Video Game Industry Revenue Share (%), by Types 2025 & 2033
- Figure 6: North America US Video Game Industry Volume Share (%), by Types 2025 & 2033
- Figure 7: North America US Video Game Industry Revenue (Million), by Genre 2025 & 2033
- Figure 8: North America US Video Game Industry Volume (K Unit), by Genre 2025 & 2033
- Figure 9: North America US Video Game Industry Revenue Share (%), by Genre 2025 & 2033
- Figure 10: North America US Video Game Industry Volume Share (%), by Genre 2025 & 2033
- Figure 11: North America US Video Game Industry Revenue (Million), by Platform 2025 & 2033
- Figure 12: North America US Video Game Industry Volume (K Unit), by Platform 2025 & 2033
- Figure 13: North America US Video Game Industry Revenue Share (%), by Platform 2025 & 2033
- Figure 14: North America US Video Game Industry Volume Share (%), by Platform 2025 & 2033
- Figure 15: North America US Video Game Industry Revenue (Million), by Business model 2025 & 2033
- Figure 16: North America US Video Game Industry Volume (K Unit), by Business model 2025 & 2033
- Figure 17: North America US Video Game Industry Revenue Share (%), by Business model 2025 & 2033
- Figure 18: North America US Video Game Industry Volume Share (%), by Business model 2025 & 2033
- Figure 19: North America US Video Game Industry Revenue (Million), by Country 2025 & 2033
- Figure 20: North America US Video Game Industry Volume (K Unit), by Country 2025 & 2033
- Figure 21: North America US Video Game Industry Revenue Share (%), by Country 2025 & 2033
- Figure 22: North America US Video Game Industry Volume Share (%), by Country 2025 & 2033
- Figure 23: South America US Video Game Industry Revenue (Million), by Types 2025 & 2033
- Figure 24: South America US Video Game Industry Volume (K Unit), by Types 2025 & 2033
- Figure 25: South America US Video Game Industry Revenue Share (%), by Types 2025 & 2033
- Figure 26: South America US Video Game Industry Volume Share (%), by Types 2025 & 2033
- Figure 27: South America US Video Game Industry Revenue (Million), by Genre 2025 & 2033
- Figure 28: South America US Video Game Industry Volume (K Unit), by Genre 2025 & 2033
- Figure 29: South America US Video Game Industry Revenue Share (%), by Genre 2025 & 2033
- Figure 30: South America US Video Game Industry Volume Share (%), by Genre 2025 & 2033
- Figure 31: South America US Video Game Industry Revenue (Million), by Platform 2025 & 2033
- Figure 32: South America US Video Game Industry Volume (K Unit), by Platform 2025 & 2033
- Figure 33: South America US Video Game Industry Revenue Share (%), by Platform 2025 & 2033
- Figure 34: South America US Video Game Industry Volume Share (%), by Platform 2025 & 2033
- Figure 35: South America US Video Game Industry Revenue (Million), by Business model 2025 & 2033
- Figure 36: South America US Video Game Industry Volume (K Unit), by Business model 2025 & 2033
- Figure 37: South America US Video Game Industry Revenue Share (%), by Business model 2025 & 2033
- Figure 38: South America US Video Game Industry Volume Share (%), by Business model 2025 & 2033
- Figure 39: South America US Video Game Industry Revenue (Million), by Country 2025 & 2033
- Figure 40: South America US Video Game Industry Volume (K Unit), by Country 2025 & 2033
- Figure 41: South America US Video Game Industry Revenue Share (%), by Country 2025 & 2033
- Figure 42: South America US Video Game Industry Volume Share (%), by Country 2025 & 2033
- Figure 43: Europe US Video Game Industry Revenue (Million), by Types 2025 & 2033
- Figure 44: Europe US Video Game Industry Volume (K Unit), by Types 2025 & 2033
- Figure 45: Europe US Video Game Industry Revenue Share (%), by Types 2025 & 2033
- Figure 46: Europe US Video Game Industry Volume Share (%), by Types 2025 & 2033
- Figure 47: Europe US Video Game Industry Revenue (Million), by Genre 2025 & 2033
- Figure 48: Europe US Video Game Industry Volume (K Unit), by Genre 2025 & 2033
- Figure 49: Europe US Video Game Industry Revenue Share (%), by Genre 2025 & 2033
- Figure 50: Europe US Video Game Industry Volume Share (%), by Genre 2025 & 2033
- Figure 51: Europe US Video Game Industry Revenue (Million), by Platform 2025 & 2033
- Figure 52: Europe US Video Game Industry Volume (K Unit), by Platform 2025 & 2033
- Figure 53: Europe US Video Game Industry Revenue Share (%), by Platform 2025 & 2033
- Figure 54: Europe US Video Game Industry Volume Share (%), by Platform 2025 & 2033
- Figure 55: Europe US Video Game Industry Revenue (Million), by Business model 2025 & 2033
- Figure 56: Europe US Video Game Industry Volume (K Unit), by Business model 2025 & 2033
- Figure 57: Europe US Video Game Industry Revenue Share (%), by Business model 2025 & 2033
- Figure 58: Europe US Video Game Industry Volume Share (%), by Business model 2025 & 2033
- Figure 59: Europe US Video Game Industry Revenue (Million), by Country 2025 & 2033
- Figure 60: Europe US Video Game Industry Volume (K Unit), by Country 2025 & 2033
- Figure 61: Europe US Video Game Industry Revenue Share (%), by Country 2025 & 2033
- Figure 62: Europe US Video Game Industry Volume Share (%), by Country 2025 & 2033
- Figure 63: Middle East & Africa US Video Game Industry Revenue (Million), by Types 2025 & 2033
- Figure 64: Middle East & Africa US Video Game Industry Volume (K Unit), by Types 2025 & 2033
- Figure 65: Middle East & Africa US Video Game Industry Revenue Share (%), by Types 2025 & 2033
- Figure 66: Middle East & Africa US Video Game Industry Volume Share (%), by Types 2025 & 2033
- Figure 67: Middle East & Africa US Video Game Industry Revenue (Million), by Genre 2025 & 2033
- Figure 68: Middle East & Africa US Video Game Industry Volume (K Unit), by Genre 2025 & 2033
- Figure 69: Middle East & Africa US Video Game Industry Revenue Share (%), by Genre 2025 & 2033
- Figure 70: Middle East & Africa US Video Game Industry Volume Share (%), by Genre 2025 & 2033
- Figure 71: Middle East & Africa US Video Game Industry Revenue (Million), by Platform 2025 & 2033
- Figure 72: Middle East & Africa US Video Game Industry Volume (K Unit), by Platform 2025 & 2033
- Figure 73: Middle East & Africa US Video Game Industry Revenue Share (%), by Platform 2025 & 2033
- Figure 74: Middle East & Africa US Video Game Industry Volume Share (%), by Platform 2025 & 2033
- Figure 75: Middle East & Africa US Video Game Industry Revenue (Million), by Business model 2025 & 2033
- Figure 76: Middle East & Africa US Video Game Industry Volume (K Unit), by Business model 2025 & 2033
- Figure 77: Middle East & Africa US Video Game Industry Revenue Share (%), by Business model 2025 & 2033
- Figure 78: Middle East & Africa US Video Game Industry Volume Share (%), by Business model 2025 & 2033
- Figure 79: Middle East & Africa US Video Game Industry Revenue (Million), by Country 2025 & 2033
- Figure 80: Middle East & Africa US Video Game Industry Volume (K Unit), by Country 2025 & 2033
- Figure 81: Middle East & Africa US Video Game Industry Revenue Share (%), by Country 2025 & 2033
- Figure 82: Middle East & Africa US Video Game Industry Volume Share (%), by Country 2025 & 2033
- Figure 83: Asia Pacific US Video Game Industry Revenue (Million), by Types 2025 & 2033
- Figure 84: Asia Pacific US Video Game Industry Volume (K Unit), by Types 2025 & 2033
- Figure 85: Asia Pacific US Video Game Industry Revenue Share (%), by Types 2025 & 2033
- Figure 86: Asia Pacific US Video Game Industry Volume Share (%), by Types 2025 & 2033
- Figure 87: Asia Pacific US Video Game Industry Revenue (Million), by Genre 2025 & 2033
- Figure 88: Asia Pacific US Video Game Industry Volume (K Unit), by Genre 2025 & 2033
- Figure 89: Asia Pacific US Video Game Industry Revenue Share (%), by Genre 2025 & 2033
- Figure 90: Asia Pacific US Video Game Industry Volume Share (%), by Genre 2025 & 2033
- Figure 91: Asia Pacific US Video Game Industry Revenue (Million), by Platform 2025 & 2033
- Figure 92: Asia Pacific US Video Game Industry Volume (K Unit), by Platform 2025 & 2033
- Figure 93: Asia Pacific US Video Game Industry Revenue Share (%), by Platform 2025 & 2033
- Figure 94: Asia Pacific US Video Game Industry Volume Share (%), by Platform 2025 & 2033
- Figure 95: Asia Pacific US Video Game Industry Revenue (Million), by Business model 2025 & 2033
- Figure 96: Asia Pacific US Video Game Industry Volume (K Unit), by Business model 2025 & 2033
- Figure 97: Asia Pacific US Video Game Industry Revenue Share (%), by Business model 2025 & 2033
- Figure 98: Asia Pacific US Video Game Industry Volume Share (%), by Business model 2025 & 2033
- Figure 99: Asia Pacific US Video Game Industry Revenue (Million), by Country 2025 & 2033
- Figure 100: Asia Pacific US Video Game Industry Volume (K Unit), by Country 2025 & 2033
- Figure 101: Asia Pacific US Video Game Industry Revenue Share (%), by Country 2025 & 2033
- Figure 102: Asia Pacific US Video Game Industry Volume Share (%), by Country 2025 & 2033
List of Tables
- Table 1: Global US Video Game Industry Revenue Million Forecast, by Types 2020 & 2033
- Table 2: Global US Video Game Industry Volume K Unit Forecast, by Types 2020 & 2033
- Table 3: Global US Video Game Industry Revenue Million Forecast, by Genre 2020 & 2033
- Table 4: Global US Video Game Industry Volume K Unit Forecast, by Genre 2020 & 2033
- Table 5: Global US Video Game Industry Revenue Million Forecast, by Platform 2020 & 2033
- Table 6: Global US Video Game Industry Volume K Unit Forecast, by Platform 2020 & 2033
- Table 7: Global US Video Game Industry Revenue Million Forecast, by Business model 2020 & 2033
- Table 8: Global US Video Game Industry Volume K Unit Forecast, by Business model 2020 & 2033
- Table 9: Global US Video Game Industry Revenue Million Forecast, by Region 2020 & 2033
- Table 10: Global US Video Game Industry Volume K Unit Forecast, by Region 2020 & 2033
- Table 11: Global US Video Game Industry Revenue Million Forecast, by Types 2020 & 2033
- Table 12: Global US Video Game Industry Volume K Unit Forecast, by Types 2020 & 2033
- Table 13: Global US Video Game Industry Revenue Million Forecast, by Genre 2020 & 2033
- Table 14: Global US Video Game Industry Volume K Unit Forecast, by Genre 2020 & 2033
- Table 15: Global US Video Game Industry Revenue Million Forecast, by Platform 2020 & 2033
- Table 16: Global US Video Game Industry Volume K Unit Forecast, by Platform 2020 & 2033
- Table 17: Global US Video Game Industry Revenue Million Forecast, by Business model 2020 & 2033
- Table 18: Global US Video Game Industry Volume K Unit Forecast, by Business model 2020 & 2033
- Table 19: Global US Video Game Industry Revenue Million Forecast, by Country 2020 & 2033
- Table 20: Global US Video Game Industry Volume K Unit Forecast, by Country 2020 & 2033
- Table 21: United States US Video Game Industry Revenue (Million) Forecast, by Application 2020 & 2033
- Table 22: United States US Video Game Industry Volume (K Unit) Forecast, by Application 2020 & 2033
- Table 23: Canada US Video Game Industry Revenue (Million) Forecast, by Application 2020 & 2033
- Table 24: Canada US Video Game Industry Volume (K Unit) Forecast, by Application 2020 & 2033
- Table 25: Mexico US Video Game Industry Revenue (Million) Forecast, by Application 2020 & 2033
- Table 26: Mexico US Video Game Industry Volume (K Unit) Forecast, by Application 2020 & 2033
- Table 27: Global US Video Game Industry Revenue Million Forecast, by Types 2020 & 2033
- Table 28: Global US Video Game Industry Volume K Unit Forecast, by Types 2020 & 2033
- Table 29: Global US Video Game Industry Revenue Million Forecast, by Genre 2020 & 2033
- Table 30: Global US Video Game Industry Volume K Unit Forecast, by Genre 2020 & 2033
- Table 31: Global US Video Game Industry Revenue Million Forecast, by Platform 2020 & 2033
- Table 32: Global US Video Game Industry Volume K Unit Forecast, by Platform 2020 & 2033
- Table 33: Global US Video Game Industry Revenue Million Forecast, by Business model 2020 & 2033
- Table 34: Global US Video Game Industry Volume K Unit Forecast, by Business model 2020 & 2033
- Table 35: Global US Video Game Industry Revenue Million Forecast, by Country 2020 & 2033
- Table 36: Global US Video Game Industry Volume K Unit Forecast, by Country 2020 & 2033
- Table 37: Brazil US Video Game Industry Revenue (Million) Forecast, by Application 2020 & 2033
- Table 38: Brazil US Video Game Industry Volume (K Unit) Forecast, by Application 2020 & 2033
- Table 39: Argentina US Video Game Industry Revenue (Million) Forecast, by Application 2020 & 2033
- Table 40: Argentina US Video Game Industry Volume (K Unit) Forecast, by Application 2020 & 2033
- Table 41: Rest of South America US Video Game Industry Revenue (Million) Forecast, by Application 2020 & 2033
- Table 42: Rest of South America US Video Game Industry Volume (K Unit) Forecast, by Application 2020 & 2033
- Table 43: Global US Video Game Industry Revenue Million Forecast, by Types 2020 & 2033
- Table 44: Global US Video Game Industry Volume K Unit Forecast, by Types 2020 & 2033
- Table 45: Global US Video Game Industry Revenue Million Forecast, by Genre 2020 & 2033
- Table 46: Global US Video Game Industry Volume K Unit Forecast, by Genre 2020 & 2033
- Table 47: Global US Video Game Industry Revenue Million Forecast, by Platform 2020 & 2033
- Table 48: Global US Video Game Industry Volume K Unit Forecast, by Platform 2020 & 2033
- Table 49: Global US Video Game Industry Revenue Million Forecast, by Business model 2020 & 2033
- Table 50: Global US Video Game Industry Volume K Unit Forecast, by Business model 2020 & 2033
- Table 51: Global US Video Game Industry Revenue Million Forecast, by Country 2020 & 2033
- Table 52: Global US Video Game Industry Volume K Unit Forecast, by Country 2020 & 2033
- Table 53: United Kingdom US Video Game Industry Revenue (Million) Forecast, by Application 2020 & 2033
- Table 54: United Kingdom US Video Game Industry Volume (K Unit) Forecast, by Application 2020 & 2033
- Table 55: Germany US Video Game Industry Revenue (Million) Forecast, by Application 2020 & 2033
- Table 56: Germany US Video Game Industry Volume (K Unit) Forecast, by Application 2020 & 2033
- Table 57: France US Video Game Industry Revenue (Million) Forecast, by Application 2020 & 2033
- Table 58: France US Video Game Industry Volume (K Unit) Forecast, by Application 2020 & 2033
- Table 59: Italy US Video Game Industry Revenue (Million) Forecast, by Application 2020 & 2033
- Table 60: Italy US Video Game Industry Volume (K Unit) Forecast, by Application 2020 & 2033
- Table 61: Spain US Video Game Industry Revenue (Million) Forecast, by Application 2020 & 2033
- Table 62: Spain US Video Game Industry Volume (K Unit) Forecast, by Application 2020 & 2033
- Table 63: Russia US Video Game Industry Revenue (Million) Forecast, by Application 2020 & 2033
- Table 64: Russia US Video Game Industry Volume (K Unit) Forecast, by Application 2020 & 2033
- Table 65: Benelux US Video Game Industry Revenue (Million) Forecast, by Application 2020 & 2033
- Table 66: Benelux US Video Game Industry Volume (K Unit) Forecast, by Application 2020 & 2033
- Table 67: Nordics US Video Game Industry Revenue (Million) Forecast, by Application 2020 & 2033
- Table 68: Nordics US Video Game Industry Volume (K Unit) Forecast, by Application 2020 & 2033
- Table 69: Rest of Europe US Video Game Industry Revenue (Million) Forecast, by Application 2020 & 2033
- Table 70: Rest of Europe US Video Game Industry Volume (K Unit) Forecast, by Application 2020 & 2033
- Table 71: Global US Video Game Industry Revenue Million Forecast, by Types 2020 & 2033
- Table 72: Global US Video Game Industry Volume K Unit Forecast, by Types 2020 & 2033
- Table 73: Global US Video Game Industry Revenue Million Forecast, by Genre 2020 & 2033
- Table 74: Global US Video Game Industry Volume K Unit Forecast, by Genre 2020 & 2033
- Table 75: Global US Video Game Industry Revenue Million Forecast, by Platform 2020 & 2033
- Table 76: Global US Video Game Industry Volume K Unit Forecast, by Platform 2020 & 2033
- Table 77: Global US Video Game Industry Revenue Million Forecast, by Business model 2020 & 2033
- Table 78: Global US Video Game Industry Volume K Unit Forecast, by Business model 2020 & 2033
- Table 79: Global US Video Game Industry Revenue Million Forecast, by Country 2020 & 2033
- Table 80: Global US Video Game Industry Volume K Unit Forecast, by Country 2020 & 2033
- Table 81: Turkey US Video Game Industry Revenue (Million) Forecast, by Application 2020 & 2033
- Table 82: Turkey US Video Game Industry Volume (K Unit) Forecast, by Application 2020 & 2033
- Table 83: Israel US Video Game Industry Revenue (Million) Forecast, by Application 2020 & 2033
- Table 84: Israel US Video Game Industry Volume (K Unit) Forecast, by Application 2020 & 2033
- Table 85: GCC US Video Game Industry Revenue (Million) Forecast, by Application 2020 & 2033
- Table 86: GCC US Video Game Industry Volume (K Unit) Forecast, by Application 2020 & 2033
- Table 87: North Africa US Video Game Industry Revenue (Million) Forecast, by Application 2020 & 2033
- Table 88: North Africa US Video Game Industry Volume (K Unit) Forecast, by Application 2020 & 2033
- Table 89: South Africa US Video Game Industry Revenue (Million) Forecast, by Application 2020 & 2033
- Table 90: South Africa US Video Game Industry Volume (K Unit) Forecast, by Application 2020 & 2033
- Table 91: Rest of Middle East & Africa US Video Game Industry Revenue (Million) Forecast, by Application 2020 & 2033
- Table 92: Rest of Middle East & Africa US Video Game Industry Volume (K Unit) Forecast, by Application 2020 & 2033
- Table 93: Global US Video Game Industry Revenue Million Forecast, by Types 2020 & 2033
- Table 94: Global US Video Game Industry Volume K Unit Forecast, by Types 2020 & 2033
- Table 95: Global US Video Game Industry Revenue Million Forecast, by Genre 2020 & 2033
- Table 96: Global US Video Game Industry Volume K Unit Forecast, by Genre 2020 & 2033
- Table 97: Global US Video Game Industry Revenue Million Forecast, by Platform 2020 & 2033
- Table 98: Global US Video Game Industry Volume K Unit Forecast, by Platform 2020 & 2033
- Table 99: Global US Video Game Industry Revenue Million Forecast, by Business model 2020 & 2033
- Table 100: Global US Video Game Industry Volume K Unit Forecast, by Business model 2020 & 2033
- Table 101: Global US Video Game Industry Revenue Million Forecast, by Country 2020 & 2033
- Table 102: Global US Video Game Industry Volume K Unit Forecast, by Country 2020 & 2033
- Table 103: China US Video Game Industry Revenue (Million) Forecast, by Application 2020 & 2033
- Table 104: China US Video Game Industry Volume (K Unit) Forecast, by Application 2020 & 2033
- Table 105: India US Video Game Industry Revenue (Million) Forecast, by Application 2020 & 2033
- Table 106: India US Video Game Industry Volume (K Unit) Forecast, by Application 2020 & 2033
- Table 107: Japan US Video Game Industry Revenue (Million) Forecast, by Application 2020 & 2033
- Table 108: Japan US Video Game Industry Volume (K Unit) Forecast, by Application 2020 & 2033
- Table 109: South Korea US Video Game Industry Revenue (Million) Forecast, by Application 2020 & 2033
- Table 110: South Korea US Video Game Industry Volume (K Unit) Forecast, by Application 2020 & 2033
- Table 111: ASEAN US Video Game Industry Revenue (Million) Forecast, by Application 2020 & 2033
- Table 112: ASEAN US Video Game Industry Volume (K Unit) Forecast, by Application 2020 & 2033
- Table 113: Oceania US Video Game Industry Revenue (Million) Forecast, by Application 2020 & 2033
- Table 114: Oceania US Video Game Industry Volume (K Unit) Forecast, by Application 2020 & 2033
- Table 115: Rest of Asia Pacific US Video Game Industry Revenue (Million) Forecast, by Application 2020 & 2033
- Table 116: Rest of Asia Pacific US Video Game Industry Volume (K Unit) Forecast, by Application 2020 & 2033
Frequently Asked Questions
1. What is the projected Compound Annual Growth Rate (CAGR) of the US Video Game Industry?
The projected CAGR is approximately 9.41%.
2. Which companies are prominent players in the US Video Game Industry?
Key companies in the market include Zynga Inc, Electronic Arts Inc, BioWare, Activision Blizzard Inc, Microsoft Corporation, Valve Corporation, Ubisoft Entertainment SA, Nintendo Co Ltd, Take-Two Interactive Software Inc, Sony Corporation.
3. What are the main segments of the US Video Game Industry?
The market segments include Types, Genre, Platform, Business model.
4. Can you provide details about the market size?
The market size is estimated to be USD 57.91 Million as of 2022.
5. What are some drivers contributing to market growth?
Growing Cloud Gaming subscriptions; Increasing trend fpr PVP format.
6. What are the notable trends driving market growth?
Mobile Gaming Segment Expected to Dominate the Market.
7. Are there any restraints impacting market growth?
Huge capital investments in R&D.
8. Can you provide examples of recent developments in the market?
May 2022: Electronic Arts has partnered with Middle-earth Enterprises, a division of The Saul Zaentz Company, to develop a new free-to-play mobile game. The Lord of the Rings: Heroes of Middle-earth is a Collectible Role-Playing Game (RPG) that brings the fantasy and adventure of The Lord of the Rings to existing fans and new audiences alike in a strategic, social-competitive experience.
9. What pricing options are available for accessing the report?
Pricing options include single-user, multi-user, and enterprise licenses priced at USD 3800, USD 4500, and USD 5800 respectively.
10. Is the market size provided in terms of value or volume?
The market size is provided in terms of value, measured in Million and volume, measured in K Unit.
11. Are there any specific market keywords associated with the report?
Yes, the market keyword associated with the report is "US Video Game Industry," which aids in identifying and referencing the specific market segment covered.
12. How do I determine which pricing option suits my needs best?
The pricing options vary based on user requirements and access needs. Individual users may opt for single-user licenses, while businesses requiring broader access may choose multi-user or enterprise licenses for cost-effective access to the report.
13. Are there any additional resources or data provided in the US Video Game Industry report?
While the report offers comprehensive insights, it's advisable to review the specific contents or supplementary materials provided to ascertain if additional resources or data are available.
14. How can I stay updated on further developments or reports in the US Video Game Industry?
To stay informed about further developments, trends, and reports in the US Video Game Industry, consider subscribing to industry newsletters, following relevant companies and organizations, or regularly checking reputable industry news sources and publications.
Methodology
Step 1 - Identification of Relevant Samples Size from Population Database


Step 2 - Approaches for Defining Global Market Size (Value, Volume* & Price*)

Note*: In applicable scenarios
Step 3 - Data Sources
Primary Research
- Web Analytics
- Survey Reports
- Research Institute
- Latest Research Reports
- Opinion Leaders
Secondary Research
- Annual Reports
- White Paper
- Latest Press Release
- Industry Association
- Paid Database
- Investor Presentations

Step 4 - Data Triangulation
Involves using different sources of information in order to increase the validity of a study
These sources are likely to be stakeholders in a program - participants, other researchers, program staff, other community members, and so on.
Then we put all data in single framework & apply various statistical tools to find out the dynamic on the market.
During the analysis stage, feedback from the stakeholder groups would be compared to determine areas of agreement as well as areas of divergence