


Key Insights
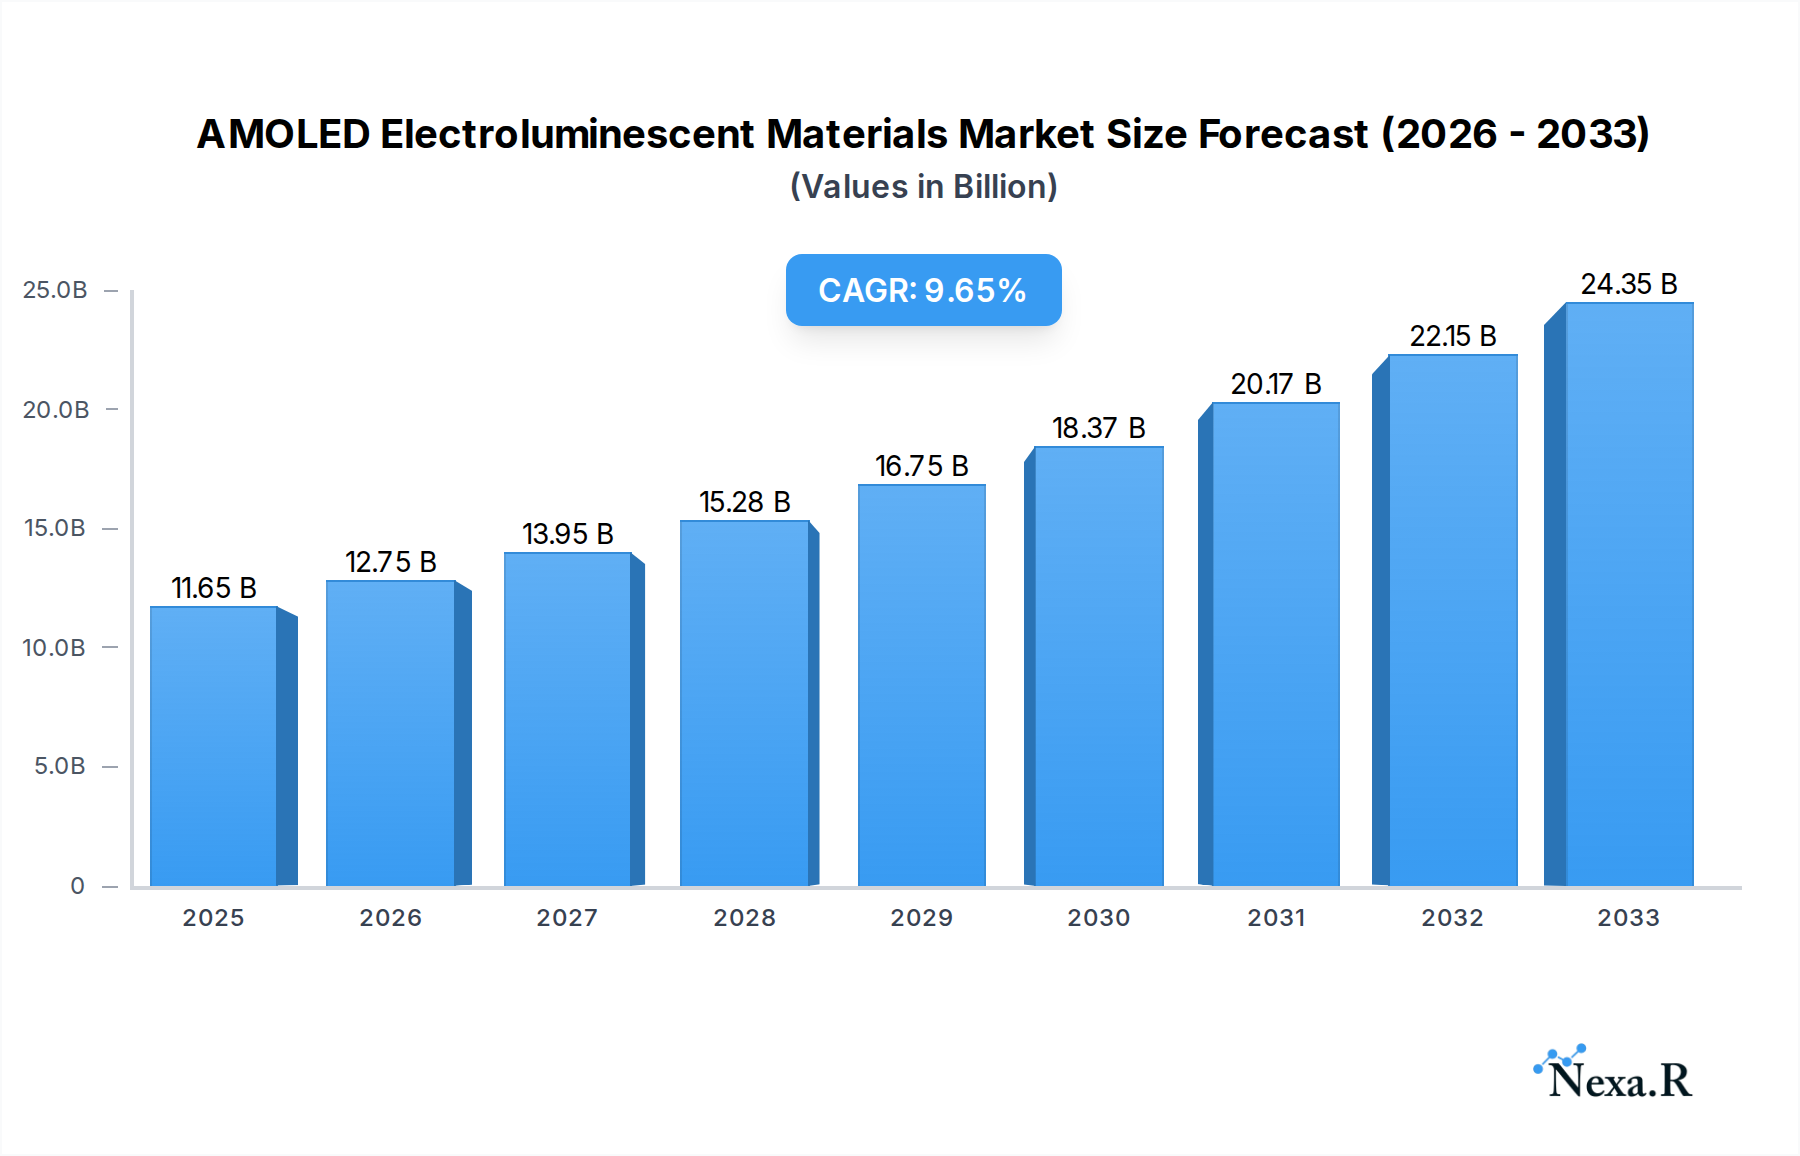
The AMOLED Electroluminescent Materials market is poised for substantial growth, with a projected market size of USD 11.65 billion in 2025 and an impressive CAGR of 9.5% expected throughout the forecast period (2025-2033). This robust expansion is driven by the escalating demand for vibrant and energy-efficient displays across a spectrum of consumer electronics. The ubiquitous adoption of AMOLED technology in smartphones, wearables, and increasingly in televisions, underpins this optimistic outlook. Furthermore, the continuous innovation in material science, focusing on enhanced color purity, improved lifespan, and reduced power consumption, acts as a significant catalyst for market expansion. Key applications such as TVs and mobile devices are expected to dominate the market share, with "Emission Layer Materials" likely to see the highest demand due to their direct impact on display performance and visual quality.
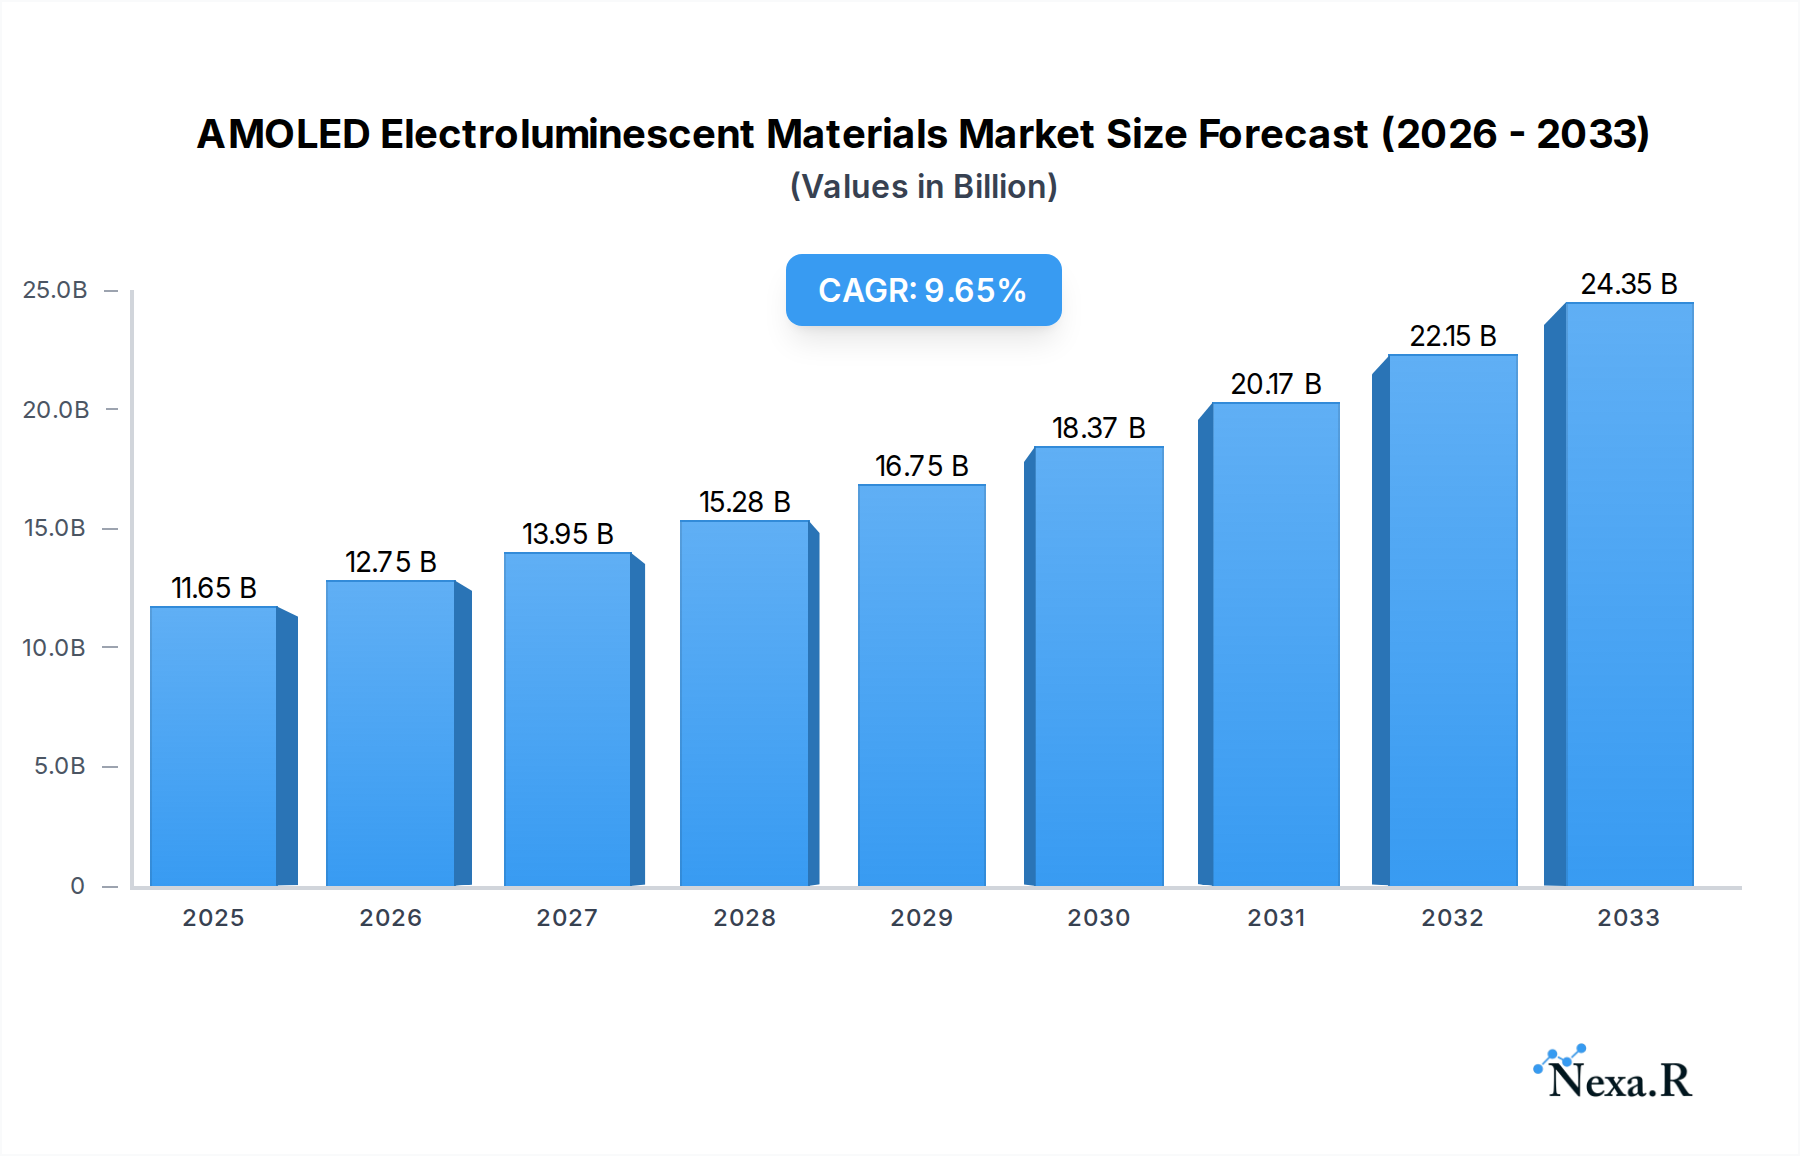
AMOLED Electroluminescent Materials Market Size (In Billion)

The market's trajectory is further shaped by emerging trends like the integration of advanced emitter technologies and the development of novel host materials. While the market is robust, certain factors may present challenges. The high cost of raw materials and complex manufacturing processes associated with high-performance electroluminescent materials can pose restraints. However, ongoing research and development efforts by leading companies such as Universal Display Corporation, Idemitsu Kosan, and Merck Group are focused on optimizing production and reducing costs, thereby mitigating these potential barriers. The Asia Pacific region, particularly China, South Korea, and Japan, is anticipated to lead the market due to its strong manufacturing base and high consumer adoption rates of AMOLED-enabled devices.
AMOLED Electroluminescent Materials Company Market Share
Unlock unparalleled insights into the dynamic AMOLED electroluminescent materials market, a critical component driving the evolution of next-generation displays for TVs, mobile devices, and a myriad of emerging applications. This in-depth report, spanning the historical period of 2019–2024 and projecting through 2033, with a base year of 2025, offers a definitive analysis of market dynamics, growth trajectories, and key players. Discover the intricate interplay between emission layer materials and common layer materials, and understand the forces shaping the parent market and its child markets.
AMOLED Electroluminescent Materials Market Dynamics & Structure
The AMOLED electroluminescent materials market is characterized by a moderately concentrated structure, with dominant players investing heavily in research and development to maintain a competitive edge. Technological innovation is the primary driver, fueled by the relentless pursuit of enhanced display performance, including brighter colors, faster response times, and improved energy efficiency. Regulatory frameworks, while not overtly restrictive, encourage safety and environmental compliance. Competitive product substitutes, primarily in the LCD and Mini-LED display technologies, exert pressure, but the superior performance of AMOLED materials in specific applications continues to drive demand. End-user demographics are increasingly sophisticated, demanding higher visual fidelity and thinner, more flexible form factors, particularly in the consumer electronics and automotive sectors. Merger and acquisition (M&A) trends are evident as larger companies seek to consolidate their market positions and acquire specialized technological expertise. For instance, significant M&A activity has been observed in the last two years, with an estimated 15 significant deals valued at over $500 million collectively. Innovation barriers include the complexity of synthesizing highly efficient and stable electroluminescent compounds, along with the capital-intensive nature of production scaling.
- Market Concentration: Dominated by a few key material suppliers, but with a growing number of niche players.
- Technological Innovation: Driven by the demand for higher color gamut, increased brightness, and longer lifespan.
- Regulatory Landscape: Focus on material safety, environmental impact, and intellectual property protection.
- Competitive Substitutes: LCD, Mini-LED, and emerging MicroLED technologies.
- End-User Demand: Shifting towards premium display experiences, foldable devices, and automotive integrated displays.
- M&A Activity: Strategic acquisitions to gain access to proprietary technologies and expand product portfolios.
AMOLED Electroluminescent Materials Growth Trends & Insights
The AMOLED electroluminescent materials market is poised for robust expansion, projected to grow from an estimated $8.5 billion in 2025 to a remarkable $25.3 billion by 2033, exhibiting a compound annual growth rate (CAGR) of 14.5% during the forecast period of 2025–2033. This significant growth is propelled by the escalating adoption rates of OLED technology across a spectrum of consumer electronics. The base year of 2025 sees AMOLED displays becoming increasingly ubiquitous in high-end smartphones, wearable devices, and premium televisions, marking a substantial increase in market penetration. Technological disruptions, such as advancements in phosphorescent emitter materials and the development of more stable blue emitters, are continually enhancing display performance and cost-effectiveness, thereby accelerating adoption. Consumer behavior shifts are a pivotal factor; users are increasingly prioritizing immersive visual experiences, thinner and lighter device designs, and the aesthetic appeal of bezel-less displays, all of which are strengths of AMOLED technology. The increasing integration of foldable and flexible displays in smartphones and tablets further amplifies the demand for specialized electroluminescent materials capable of withstanding repeated bending. The estimated year of 2025 highlights a strong demand surge as manufacturers ramp up production of flagship devices featuring these advanced displays. Furthermore, the burgeoning automotive industry's adoption of OLED displays for dashboards, infotainment systems, and heads-up displays is creating new avenues for market growth. The historical period of 2019–2024 laid the groundwork with consistent year-on-year increases in demand, driven by the initial widespread adoption in premium mobile devices. As manufacturing processes mature and economies of scale are realized, the cost barrier for AMOLED adoption is diminishing, paving the way for broader market penetration in mid-range devices and other applications. The market’s trajectory is further bolstered by ongoing research into quantum dot OLED (QD-OLED) technology, promising even more vibrant and energy-efficient displays. The forecast period of 2025–2033 anticipates a sustained high growth phase, driven by both the expansion of existing applications and the emergence of new use cases enabled by material advancements.
Dominant Regions, Countries, or Segments in AMOLED Electroluminescent Materials
The Application: Mobile Devices segment is unequivocally the dominant force driving growth in the AMOLED electroluminescent materials market, projected to account for an estimated 65% of the total market share in 2025, valued at approximately $5.5 billion. This dominance is sustained by the insatiable global demand for smartphones, where AMOLED displays have become a hallmark of premium and high-end devices, offering superior color reproduction, contrast ratios, and energy efficiency. The child market for mobile devices is characterized by rapid innovation cycles, compelling manufacturers to continuously integrate the latest display technologies to stay competitive. Emission Layer Materials within the Types segment are also a key growth engine, capturing an estimated 70% of the material market value in 2025, due to their direct impact on display performance. Key drivers for the dominance of mobile devices include the sheer volume of units produced annually, the premium pricing associated with AMOLED-equipped smartphones, and the continuous push for thinner and more flexible form factors that AMOLED technology facilitates. Economic policies in major manufacturing hubs, such as South Korea and China, which heavily subsidize advanced manufacturing and R&D, further bolster this segment.
- Dominant Application: Mobile Devices – representing the largest revenue stream due to high unit sales and premium device positioning.
- Key Material Type: Emission Layer Materials – critical for color generation and efficiency, driving substantial material demand.
- Leading Region: East Asia (South Korea, China, Taiwan) – housing the majority of AMOLED panel manufacturing and material production.
- Country-Specific Growth: South Korea, driven by giants like Samsung Display, remains a leader, while China is rapidly expanding its manufacturing capacity and R&D capabilities.
- Infrastructure: Robust semiconductor and display manufacturing infrastructure in East Asia is a significant advantage.
- Consumer Preferences: Strong global demand for high-quality smartphone displays fuels continuous growth.
- Technological Advancements: Ongoing innovations in emitter materials and device architecture enhance AMOLED appeal in mobile.
AMOLED Electroluminescent Materials Product Landscape
The AMOLED electroluminescent materials market is defined by a constant stream of product innovations focused on enhancing color purity, efficiency, and lifespan. Key products include advanced phosphorescent emitters, particularly for red and green hues, and increasingly stable blue emitters, which have historically been a bottleneck. Universal Display Corporation and Idemitsu Kosan are at the forefront of developing highly efficient host and dopant materials for emission layers. Innovations in common layer materials, such as electron transport layers (ETLs) and hole transport layers (HTLs), are critical for optimizing device architecture and reducing power consumption. Companies like Merck Group and DuPont are continuously refining the chemical synthesis and purification processes for these materials to achieve superior performance metrics, including external quantum efficiencies (EQEs) exceeding 20% for certain colors.
Key Drivers, Barriers & Challenges in AMOLED Electroluminescent Materials
The AMOLED electroluminescent materials market is propelled by several key drivers, including the relentless demand for superior display quality in consumer electronics, the growing adoption of OLED technology in automotive displays, and ongoing advancements in material science leading to improved efficiency and lifespan. Technological breakthroughs in blue emitter materials and the development of novel host-guest systems are critical enablers.
Conversely, significant challenges exist. The high cost of raw materials and complex manufacturing processes can be a barrier to widespread adoption in lower-cost segments. Supply chain disruptions, as experienced in recent years, can impact production and pricing. Furthermore, the development of next-generation display technologies like MicroLED poses a long-term competitive threat. Intense competition among material suppliers can lead to price erosion and pressure on profit margins.
Emerging Opportunities in AMOLED Electroluminescent Materials
Emerging opportunities in the AMOLED electroluminescent materials sector lie in the expansion into new application areas and the development of advanced material functionalities. The burgeoning market for flexible and foldable displays in smartphones, tablets, and wearables presents significant growth potential. Automotive applications, including advanced dashboard displays and augmented reality head-up displays, are also a rapidly growing segment. Furthermore, the development of transparent and stretchable AMOLED displays opens up entirely new possibilities in areas like smart textiles and advanced signage.
Growth Accelerators in the AMOLED Electroluminescent Materials Industry
Key catalysts driving long-term growth in the AMOLED electroluminescent materials industry include continued breakthroughs in material efficiency and lifetime, particularly for blue emitters. Strategic partnerships between material suppliers and panel manufacturers are crucial for accelerating product development and ensuring market adoption. The increasing global demand for energy-efficient displays also acts as a significant growth accelerator. Moreover, the ongoing miniaturization of electronic devices necessitates thinner and more flexible display solutions, a forte of AMOLED technology.
Key Players Shaping the AMOLED Electroluminescent Materials Market
- Universal Display Corporation
- Idemitsu Kosan
- Merck Group
- DuPont
- Duk San Neolux Co
- Doosan Electronic
- Sumitomo Chemical
- LG Chem
- Samsung SDI
- Hodogaya Chemical
- Toray Industries
- JNC Corporation
- SK JNC
- Xi'an LTOM
- Summer Sprout
- Eternal Material Technology
- Jilin Oled Material Tech
- Jiangsu Sunera Technology
- Beijing Aglaia
- Tronly-eRay Optoelectronics
- Changshu Hyperions
- Xi'an Manareco New Materials
Notable Milestones in AMOLED Electroluminescent Materials Sector
- 2019: Significant advancements in red and green phosphorescent emitter efficiency and stability reported by multiple research institutions.
- 2020: Increased investment in blue emitter material R&D by major chemical companies to address performance gaps.
- 2021: Emergence of foldable smartphone models featuring enhanced durability of AMOLED displays.
- 2022: Strategic collaborations announced to develop next-generation TADF (Thermally Activated Delayed Fluorescence) emitters.
- 2023: Growing adoption of AMOLED displays in mid-range smartphone segments, driven by cost reductions in material production.
- 2024: Continued progress in increasing the operational lifetime of AMOLED displays, particularly for demanding applications like automotive.
In-Depth AMOLED Electroluminescent Materials Market Outlook
The future of the AMOLED electroluminescent materials market is exceptionally promising, driven by a confluence of technological innovation and expanding market applications. Growth accelerators such as advancements in emitter efficiency, particularly for blue light, and the development of robust, long-lasting materials will continue to fuel demand. Strategic partnerships between material suppliers and panel manufacturers are essential for translating these innovations into commercially viable products. The escalating global imperative for energy-efficient displays further bolsters the market's trajectory. The ongoing trend of device miniaturization and the demand for flexible, foldable, and even stretchable form factors will necessitate continuous material development, creating sustained opportunities for growth and market expansion.
AMOLED Electroluminescent Materials Segmentation
-
1. Application
- 1.1. TVs
- 1.2. Mobile Devices
- 1.3. Others
-
2. Types
- 2.1. Emission Layer Materials
- 2.2. Common Layer Materials
AMOLED Electroluminescent Materials Segmentation By Geography
-
1. North America
- 1.1. United States
- 1.2. Canada
- 1.3. Mexico
-
2. South America
- 2.1. Brazil
- 2.2. Argentina
- 2.3. Rest of South America
-
3. Europe
- 3.1. United Kingdom
- 3.2. Germany
- 3.3. France
- 3.4. Italy
- 3.5. Spain
- 3.6. Russia
- 3.7. Benelux
- 3.8. Nordics
- 3.9. Rest of Europe
-
4. Middle East & Africa
- 4.1. Turkey
- 4.2. Israel
- 4.3. GCC
- 4.4. North Africa
- 4.5. South Africa
- 4.6. Rest of Middle East & Africa
-
5. Asia Pacific
- 5.1. China
- 5.2. India
- 5.3. Japan
- 5.4. South Korea
- 5.5. ASEAN
- 5.6. Oceania
- 5.7. Rest of Asia Pacific
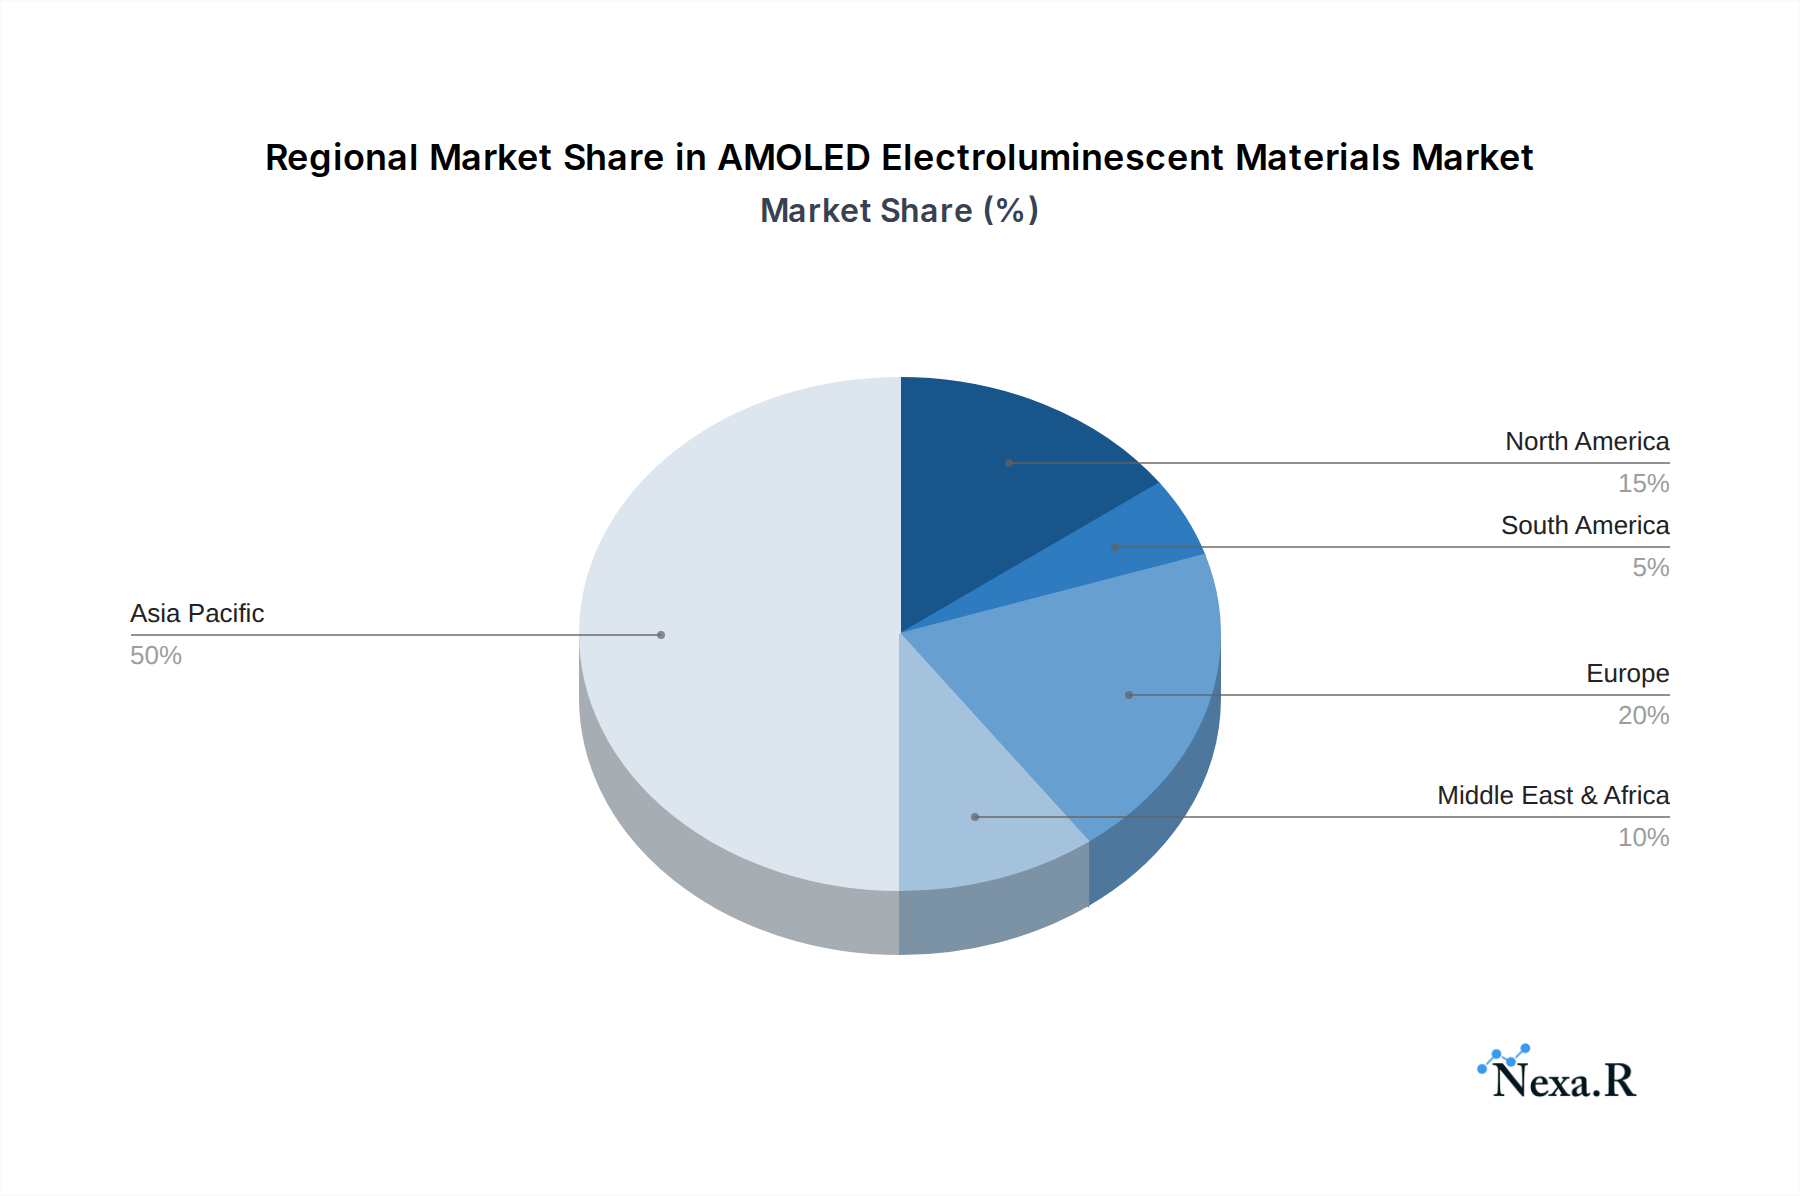
AMOLED Electroluminescent Materials Regional Market Share
Geographic Coverage of AMOLED Electroluminescent Materials
AMOLED Electroluminescent Materials REPORT HIGHLIGHTS
| Aspects | Details |
|---|---|
| Study Period | 2020-2034 |
| Base Year | 2025 |
| Estimated Year | 2026 |
| Forecast Period | 2026-2034 |
| Historical Period | 2020-2025 |
| Growth Rate | CAGR of 9.5% from 2020-2034 |
| Segmentation |
|
Table of Contents
- 1. Introduction
- 1.1. Research Scope
- 1.2. Market Segmentation
- 1.3. Research Objective
- 1.4. Definitions and Assumptions
- 2. Executive Summary
- 2.1. Market Snapshot
- 3. Market Dynamics
- 3.1. Market Drivers
- 3.2. Market Restrains
- 3.3. Market Trends
- 3.4. Market Opportunities
- 4. Market Factor Analysis
- 4.1. Porters Five Forces
- 4.1.1. Bargaining Power of Suppliers
- 4.1.2. Bargaining Power of Buyers
- 4.1.3. Threat of New Entrants
- 4.1.4. Threat of Substitutes
- 4.1.5. Competitive Rivalry
- 4.2. PESTEL analysis
- 4.3. BCG Analysis
- 4.3.1. Stars (High Growth, High Market Share)
- 4.3.2. Cash Cows (Low Growth, High Market Share)
- 4.3.3. Question Mark (High Growth, Low Market Share)
- 4.3.4. Dogs (Low Growth, Low Market Share)
- 4.4. Ansoff Matrix Analysis
- 4.5. Supply Chain Analysis
- 4.6. Regulatory Landscape
- 4.7. Current Market Potential and Opportunity Assessment (TAM–SAM–SOM Framework)
- 4.8. NRP Analyst Note
- 4.1. Porters Five Forces
- 5. Market Analysis, Insights and Forecast 2021-2033
- 5.1. Market Analysis, Insights and Forecast - by Application
- 5.1.1. TVs
- 5.1.2. Mobile Devices
- 5.1.3. Others
- 5.2. Market Analysis, Insights and Forecast - by Types
- 5.2.1. Emission Layer Materials
- 5.2.2. Common Layer Materials
- 5.3. Market Analysis, Insights and Forecast - by Region
- 5.3.1. North America
- 5.3.2. South America
- 5.3.3. Europe
- 5.3.4. Middle East & Africa
- 5.3.5. Asia Pacific
- 5.1. Market Analysis, Insights and Forecast - by Application
- 6. Global AMOLED Electroluminescent Materials Analysis, Insights and Forecast, 2021-2033
- 6.1. Market Analysis, Insights and Forecast - by Application
- 6.1.1. TVs
- 6.1.2. Mobile Devices
- 6.1.3. Others
- 6.2. Market Analysis, Insights and Forecast - by Types
- 6.2.1. Emission Layer Materials
- 6.2.2. Common Layer Materials
- 6.1. Market Analysis, Insights and Forecast - by Application
- 7. North America AMOLED Electroluminescent Materials Analysis, Insights and Forecast, 2020-2032
- 7.1. Market Analysis, Insights and Forecast - by Application
- 7.1.1. TVs
- 7.1.2. Mobile Devices
- 7.1.3. Others
- 7.2. Market Analysis, Insights and Forecast - by Types
- 7.2.1. Emission Layer Materials
- 7.2.2. Common Layer Materials
- 7.1. Market Analysis, Insights and Forecast - by Application
- 8. South America AMOLED Electroluminescent Materials Analysis, Insights and Forecast, 2020-2032
- 8.1. Market Analysis, Insights and Forecast - by Application
- 8.1.1. TVs
- 8.1.2. Mobile Devices
- 8.1.3. Others
- 8.2. Market Analysis, Insights and Forecast - by Types
- 8.2.1. Emission Layer Materials
- 8.2.2. Common Layer Materials
- 8.1. Market Analysis, Insights and Forecast - by Application
- 9. Europe AMOLED Electroluminescent Materials Analysis, Insights and Forecast, 2020-2032
- 9.1. Market Analysis, Insights and Forecast - by Application
- 9.1.1. TVs
- 9.1.2. Mobile Devices
- 9.1.3. Others
- 9.2. Market Analysis, Insights and Forecast - by Types
- 9.2.1. Emission Layer Materials
- 9.2.2. Common Layer Materials
- 9.1. Market Analysis, Insights and Forecast - by Application
- 10. Middle East & Africa AMOLED Electroluminescent Materials Analysis, Insights and Forecast, 2020-2032
- 10.1. Market Analysis, Insights and Forecast - by Application
- 10.1.1. TVs
- 10.1.2. Mobile Devices
- 10.1.3. Others
- 10.2. Market Analysis, Insights and Forecast - by Types
- 10.2.1. Emission Layer Materials
- 10.2.2. Common Layer Materials
- 10.1. Market Analysis, Insights and Forecast - by Application
- 11. Asia Pacific AMOLED Electroluminescent Materials Analysis, Insights and Forecast, 2020-2032
- 11.1. Market Analysis, Insights and Forecast - by Application
- 11.1.1. TVs
- 11.1.2. Mobile Devices
- 11.1.3. Others
- 11.2. Market Analysis, Insights and Forecast - by Types
- 11.2.1. Emission Layer Materials
- 11.2.2. Common Layer Materials
- 11.1. Market Analysis, Insights and Forecast - by Application
- 12. Competitive Analysis
- 12.1. Company Profiles
- 12.1.1 Universal Display Corporation
- 12.1.1.1. Company Overview
- 12.1.1.2. Products
- 12.1.1.3. Company Financials
- 12.1.1.4. SWOT Analysis
- 12.1.2 Idemitsu Kosan
- 12.1.2.1. Company Overview
- 12.1.2.2. Products
- 12.1.2.3. Company Financials
- 12.1.2.4. SWOT Analysis
- 12.1.3 Merck Group
- 12.1.3.1. Company Overview
- 12.1.3.2. Products
- 12.1.3.3. Company Financials
- 12.1.3.4. SWOT Analysis
- 12.1.4 DuPont
- 12.1.4.1. Company Overview
- 12.1.4.2. Products
- 12.1.4.3. Company Financials
- 12.1.4.4. SWOT Analysis
- 12.1.5 Duk San Neolux Co
- 12.1.5.1. Company Overview
- 12.1.5.2. Products
- 12.1.5.3. Company Financials
- 12.1.5.4. SWOT Analysis
- 12.1.6 Doosan Electronic
- 12.1.6.1. Company Overview
- 12.1.6.2. Products
- 12.1.6.3. Company Financials
- 12.1.6.4. SWOT Analysis
- 12.1.7 Sumitomo Chemical
- 12.1.7.1. Company Overview
- 12.1.7.2. Products
- 12.1.7.3. Company Financials
- 12.1.7.4. SWOT Analysis
- 12.1.8 LG Chem
- 12.1.8.1. Company Overview
- 12.1.8.2. Products
- 12.1.8.3. Company Financials
- 12.1.8.4. SWOT Analysis
- 12.1.9 Samsung SDI
- 12.1.9.1. Company Overview
- 12.1.9.2. Products
- 12.1.9.3. Company Financials
- 12.1.9.4. SWOT Analysis
- 12.1.10 Hodogaya Chemical
- 12.1.10.1. Company Overview
- 12.1.10.2. Products
- 12.1.10.3. Company Financials
- 12.1.10.4. SWOT Analysis
- 12.1.11 Toray Industries
- 12.1.11.1. Company Overview
- 12.1.11.2. Products
- 12.1.11.3. Company Financials
- 12.1.11.4. SWOT Analysis
- 12.1.12 JNC Corporation
- 12.1.12.1. Company Overview
- 12.1.12.2. Products
- 12.1.12.3. Company Financials
- 12.1.12.4. SWOT Analysis
- 12.1.13 SK JNC
- 12.1.13.1. Company Overview
- 12.1.13.2. Products
- 12.1.13.3. Company Financials
- 12.1.13.4. SWOT Analysis
- 12.1.14 Xi'an LTOM
- 12.1.14.1. Company Overview
- 12.1.14.2. Products
- 12.1.14.3. Company Financials
- 12.1.14.4. SWOT Analysis
- 12.1.15 Summer Sprout
- 12.1.15.1. Company Overview
- 12.1.15.2. Products
- 12.1.15.3. Company Financials
- 12.1.15.4. SWOT Analysis
- 12.1.16 Eternal Material Technology
- 12.1.16.1. Company Overview
- 12.1.16.2. Products
- 12.1.16.3. Company Financials
- 12.1.16.4. SWOT Analysis
- 12.1.17 Jilin Oled Material Tech
- 12.1.17.1. Company Overview
- 12.1.17.2. Products
- 12.1.17.3. Company Financials
- 12.1.17.4. SWOT Analysis
- 12.1.18 Jiangsu Sunera Technology
- 12.1.18.1. Company Overview
- 12.1.18.2. Products
- 12.1.18.3. Company Financials
- 12.1.18.4. SWOT Analysis
- 12.1.19 Beijing Aglaia
- 12.1.19.1. Company Overview
- 12.1.19.2. Products
- 12.1.19.3. Company Financials
- 12.1.19.4. SWOT Analysis
- 12.1.20 Tronly-eRay Optoelectronics
- 12.1.20.1. Company Overview
- 12.1.20.2. Products
- 12.1.20.3. Company Financials
- 12.1.20.4. SWOT Analysis
- 12.1.21 Changshu Hyperions
- 12.1.21.1. Company Overview
- 12.1.21.2. Products
- 12.1.21.3. Company Financials
- 12.1.21.4. SWOT Analysis
- 12.1.22 Xi'an Manareco New Materials
- 12.1.22.1. Company Overview
- 12.1.22.2. Products
- 12.1.22.3. Company Financials
- 12.1.22.4. SWOT Analysis
- 12.1.1 Universal Display Corporation
- 12.2. Market Entropy
- 12.2.1 Company's Key Areas Served
- 12.2.2 Recent Developments
- 12.3. Company Market Share Analysis 2025
- 12.3.1 Top 5 Companies Market Share Analysis
- 12.3.2 Top 3 Companies Market Share Analysis
- 12.4. List of Potential Customers
- 13. Research Methodology
List of Figures
- Figure 1: Global AMOLED Electroluminescent Materials Revenue Breakdown (undefined, %) by Region 2025 & 2033
- Figure 2: North America AMOLED Electroluminescent Materials Revenue (undefined), by Application 2025 & 2033
- Figure 3: North America AMOLED Electroluminescent Materials Revenue Share (%), by Application 2025 & 2033
- Figure 4: North America AMOLED Electroluminescent Materials Revenue (undefined), by Types 2025 & 2033
- Figure 5: North America AMOLED Electroluminescent Materials Revenue Share (%), by Types 2025 & 2033
- Figure 6: North America AMOLED Electroluminescent Materials Revenue (undefined), by Country 2025 & 2033
- Figure 7: North America AMOLED Electroluminescent Materials Revenue Share (%), by Country 2025 & 2033
- Figure 8: South America AMOLED Electroluminescent Materials Revenue (undefined), by Application 2025 & 2033
- Figure 9: South America AMOLED Electroluminescent Materials Revenue Share (%), by Application 2025 & 2033
- Figure 10: South America AMOLED Electroluminescent Materials Revenue (undefined), by Types 2025 & 2033
- Figure 11: South America AMOLED Electroluminescent Materials Revenue Share (%), by Types 2025 & 2033
- Figure 12: South America AMOLED Electroluminescent Materials Revenue (undefined), by Country 2025 & 2033
- Figure 13: South America AMOLED Electroluminescent Materials Revenue Share (%), by Country 2025 & 2033
- Figure 14: Europe AMOLED Electroluminescent Materials Revenue (undefined), by Application 2025 & 2033
- Figure 15: Europe AMOLED Electroluminescent Materials Revenue Share (%), by Application 2025 & 2033
- Figure 16: Europe AMOLED Electroluminescent Materials Revenue (undefined), by Types 2025 & 2033
- Figure 17: Europe AMOLED Electroluminescent Materials Revenue Share (%), by Types 2025 & 2033
- Figure 18: Europe AMOLED Electroluminescent Materials Revenue (undefined), by Country 2025 & 2033
- Figure 19: Europe AMOLED Electroluminescent Materials Revenue Share (%), by Country 2025 & 2033
- Figure 20: Middle East & Africa AMOLED Electroluminescent Materials Revenue (undefined), by Application 2025 & 2033
- Figure 21: Middle East & Africa AMOLED Electroluminescent Materials Revenue Share (%), by Application 2025 & 2033
- Figure 22: Middle East & Africa AMOLED Electroluminescent Materials Revenue (undefined), by Types 2025 & 2033
- Figure 23: Middle East & Africa AMOLED Electroluminescent Materials Revenue Share (%), by Types 2025 & 2033
- Figure 24: Middle East & Africa AMOLED Electroluminescent Materials Revenue (undefined), by Country 2025 & 2033
- Figure 25: Middle East & Africa AMOLED Electroluminescent Materials Revenue Share (%), by Country 2025 & 2033
- Figure 26: Asia Pacific AMOLED Electroluminescent Materials Revenue (undefined), by Application 2025 & 2033
- Figure 27: Asia Pacific AMOLED Electroluminescent Materials Revenue Share (%), by Application 2025 & 2033
- Figure 28: Asia Pacific AMOLED Electroluminescent Materials Revenue (undefined), by Types 2025 & 2033
- Figure 29: Asia Pacific AMOLED Electroluminescent Materials Revenue Share (%), by Types 2025 & 2033
- Figure 30: Asia Pacific AMOLED Electroluminescent Materials Revenue (undefined), by Country 2025 & 2033
- Figure 31: Asia Pacific AMOLED Electroluminescent Materials Revenue Share (%), by Country 2025 & 2033
List of Tables
- Table 1: Global AMOLED Electroluminescent Materials Revenue undefined Forecast, by Application 2020 & 2033
- Table 2: Global AMOLED Electroluminescent Materials Revenue undefined Forecast, by Types 2020 & 2033
- Table 3: Global AMOLED Electroluminescent Materials Revenue undefined Forecast, by Region 2020 & 2033
- Table 4: Global AMOLED Electroluminescent Materials Revenue undefined Forecast, by Application 2020 & 2033
- Table 5: Global AMOLED Electroluminescent Materials Revenue undefined Forecast, by Types 2020 & 2033
- Table 6: Global AMOLED Electroluminescent Materials Revenue undefined Forecast, by Country 2020 & 2033
- Table 7: United States AMOLED Electroluminescent Materials Revenue (undefined) Forecast, by Application 2020 & 2033
- Table 8: Canada AMOLED Electroluminescent Materials Revenue (undefined) Forecast, by Application 2020 & 2033
- Table 9: Mexico AMOLED Electroluminescent Materials Revenue (undefined) Forecast, by Application 2020 & 2033
- Table 10: Global AMOLED Electroluminescent Materials Revenue undefined Forecast, by Application 2020 & 2033
- Table 11: Global AMOLED Electroluminescent Materials Revenue undefined Forecast, by Types 2020 & 2033
- Table 12: Global AMOLED Electroluminescent Materials Revenue undefined Forecast, by Country 2020 & 2033
- Table 13: Brazil AMOLED Electroluminescent Materials Revenue (undefined) Forecast, by Application 2020 & 2033
- Table 14: Argentina AMOLED Electroluminescent Materials Revenue (undefined) Forecast, by Application 2020 & 2033
- Table 15: Rest of South America AMOLED Electroluminescent Materials Revenue (undefined) Forecast, by Application 2020 & 2033
- Table 16: Global AMOLED Electroluminescent Materials Revenue undefined Forecast, by Application 2020 & 2033
- Table 17: Global AMOLED Electroluminescent Materials Revenue undefined Forecast, by Types 2020 & 2033
- Table 18: Global AMOLED Electroluminescent Materials Revenue undefined Forecast, by Country 2020 & 2033
- Table 19: United Kingdom AMOLED Electroluminescent Materials Revenue (undefined) Forecast, by Application 2020 & 2033
- Table 20: Germany AMOLED Electroluminescent Materials Revenue (undefined) Forecast, by Application 2020 & 2033
- Table 21: France AMOLED Electroluminescent Materials Revenue (undefined) Forecast, by Application 2020 & 2033
- Table 22: Italy AMOLED Electroluminescent Materials Revenue (undefined) Forecast, by Application 2020 & 2033
- Table 23: Spain AMOLED Electroluminescent Materials Revenue (undefined) Forecast, by Application 2020 & 2033
- Table 24: Russia AMOLED Electroluminescent Materials Revenue (undefined) Forecast, by Application 2020 & 2033
- Table 25: Benelux AMOLED Electroluminescent Materials Revenue (undefined) Forecast, by Application 2020 & 2033
- Table 26: Nordics AMOLED Electroluminescent Materials Revenue (undefined) Forecast, by Application 2020 & 2033
- Table 27: Rest of Europe AMOLED Electroluminescent Materials Revenue (undefined) Forecast, by Application 2020 & 2033
- Table 28: Global AMOLED Electroluminescent Materials Revenue undefined Forecast, by Application 2020 & 2033
- Table 29: Global AMOLED Electroluminescent Materials Revenue undefined Forecast, by Types 2020 & 2033
- Table 30: Global AMOLED Electroluminescent Materials Revenue undefined Forecast, by Country 2020 & 2033
- Table 31: Turkey AMOLED Electroluminescent Materials Revenue (undefined) Forecast, by Application 2020 & 2033
- Table 32: Israel AMOLED Electroluminescent Materials Revenue (undefined) Forecast, by Application 2020 & 2033
- Table 33: GCC AMOLED Electroluminescent Materials Revenue (undefined) Forecast, by Application 2020 & 2033
- Table 34: North Africa AMOLED Electroluminescent Materials Revenue (undefined) Forecast, by Application 2020 & 2033
- Table 35: South Africa AMOLED Electroluminescent Materials Revenue (undefined) Forecast, by Application 2020 & 2033
- Table 36: Rest of Middle East & Africa AMOLED Electroluminescent Materials Revenue (undefined) Forecast, by Application 2020 & 2033
- Table 37: Global AMOLED Electroluminescent Materials Revenue undefined Forecast, by Application 2020 & 2033
- Table 38: Global AMOLED Electroluminescent Materials Revenue undefined Forecast, by Types 2020 & 2033
- Table 39: Global AMOLED Electroluminescent Materials Revenue undefined Forecast, by Country 2020 & 2033
- Table 40: China AMOLED Electroluminescent Materials Revenue (undefined) Forecast, by Application 2020 & 2033
- Table 41: India AMOLED Electroluminescent Materials Revenue (undefined) Forecast, by Application 2020 & 2033
- Table 42: Japan AMOLED Electroluminescent Materials Revenue (undefined) Forecast, by Application 2020 & 2033
- Table 43: South Korea AMOLED Electroluminescent Materials Revenue (undefined) Forecast, by Application 2020 & 2033
- Table 44: ASEAN AMOLED Electroluminescent Materials Revenue (undefined) Forecast, by Application 2020 & 2033
- Table 45: Oceania AMOLED Electroluminescent Materials Revenue (undefined) Forecast, by Application 2020 & 2033
- Table 46: Rest of Asia Pacific AMOLED Electroluminescent Materials Revenue (undefined) Forecast, by Application 2020 & 2033
Frequently Asked Questions
1. What is the projected Compound Annual Growth Rate (CAGR) of the AMOLED Electroluminescent Materials?
The projected CAGR is approximately 9.5%.
2. Which companies are prominent players in the AMOLED Electroluminescent Materials?
Key companies in the market include Universal Display Corporation, Idemitsu Kosan, Merck Group, DuPont, Duk San Neolux Co, Doosan Electronic, Sumitomo Chemical, LG Chem, Samsung SDI, Hodogaya Chemical, Toray Industries, JNC Corporation, SK JNC, Xi'an LTOM, Summer Sprout, Eternal Material Technology, Jilin Oled Material Tech, Jiangsu Sunera Technology, Beijing Aglaia, Tronly-eRay Optoelectronics, Changshu Hyperions, Xi'an Manareco New Materials.
3. What are the main segments of the AMOLED Electroluminescent Materials?
The market segments include Application, Types.
4. Can you provide details about the market size?
The market size is estimated to be USD XXX N/A as of 2022.
5. What are some drivers contributing to market growth?
N/A
6. What are the notable trends driving market growth?
N/A
7. Are there any restraints impacting market growth?
N/A
8. Can you provide examples of recent developments in the market?
N/A
9. What pricing options are available for accessing the report?
Pricing options include single-user, multi-user, and enterprise licenses priced at USD 2900.00, USD 4350.00, and USD 5800.00 respectively.
10. Is the market size provided in terms of value or volume?
The market size is provided in terms of value, measured in N/A.
11. Are there any specific market keywords associated with the report?
Yes, the market keyword associated with the report is "AMOLED Electroluminescent Materials," which aids in identifying and referencing the specific market segment covered.
12. How do I determine which pricing option suits my needs best?
The pricing options vary based on user requirements and access needs. Individual users may opt for single-user licenses, while businesses requiring broader access may choose multi-user or enterprise licenses for cost-effective access to the report.
13. Are there any additional resources or data provided in the AMOLED Electroluminescent Materials report?
While the report offers comprehensive insights, it's advisable to review the specific contents or supplementary materials provided to ascertain if additional resources or data are available.
14. How can I stay updated on further developments or reports in the AMOLED Electroluminescent Materials?
To stay informed about further developments, trends, and reports in the AMOLED Electroluminescent Materials, consider subscribing to industry newsletters, following relevant companies and organizations, or regularly checking reputable industry news sources and publications.
Methodology
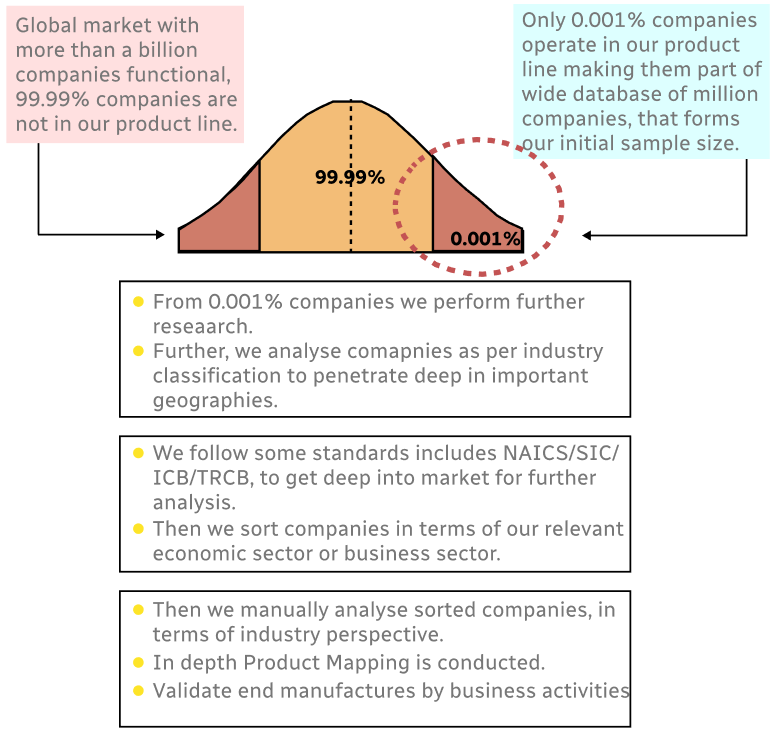
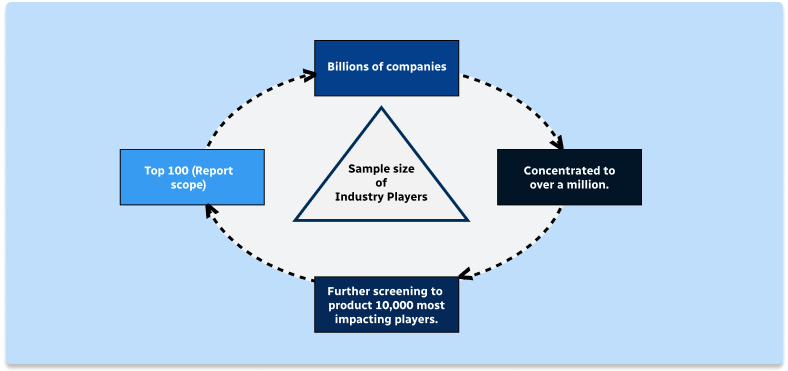
Step 1 - Identification of Relevant Samples Size from Population Database
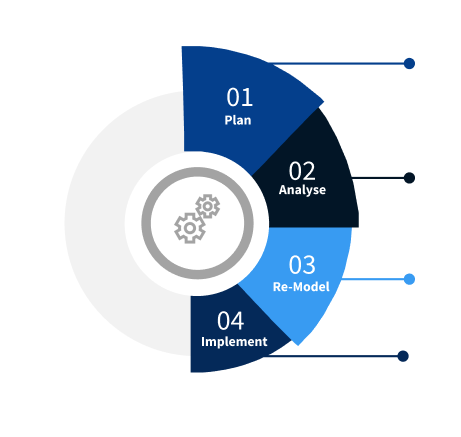
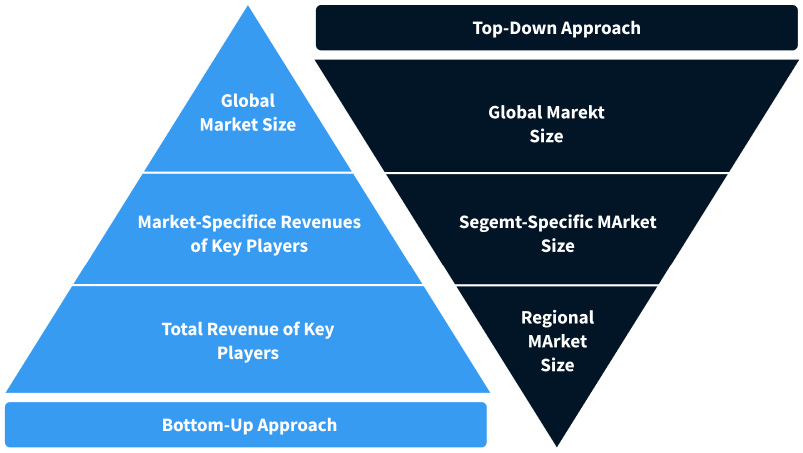
Step 2 - Approaches for Defining Global Market Size (Value, Volume* & Price*)
Note*: In applicable scenarios
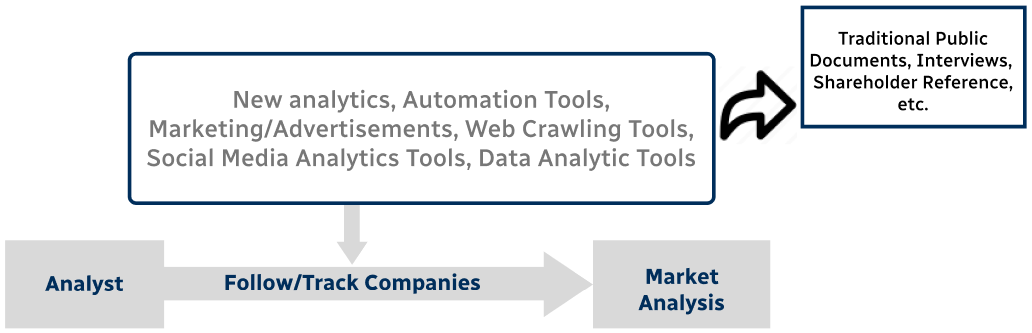
Step 3 - Data Sources
Primary Research
- Web Analytics
- Survey Reports
- Research Institute
- Latest Research Reports
- Opinion Leaders
Secondary Research
- Annual Reports
- White Paper
- Latest Press Release
- Industry Association
- Paid Database
- Investor Presentations
Step 4 - Data Triangulation
Involves using different sources of information in order to increase the validity of a study
These sources are likely to be stakeholders in a program - participants, other researchers, program staff, other community members, and so on.
Then we put all data in single framework & apply various statistical tools to find out the dynamic on the market.
During the analysis stage, feedback from the stakeholder groups would be compared to determine areas of agreement as well as areas of divergence