

Key Insights
The Asia-Pacific (APAC) aviation fuel market is experiencing robust growth, driven by a surge in air passenger traffic and the expansion of low-cost carriers across the region. This growth is further fueled by increasing tourism, economic development in emerging economies like India and China, and the rising demand for air freight services. The market is segmented by fuel type (ATF, aviation biofuel, others) and application (commercial, military, general aviation). While Air Turbine Fuel (ATF) currently dominates the market, the adoption of sustainable aviation biofuels is gaining traction, albeit from a smaller base, driven by environmental concerns and government regulations promoting greener aviation. However, challenges remain, including price volatility of crude oil, infrastructure limitations in certain regions, and geopolitical uncertainties that can impact fuel supply chains. Specific countries like China, India, and Japan are key drivers of market growth due to their large and expanding air travel sectors. The growth trajectory indicates a significant expansion in the coming years, with continued investment in airport infrastructure and fleet modernization contributing to the overall market dynamism.
Looking ahead, the APAC aviation fuel market is poised for substantial growth through 2033. This will be driven by continued increases in air travel demand, especially within the region's rapidly growing economies. The shift towards sustainable aviation fuels will influence market dynamics, with an increasing portion of the market dedicated to biofuels and other alternatives. Government policies aimed at reducing carbon emissions in the aviation sector will play a crucial role in shaping the future of this market. Regional variations in growth rates will likely persist, with the most significant expansion occurring in high-growth economies experiencing rapid economic and population growth. However, careful management of supply chain risks and addressing infrastructural bottlenecks will be essential for sustaining this positive growth trajectory.
APAC Aviation Fuel Industry: Market Analysis & Forecast 2019-2033
This comprehensive report provides a detailed analysis of the Asia-Pacific (APAC) aviation fuel industry, offering invaluable insights for industry professionals, investors, and strategic decision-makers. Covering the period 2019-2033, with a focus on 2025, this report meticulously examines market dynamics, growth trends, key players, and future opportunities within this vital sector.
Keywords: APAC Aviation Fuel, Aviation Fuel Market, ATF Market, Aviation Biofuel, APAC Aviation Industry, Aviation Fuel Consumption, Aviation Fuel Forecast, Commercial Aviation Fuel, Military Aviation Fuel, General Aviation Fuel, BP plc, Bharat Petroleum, ExxonMobil, Shell, Pertamina, Chevron, World Fuel Services, Petronas, China Aviation Oil, Vitol.
APAC Aviation Fuel Industry Market Dynamics & Structure
The APAC aviation fuel market is characterized by a moderately concentrated landscape, with major international and regional players holding significant market share. Market concentration is expected to remain relatively stable throughout the forecast period (2025-2033), though strategic mergers and acquisitions (M&A) will continue to shape the competitive dynamics. Technological innovation, primarily focused on sustainable aviation fuels (SAF), is a key driver, yet faces challenges related to production costs and infrastructure limitations. Stringent regulatory frameworks concerning emissions and safety standards significantly impact market operations. Competition from alternative fuels is currently limited but presents a potential long-term challenge. The end-user demographics are diverse, encompassing commercial, military, and general aviation sectors, with commercial aviation driving the majority of demand.
- Market Concentration: xx% held by top 5 players in 2025.
- M&A Activity: xx deals recorded between 2019 and 2024.
- Technological Innovation Drivers: Focus on SAF development and adoption.
- Regulatory Framework: Stringent emission standards and safety regulations.
- Competitive Product Substitutes: Limited currently, but growing interest in biofuels and hydrogen.
- End-User Demographics: Predominantly commercial aviation (xx%), followed by military (xx%) and general aviation (xx%).
APAC Aviation Fuel Industry Growth Trends & Insights
The APAC aviation fuel market witnessed significant growth during the historical period (2019-2024), driven primarily by the expansion of air travel within the region. The COVID-19 pandemic caused a temporary downturn, but the market is experiencing a strong rebound, with a projected Compound Annual Growth Rate (CAGR) of xx% from 2025 to 2033. This growth is fueled by increasing passenger numbers, the expansion of low-cost carriers, and robust economic growth in several APAC countries. Technological disruptions, particularly the increasing adoption of more fuel-efficient aircraft and the development of sustainable aviation fuels, are further shaping market dynamics. Consumer behavior shifts, such as a growing preference for air travel, particularly in emerging economies, are also contributing to market expansion. Market penetration of ATF remains high, while the adoption of aviation biofuel is still in its early stages, showing significant future potential.
Dominant Regions, Countries, or Segments in APAC Aviation Fuel Industry
The greatest growth within the APAC aviation fuel market is observed in the Commercial Aircraft segment, driven by the rapid expansion of air travel in countries like India, China, and Indonesia. Within fuel types, Air Turbine Fuel (ATF) dominates the market, with Aviation Biofuel experiencing significant albeit slower growth due to production costs and scalability challenges. China and India are the leading national markets, fuelled by robust economic growth and expanding domestic air travel.
- Key Drivers (China & India): Strong economic growth, expanding middle class, increased domestic air travel, government investments in airport infrastructure.
- Market Share: China holds xx% of the market, India holds xx%.
- Growth Potential: Southeast Asia presents significant untapped potential.
APAC Aviation Fuel Industry Product Landscape
The APAC aviation fuel market is primarily dominated by Air Turbine Fuel (ATF). However, significant advancements are underway in the development and adoption of sustainable aviation fuels (SAFs), including biofuels and synthetic fuels. These SAFs offer reduced carbon emissions compared to traditional ATF, meeting growing environmental concerns. The focus is on improving the performance metrics of SAFs to match or exceed those of conventional fuels, ensuring seamless integration into existing aircraft engines. Key selling propositions for SAFs include reduced carbon footprint and enhanced sustainability credentials.
Key Drivers, Barriers & Challenges in APAC Aviation Fuel Industry
Key Drivers: Growing air passenger traffic; increasing disposable incomes in emerging economies; government initiatives promoting air connectivity; technological advancements improving fuel efficiency.
Key Challenges: High fuel prices; volatility in crude oil prices; environmental concerns and pressure to reduce carbon emissions; limited availability and high cost of sustainable aviation fuels; infrastructure limitations for SAF distribution. The impact of these challenges is estimated to reduce market growth by approximately xx% by 2033.
Emerging Opportunities in APAC Aviation Fuel Industry
The growing demand for sustainable aviation fuel (SAF) presents a major opportunity. The development of innovative blending technologies to incorporate SAFs into existing fuel infrastructure is another key area. Further, the exploration of alternative aviation fuels, such as hydrogen, presents long-term potential, although substantial technological and infrastructural challenges remain. Untapped markets in Southeast Asia offer significant growth prospects.
Growth Accelerators in the APAC Aviation Fuel Industry
Technological advancements in SAF production and aircraft fuel efficiency will be crucial. Strategic partnerships between fuel suppliers, airlines, and technology companies will accelerate adoption of sustainable practices. Government policies supporting the development and deployment of SAFs will be essential for long-term growth. Expansion into untapped markets and the effective management of supply chain logistics will be critical.
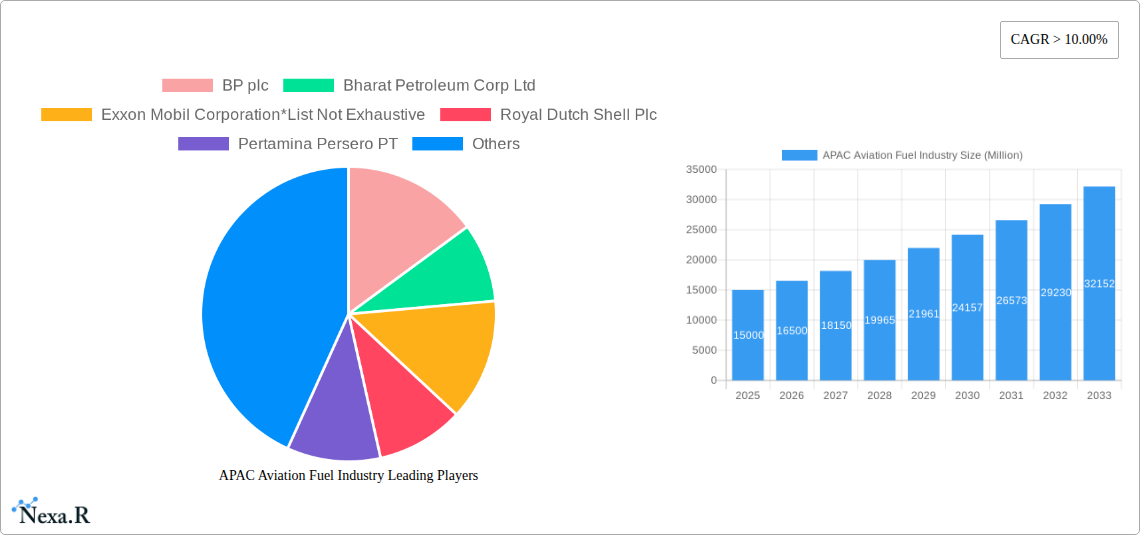
Key Players Shaping the APAC Aviation Fuel Industry Market
- BP plc
- Bharat Petroleum Corp Ltd
- Exxon Mobil Corporation
- Royal Dutch Shell Plc
- Pertamina Persero PT
- Chevron Corporation
- World Fuel Services Corp
- Petronas Aviation Sdn Bhd
- China Aviation Oil Corporation Ltd
- Vitol Holding BV
Notable Milestones in APAC Aviation Fuel Industry Sector
- 2021: Several APAC countries implemented stricter emission regulations for aviation.
- 2022: Significant investments were made in SAF production facilities across the region.
- 2023: Several major airlines announced targets for SAF usage by 2030.
- 2024: A major M&A deal consolidated market share within the SAF production sector.
In-Depth APAC Aviation Fuel Industry Market Outlook
The APAC aviation fuel market is poised for continued growth, driven by a combination of factors including rising air travel demand, technological innovations, and supportive government policies. Strategic investments in SAF production and infrastructure, coupled with collaborative efforts between industry stakeholders, will be key to unlocking the full potential of the market and ensuring a sustainable future for aviation in the region. The market's long-term success depends on effectively navigating the challenges posed by price volatility, environmental concerns, and technological hurdles.
APAC Aviation Fuel Industry Segmentation
-
1. Fuel Type
- 1.1. Air Turbine Fuel (ATF)
- 1.2. Aviation Biofuel
- 1.3. Others
-
2. Application
- 2.1. Commercial Aircraft
- 2.2. Military Aircraft
- 2.3. General Aviation
-
3. Geography
- 3.1. China
- 3.2. Japan
- 3.3. India
- 3.4. Indonesia
- 3.5. Australia
- 3.6. Rest of Asia-Pacific
APAC Aviation Fuel Industry Segmentation By Geography
- 1. China
- 2. Japan
- 3. India
- 4. Indonesia
- 5. Australia
- 6. Rest of Asia Pacific
APAC Aviation Fuel Industry REPORT HIGHLIGHTS
| Aspects | Details |
|---|---|
| Study Period | 2019-2033 |
| Base Year | 2024 |
| Estimated Year | 2025 |
| Forecast Period | 2025-2033 |
| Historical Period | 2019-2024 |
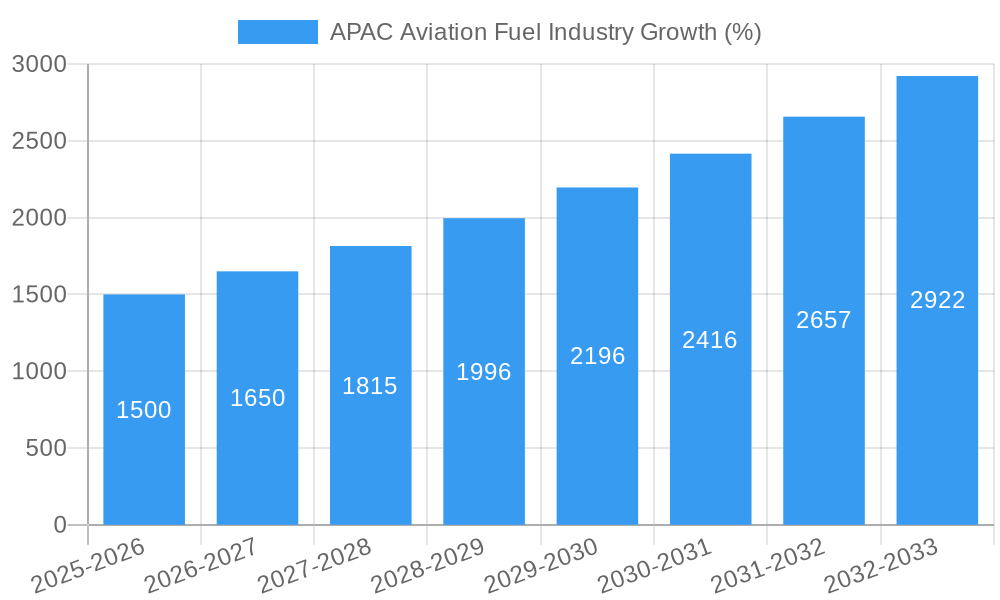
| Growth Rate | CAGR of > 10.00% from 2019-2033 |
| Segmentation |
|
Table of Contents
- 1. Introduction
- 1.1. Research Scope
- 1.2. Market Segmentation
- 1.3. Research Methodology
- 1.4. Definitions and Assumptions
- 2. Executive Summary
- 2.1. Introduction
- 3. Market Dynamics
- 3.1. Introduction
- 3.2. Market Drivers
- 3.2.1. 4.; Increase in Prices of Electricity Procured from Conventional Mechanisms 4.; Decline in Cost of Solar Energy Infrastructure
- 3.3. Market Restrains
- 3.3.1. 4.; Competition from Other Alternative Energy Sources
- 3.4. Market Trends
- 3.4.1. Commercial Aircraft Segment to Dominate the Market
- 4. Market Factor Analysis
- 4.1. Porters Five Forces
- 4.2. Supply/Value Chain
- 4.3. PESTEL analysis
- 4.4. Market Entropy
- 4.5. Patent/Trademark Analysis
- 5. Global APAC Aviation Fuel Industry Analysis, Insights and Forecast, 2019-2031
- 5.1. Market Analysis, Insights and Forecast - by Fuel Type
- 5.1.1. Air Turbine Fuel (ATF)
- 5.1.2. Aviation Biofuel
- 5.1.3. Others
- 5.2. Market Analysis, Insights and Forecast - by Application
- 5.2.1. Commercial Aircraft
- 5.2.2. Military Aircraft
- 5.2.3. General Aviation
- 5.3. Market Analysis, Insights and Forecast - by Geography
- 5.3.1. China
- 5.3.2. Japan
- 5.3.3. India
- 5.3.4. Indonesia
- 5.3.5. Australia
- 5.3.6. Rest of Asia-Pacific
- 5.4. Market Analysis, Insights and Forecast - by Region
- 5.4.1. China
- 5.4.2. Japan
- 5.4.3. India
- 5.4.4. Indonesia
- 5.4.5. Australia
- 5.4.6. Rest of Asia Pacific
- 5.1. Market Analysis, Insights and Forecast - by Fuel Type
- 6. China APAC Aviation Fuel Industry Analysis, Insights and Forecast, 2019-2031
- 6.1. Market Analysis, Insights and Forecast - by Fuel Type
- 6.1.1. Air Turbine Fuel (ATF)
- 6.1.2. Aviation Biofuel
- 6.1.3. Others
- 6.2. Market Analysis, Insights and Forecast - by Application
- 6.2.1. Commercial Aircraft
- 6.2.2. Military Aircraft
- 6.2.3. General Aviation
- 6.3. Market Analysis, Insights and Forecast - by Geography
- 6.3.1. China
- 6.3.2. Japan
- 6.3.3. India
- 6.3.4. Indonesia
- 6.3.5. Australia
- 6.3.6. Rest of Asia-Pacific
- 6.1. Market Analysis, Insights and Forecast - by Fuel Type
- 7. Japan APAC Aviation Fuel Industry Analysis, Insights and Forecast, 2019-2031
- 7.1. Market Analysis, Insights and Forecast - by Fuel Type
- 7.1.1. Air Turbine Fuel (ATF)
- 7.1.2. Aviation Biofuel
- 7.1.3. Others
- 7.2. Market Analysis, Insights and Forecast - by Application
- 7.2.1. Commercial Aircraft
- 7.2.2. Military Aircraft
- 7.2.3. General Aviation
- 7.3. Market Analysis, Insights and Forecast - by Geography
- 7.3.1. China
- 7.3.2. Japan
- 7.3.3. India
- 7.3.4. Indonesia
- 7.3.5. Australia
- 7.3.6. Rest of Asia-Pacific
- 7.1. Market Analysis, Insights and Forecast - by Fuel Type
- 8. India APAC Aviation Fuel Industry Analysis, Insights and Forecast, 2019-2031
- 8.1. Market Analysis, Insights and Forecast - by Fuel Type
- 8.1.1. Air Turbine Fuel (ATF)
- 8.1.2. Aviation Biofuel
- 8.1.3. Others
- 8.2. Market Analysis, Insights and Forecast - by Application
- 8.2.1. Commercial Aircraft
- 8.2.2. Military Aircraft
- 8.2.3. General Aviation
- 8.3. Market Analysis, Insights and Forecast - by Geography
- 8.3.1. China
- 8.3.2. Japan
- 8.3.3. India
- 8.3.4. Indonesia
- 8.3.5. Australia
- 8.3.6. Rest of Asia-Pacific
- 8.1. Market Analysis, Insights and Forecast - by Fuel Type
- 9. Indonesia APAC Aviation Fuel Industry Analysis, Insights and Forecast, 2019-2031
- 9.1. Market Analysis, Insights and Forecast - by Fuel Type
- 9.1.1. Air Turbine Fuel (ATF)
- 9.1.2. Aviation Biofuel
- 9.1.3. Others
- 9.2. Market Analysis, Insights and Forecast - by Application
- 9.2.1. Commercial Aircraft
- 9.2.2. Military Aircraft
- 9.2.3. General Aviation
- 9.3. Market Analysis, Insights and Forecast - by Geography
- 9.3.1. China
- 9.3.2. Japan
- 9.3.3. India
- 9.3.4. Indonesia
- 9.3.5. Australia
- 9.3.6. Rest of Asia-Pacific
- 9.1. Market Analysis, Insights and Forecast - by Fuel Type
- 10. Australia APAC Aviation Fuel Industry Analysis, Insights and Forecast, 2019-2031
- 10.1. Market Analysis, Insights and Forecast - by Fuel Type
- 10.1.1. Air Turbine Fuel (ATF)
- 10.1.2. Aviation Biofuel
- 10.1.3. Others
- 10.2. Market Analysis, Insights and Forecast - by Application
- 10.2.1. Commercial Aircraft
- 10.2.2. Military Aircraft
- 10.2.3. General Aviation
- 10.3. Market Analysis, Insights and Forecast - by Geography
- 10.3.1. China
- 10.3.2. Japan
- 10.3.3. India
- 10.3.4. Indonesia
- 10.3.5. Australia
- 10.3.6. Rest of Asia-Pacific
- 10.1. Market Analysis, Insights and Forecast - by Fuel Type
- 11. Rest of Asia Pacific APAC Aviation Fuel Industry Analysis, Insights and Forecast, 2019-2031
- 11.1. Market Analysis, Insights and Forecast - by Fuel Type
- 11.1.1. Air Turbine Fuel (ATF)
- 11.1.2. Aviation Biofuel
- 11.1.3. Others
- 11.2. Market Analysis, Insights and Forecast - by Application
- 11.2.1. Commercial Aircraft
- 11.2.2. Military Aircraft
- 11.2.3. General Aviation
- 11.3. Market Analysis, Insights and Forecast - by Geography
- 11.3.1. China
- 11.3.2. Japan
- 11.3.3. India
- 11.3.4. Indonesia
- 11.3.5. Australia
- 11.3.6. Rest of Asia-Pacific
- 11.1. Market Analysis, Insights and Forecast - by Fuel Type
- 12. North America APAC Aviation Fuel Industry Analysis, Insights and Forecast, 2019-2031
- 12.1. Market Analysis, Insights and Forecast - By Country/Sub-region
- 12.1.1 United States
- 12.1.2 Canada
- 12.1.3 Mexico
- 13. Europe APAC Aviation Fuel Industry Analysis, Insights and Forecast, 2019-2031
- 13.1. Market Analysis, Insights and Forecast - By Country/Sub-region
- 13.1.1 Germany
- 13.1.2 United Kingdom
- 13.1.3 France
- 13.1.4 Spain
- 13.1.5 Italy
- 13.1.6 Spain
- 13.1.7 Belgium
- 13.1.8 Netherland
- 13.1.9 Nordics
- 13.1.10 Rest of Europe
- 14. Asia Pacific APAC Aviation Fuel Industry Analysis, Insights and Forecast, 2019-2031
- 14.1. Market Analysis, Insights and Forecast - By Country/Sub-region
- 14.1.1 China
- 14.1.2 Japan
- 14.1.3 India
- 14.1.4 South Korea
- 14.1.5 Southeast Asia
- 14.1.6 Australia
- 14.1.7 Indonesia
- 14.1.8 Phillipes
- 14.1.9 Singapore
- 14.1.10 Thailandc
- 14.1.11 Rest of Asia Pacific
- 15. South America APAC Aviation Fuel Industry Analysis, Insights and Forecast, 2019-2031
- 15.1. Market Analysis, Insights and Forecast - By Country/Sub-region
- 15.1.1 Brazil
- 15.1.2 Argentina
- 15.1.3 Peru
- 15.1.4 Chile
- 15.1.5 Colombia
- 15.1.6 Ecuador
- 15.1.7 Venezuela
- 15.1.8 Rest of South America
- 16. North America APAC Aviation Fuel Industry Analysis, Insights and Forecast, 2019-2031
- 16.1. Market Analysis, Insights and Forecast - By Country/Sub-region
- 16.1.1 United States
- 16.1.2 Canada
- 16.1.3 Mexico
- 17. MEA APAC Aviation Fuel Industry Analysis, Insights and Forecast, 2019-2031
- 17.1. Market Analysis, Insights and Forecast - By Country/Sub-region
- 17.1.1 United Arab Emirates
- 17.1.2 Saudi Arabia
- 17.1.3 South Africa
- 17.1.4 Rest of Middle East and Africa
- 18. Competitive Analysis
- 18.1. Global Market Share Analysis 2024
- 18.2. Company Profiles
- 18.2.1 BP plc
- 18.2.1.1. Overview
- 18.2.1.2. Products
- 18.2.1.3. SWOT Analysis
- 18.2.1.4. Recent Developments
- 18.2.1.5. Financials (Based on Availability)
- 18.2.2 Bharat Petroleum Corp Ltd
- 18.2.2.1. Overview
- 18.2.2.2. Products
- 18.2.2.3. SWOT Analysis
- 18.2.2.4. Recent Developments
- 18.2.2.5. Financials (Based on Availability)
- 18.2.3 Exxon Mobil Corporation*List Not Exhaustive
- 18.2.3.1. Overview
- 18.2.3.2. Products
- 18.2.3.3. SWOT Analysis
- 18.2.3.4. Recent Developments
- 18.2.3.5. Financials (Based on Availability)
- 18.2.4 Royal Dutch Shell Plc
- 18.2.4.1. Overview
- 18.2.4.2. Products
- 18.2.4.3. SWOT Analysis
- 18.2.4.4. Recent Developments
- 18.2.4.5. Financials (Based on Availability)
- 18.2.5 Pertamina Persero PT
- 18.2.5.1. Overview
- 18.2.5.2. Products
- 18.2.5.3. SWOT Analysis
- 18.2.5.4. Recent Developments
- 18.2.5.5. Financials (Based on Availability)
- 18.2.6 Chevron Corporation
- 18.2.6.1. Overview
- 18.2.6.2. Products
- 18.2.6.3. SWOT Analysis
- 18.2.6.4. Recent Developments
- 18.2.6.5. Financials (Based on Availability)
- 18.2.7 World Fuel Services Corp
- 18.2.7.1. Overview
- 18.2.7.2. Products
- 18.2.7.3. SWOT Analysis
- 18.2.7.4. Recent Developments
- 18.2.7.5. Financials (Based on Availability)
- 18.2.8 Petronas Aviation Sdn Bhd
- 18.2.8.1. Overview
- 18.2.8.2. Products
- 18.2.8.3. SWOT Analysis
- 18.2.8.4. Recent Developments
- 18.2.8.5. Financials (Based on Availability)
- 18.2.9 China Aviation Oil Corporation Ltd
- 18.2.9.1. Overview
- 18.2.9.2. Products
- 18.2.9.3. SWOT Analysis
- 18.2.9.4. Recent Developments
- 18.2.9.5. Financials (Based on Availability)
- 18.2.10 Vitol Holding BV
- 18.2.10.1. Overview
- 18.2.10.2. Products
- 18.2.10.3. SWOT Analysis
- 18.2.10.4. Recent Developments
- 18.2.10.5. Financials (Based on Availability)
- 18.2.1 BP plc
List of Figures
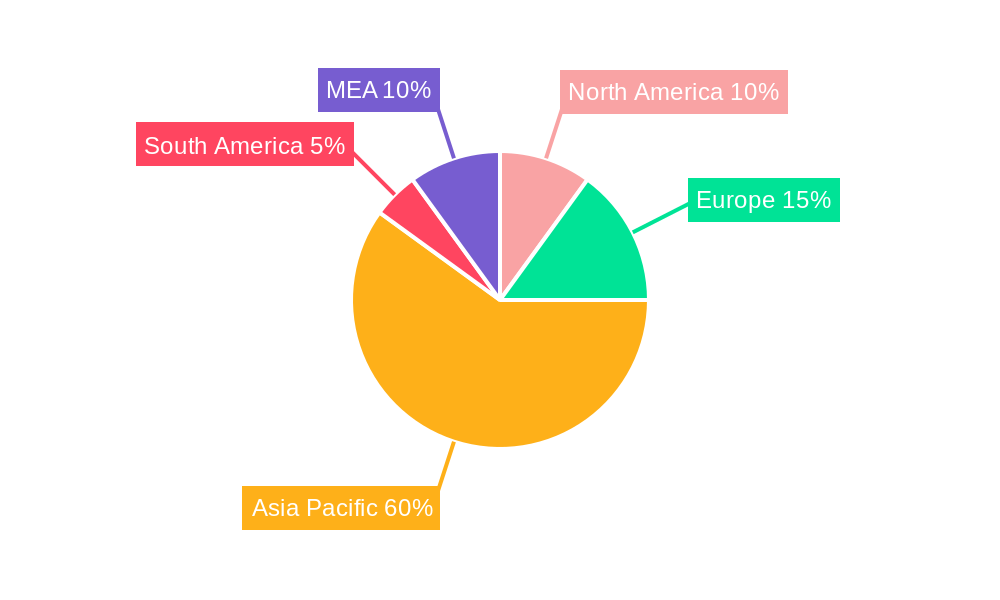
- Figure 1: Global APAC Aviation Fuel Industry Revenue Breakdown (Million, %) by Region 2024 & 2032
- Figure 2: Global APAC Aviation Fuel Industry Volume Breakdown (Litre, %) by Region 2024 & 2032
- Figure 3: North America APAC Aviation Fuel Industry Revenue (Million), by Country 2024 & 2032
- Figure 4: North America APAC Aviation Fuel Industry Volume (Litre), by Country 2024 & 2032
- Figure 5: North America APAC Aviation Fuel Industry Revenue Share (%), by Country 2024 & 2032
- Figure 6: North America APAC Aviation Fuel Industry Volume Share (%), by Country 2024 & 2032
- Figure 7: Europe APAC Aviation Fuel Industry Revenue (Million), by Country 2024 & 2032
- Figure 8: Europe APAC Aviation Fuel Industry Volume (Litre), by Country 2024 & 2032
- Figure 9: Europe APAC Aviation Fuel Industry Revenue Share (%), by Country 2024 & 2032
- Figure 10: Europe APAC Aviation Fuel Industry Volume Share (%), by Country 2024 & 2032
- Figure 11: Asia Pacific APAC Aviation Fuel Industry Revenue (Million), by Country 2024 & 2032
- Figure 12: Asia Pacific APAC Aviation Fuel Industry Volume (Litre), by Country 2024 & 2032
- Figure 13: Asia Pacific APAC Aviation Fuel Industry Revenue Share (%), by Country 2024 & 2032
- Figure 14: Asia Pacific APAC Aviation Fuel Industry Volume Share (%), by Country 2024 & 2032
- Figure 15: South America APAC Aviation Fuel Industry Revenue (Million), by Country 2024 & 2032
- Figure 16: South America APAC Aviation Fuel Industry Volume (Litre), by Country 2024 & 2032
- Figure 17: South America APAC Aviation Fuel Industry Revenue Share (%), by Country 2024 & 2032
- Figure 18: South America APAC Aviation Fuel Industry Volume Share (%), by Country 2024 & 2032
- Figure 19: North America APAC Aviation Fuel Industry Revenue (Million), by Country 2024 & 2032
- Figure 20: North America APAC Aviation Fuel Industry Volume (Litre), by Country 2024 & 2032
- Figure 21: North America APAC Aviation Fuel Industry Revenue Share (%), by Country 2024 & 2032
- Figure 22: North America APAC Aviation Fuel Industry Volume Share (%), by Country 2024 & 2032
- Figure 23: MEA APAC Aviation Fuel Industry Revenue (Million), by Country 2024 & 2032
- Figure 24: MEA APAC Aviation Fuel Industry Volume (Litre), by Country 2024 & 2032
- Figure 25: MEA APAC Aviation Fuel Industry Revenue Share (%), by Country 2024 & 2032
- Figure 26: MEA APAC Aviation Fuel Industry Volume Share (%), by Country 2024 & 2032
- Figure 27: China APAC Aviation Fuel Industry Revenue (Million), by Fuel Type 2024 & 2032
- Figure 28: China APAC Aviation Fuel Industry Volume (Litre), by Fuel Type 2024 & 2032
- Figure 29: China APAC Aviation Fuel Industry Revenue Share (%), by Fuel Type 2024 & 2032
- Figure 30: China APAC Aviation Fuel Industry Volume Share (%), by Fuel Type 2024 & 2032
- Figure 31: China APAC Aviation Fuel Industry Revenue (Million), by Application 2024 & 2032
- Figure 32: China APAC Aviation Fuel Industry Volume (Litre), by Application 2024 & 2032
- Figure 33: China APAC Aviation Fuel Industry Revenue Share (%), by Application 2024 & 2032
- Figure 34: China APAC Aviation Fuel Industry Volume Share (%), by Application 2024 & 2032
- Figure 35: China APAC Aviation Fuel Industry Revenue (Million), by Geography 2024 & 2032
- Figure 36: China APAC Aviation Fuel Industry Volume (Litre), by Geography 2024 & 2032
- Figure 37: China APAC Aviation Fuel Industry Revenue Share (%), by Geography 2024 & 2032
- Figure 38: China APAC Aviation Fuel Industry Volume Share (%), by Geography 2024 & 2032
- Figure 39: China APAC Aviation Fuel Industry Revenue (Million), by Country 2024 & 2032
- Figure 40: China APAC Aviation Fuel Industry Volume (Litre), by Country 2024 & 2032
- Figure 41: China APAC Aviation Fuel Industry Revenue Share (%), by Country 2024 & 2032
- Figure 42: China APAC Aviation Fuel Industry Volume Share (%), by Country 2024 & 2032
- Figure 43: Japan APAC Aviation Fuel Industry Revenue (Million), by Fuel Type 2024 & 2032
- Figure 44: Japan APAC Aviation Fuel Industry Volume (Litre), by Fuel Type 2024 & 2032
- Figure 45: Japan APAC Aviation Fuel Industry Revenue Share (%), by Fuel Type 2024 & 2032
- Figure 46: Japan APAC Aviation Fuel Industry Volume Share (%), by Fuel Type 2024 & 2032
- Figure 47: Japan APAC Aviation Fuel Industry Revenue (Million), by Application 2024 & 2032
- Figure 48: Japan APAC Aviation Fuel Industry Volume (Litre), by Application 2024 & 2032
- Figure 49: Japan APAC Aviation Fuel Industry Revenue Share (%), by Application 2024 & 2032
- Figure 50: Japan APAC Aviation Fuel Industry Volume Share (%), by Application 2024 & 2032
- Figure 51: Japan APAC Aviation Fuel Industry Revenue (Million), by Geography 2024 & 2032
- Figure 52: Japan APAC Aviation Fuel Industry Volume (Litre), by Geography 2024 & 2032
- Figure 53: Japan APAC Aviation Fuel Industry Revenue Share (%), by Geography 2024 & 2032
- Figure 54: Japan APAC Aviation Fuel Industry Volume Share (%), by Geography 2024 & 2032
- Figure 55: Japan APAC Aviation Fuel Industry Revenue (Million), by Country 2024 & 2032
- Figure 56: Japan APAC Aviation Fuel Industry Volume (Litre), by Country 2024 & 2032
- Figure 57: Japan APAC Aviation Fuel Industry Revenue Share (%), by Country 2024 & 2032
- Figure 58: Japan APAC Aviation Fuel Industry Volume Share (%), by Country 2024 & 2032
- Figure 59: India APAC Aviation Fuel Industry Revenue (Million), by Fuel Type 2024 & 2032
- Figure 60: India APAC Aviation Fuel Industry Volume (Litre), by Fuel Type 2024 & 2032
- Figure 61: India APAC Aviation Fuel Industry Revenue Share (%), by Fuel Type 2024 & 2032
- Figure 62: India APAC Aviation Fuel Industry Volume Share (%), by Fuel Type 2024 & 2032
- Figure 63: India APAC Aviation Fuel Industry Revenue (Million), by Application 2024 & 2032
- Figure 64: India APAC Aviation Fuel Industry Volume (Litre), by Application 2024 & 2032
- Figure 65: India APAC Aviation Fuel Industry Revenue Share (%), by Application 2024 & 2032
- Figure 66: India APAC Aviation Fuel Industry Volume Share (%), by Application 2024 & 2032
- Figure 67: India APAC Aviation Fuel Industry Revenue (Million), by Geography 2024 & 2032
- Figure 68: India APAC Aviation Fuel Industry Volume (Litre), by Geography 2024 & 2032
- Figure 69: India APAC Aviation Fuel Industry Revenue Share (%), by Geography 2024 & 2032
- Figure 70: India APAC Aviation Fuel Industry Volume Share (%), by Geography 2024 & 2032
- Figure 71: India APAC Aviation Fuel Industry Revenue (Million), by Country 2024 & 2032
- Figure 72: India APAC Aviation Fuel Industry Volume (Litre), by Country 2024 & 2032
- Figure 73: India APAC Aviation Fuel Industry Revenue Share (%), by Country 2024 & 2032
- Figure 74: India APAC Aviation Fuel Industry Volume Share (%), by Country 2024 & 2032
- Figure 75: Indonesia APAC Aviation Fuel Industry Revenue (Million), by Fuel Type 2024 & 2032
- Figure 76: Indonesia APAC Aviation Fuel Industry Volume (Litre), by Fuel Type 2024 & 2032
- Figure 77: Indonesia APAC Aviation Fuel Industry Revenue Share (%), by Fuel Type 2024 & 2032
- Figure 78: Indonesia APAC Aviation Fuel Industry Volume Share (%), by Fuel Type 2024 & 2032
- Figure 79: Indonesia APAC Aviation Fuel Industry Revenue (Million), by Application 2024 & 2032
- Figure 80: Indonesia APAC Aviation Fuel Industry Volume (Litre), by Application 2024 & 2032
- Figure 81: Indonesia APAC Aviation Fuel Industry Revenue Share (%), by Application 2024 & 2032
- Figure 82: Indonesia APAC Aviation Fuel Industry Volume Share (%), by Application 2024 & 2032
- Figure 83: Indonesia APAC Aviation Fuel Industry Revenue (Million), by Geography 2024 & 2032
- Figure 84: Indonesia APAC Aviation Fuel Industry Volume (Litre), by Geography 2024 & 2032
- Figure 85: Indonesia APAC Aviation Fuel Industry Revenue Share (%), by Geography 2024 & 2032
- Figure 86: Indonesia APAC Aviation Fuel Industry Volume Share (%), by Geography 2024 & 2032
- Figure 87: Indonesia APAC Aviation Fuel Industry Revenue (Million), by Country 2024 & 2032
- Figure 88: Indonesia APAC Aviation Fuel Industry Volume (Litre), by Country 2024 & 2032
- Figure 89: Indonesia APAC Aviation Fuel Industry Revenue Share (%), by Country 2024 & 2032
- Figure 90: Indonesia APAC Aviation Fuel Industry Volume Share (%), by Country 2024 & 2032
- Figure 91: Australia APAC Aviation Fuel Industry Revenue (Million), by Fuel Type 2024 & 2032
- Figure 92: Australia APAC Aviation Fuel Industry Volume (Litre), by Fuel Type 2024 & 2032
- Figure 93: Australia APAC Aviation Fuel Industry Revenue Share (%), by Fuel Type 2024 & 2032
- Figure 94: Australia APAC Aviation Fuel Industry Volume Share (%), by Fuel Type 2024 & 2032
- Figure 95: Australia APAC Aviation Fuel Industry Revenue (Million), by Application 2024 & 2032
- Figure 96: Australia APAC Aviation Fuel Industry Volume (Litre), by Application 2024 & 2032
- Figure 97: Australia APAC Aviation Fuel Industry Revenue Share (%), by Application 2024 & 2032
- Figure 98: Australia APAC Aviation Fuel Industry Volume Share (%), by Application 2024 & 2032
- Figure 99: Australia APAC Aviation Fuel Industry Revenue (Million), by Geography 2024 & 2032
- Figure 100: Australia APAC Aviation Fuel Industry Volume (Litre), by Geography 2024 & 2032
- Figure 101: Australia APAC Aviation Fuel Industry Revenue Share (%), by Geography 2024 & 2032
- Figure 102: Australia APAC Aviation Fuel Industry Volume Share (%), by Geography 2024 & 2032
- Figure 103: Australia APAC Aviation Fuel Industry Revenue (Million), by Country 2024 & 2032
- Figure 104: Australia APAC Aviation Fuel Industry Volume (Litre), by Country 2024 & 2032
- Figure 105: Australia APAC Aviation Fuel Industry Revenue Share (%), by Country 2024 & 2032
- Figure 106: Australia APAC Aviation Fuel Industry Volume Share (%), by Country 2024 & 2032
- Figure 107: Rest of Asia Pacific APAC Aviation Fuel Industry Revenue (Million), by Fuel Type 2024 & 2032
- Figure 108: Rest of Asia Pacific APAC Aviation Fuel Industry Volume (Litre), by Fuel Type 2024 & 2032
- Figure 109: Rest of Asia Pacific APAC Aviation Fuel Industry Revenue Share (%), by Fuel Type 2024 & 2032
- Figure 110: Rest of Asia Pacific APAC Aviation Fuel Industry Volume Share (%), by Fuel Type 2024 & 2032
- Figure 111: Rest of Asia Pacific APAC Aviation Fuel Industry Revenue (Million), by Application 2024 & 2032
- Figure 112: Rest of Asia Pacific APAC Aviation Fuel Industry Volume (Litre), by Application 2024 & 2032
- Figure 113: Rest of Asia Pacific APAC Aviation Fuel Industry Revenue Share (%), by Application 2024 & 2032
- Figure 114: Rest of Asia Pacific APAC Aviation Fuel Industry Volume Share (%), by Application 2024 & 2032
- Figure 115: Rest of Asia Pacific APAC Aviation Fuel Industry Revenue (Million), by Geography 2024 & 2032
- Figure 116: Rest of Asia Pacific APAC Aviation Fuel Industry Volume (Litre), by Geography 2024 & 2032
- Figure 117: Rest of Asia Pacific APAC Aviation Fuel Industry Revenue Share (%), by Geography 2024 & 2032
- Figure 118: Rest of Asia Pacific APAC Aviation Fuel Industry Volume Share (%), by Geography 2024 & 2032
- Figure 119: Rest of Asia Pacific APAC Aviation Fuel Industry Revenue (Million), by Country 2024 & 2032
- Figure 120: Rest of Asia Pacific APAC Aviation Fuel Industry Volume (Litre), by Country 2024 & 2032
- Figure 121: Rest of Asia Pacific APAC Aviation Fuel Industry Revenue Share (%), by Country 2024 & 2032
- Figure 122: Rest of Asia Pacific APAC Aviation Fuel Industry Volume Share (%), by Country 2024 & 2032
List of Tables
- Table 1: Global APAC Aviation Fuel Industry Revenue Million Forecast, by Region 2019 & 2032
- Table 2: Global APAC Aviation Fuel Industry Volume Litre Forecast, by Region 2019 & 2032
- Table 3: Global APAC Aviation Fuel Industry Revenue Million Forecast, by Fuel Type 2019 & 2032
- Table 4: Global APAC Aviation Fuel Industry Volume Litre Forecast, by Fuel Type 2019 & 2032
- Table 5: Global APAC Aviation Fuel Industry Revenue Million Forecast, by Application 2019 & 2032
- Table 6: Global APAC Aviation Fuel Industry Volume Litre Forecast, by Application 2019 & 2032
- Table 7: Global APAC Aviation Fuel Industry Revenue Million Forecast, by Geography 2019 & 2032
- Table 8: Global APAC Aviation Fuel Industry Volume Litre Forecast, by Geography 2019 & 2032
- Table 9: Global APAC Aviation Fuel Industry Revenue Million Forecast, by Region 2019 & 2032
- Table 10: Global APAC Aviation Fuel Industry Volume Litre Forecast, by Region 2019 & 2032
- Table 11: Global APAC Aviation Fuel Industry Revenue Million Forecast, by Country 2019 & 2032
- Table 12: Global APAC Aviation Fuel Industry Volume Litre Forecast, by Country 2019 & 2032
- Table 13: United States APAC Aviation Fuel Industry Revenue (Million) Forecast, by Application 2019 & 2032
- Table 14: United States APAC Aviation Fuel Industry Volume (Litre) Forecast, by Application 2019 & 2032
- Table 15: Canada APAC Aviation Fuel Industry Revenue (Million) Forecast, by Application 2019 & 2032
- Table 16: Canada APAC Aviation Fuel Industry Volume (Litre) Forecast, by Application 2019 & 2032
- Table 17: Mexico APAC Aviation Fuel Industry Revenue (Million) Forecast, by Application 2019 & 2032
- Table 18: Mexico APAC Aviation Fuel Industry Volume (Litre) Forecast, by Application 2019 & 2032
- Table 19: Global APAC Aviation Fuel Industry Revenue Million Forecast, by Country 2019 & 2032
- Table 20: Global APAC Aviation Fuel Industry Volume Litre Forecast, by Country 2019 & 2032
- Table 21: Germany APAC Aviation Fuel Industry Revenue (Million) Forecast, by Application 2019 & 2032
- Table 22: Germany APAC Aviation Fuel Industry Volume (Litre) Forecast, by Application 2019 & 2032
- Table 23: United Kingdom APAC Aviation Fuel Industry Revenue (Million) Forecast, by Application 2019 & 2032
- Table 24: United Kingdom APAC Aviation Fuel Industry Volume (Litre) Forecast, by Application 2019 & 2032
- Table 25: France APAC Aviation Fuel Industry Revenue (Million) Forecast, by Application 2019 & 2032
- Table 26: France APAC Aviation Fuel Industry Volume (Litre) Forecast, by Application 2019 & 2032
- Table 27: Spain APAC Aviation Fuel Industry Revenue (Million) Forecast, by Application 2019 & 2032
- Table 28: Spain APAC Aviation Fuel Industry Volume (Litre) Forecast, by Application 2019 & 2032
- Table 29: Italy APAC Aviation Fuel Industry Revenue (Million) Forecast, by Application 2019 & 2032
- Table 30: Italy APAC Aviation Fuel Industry Volume (Litre) Forecast, by Application 2019 & 2032
- Table 31: Spain APAC Aviation Fuel Industry Revenue (Million) Forecast, by Application 2019 & 2032
- Table 32: Spain APAC Aviation Fuel Industry Volume (Litre) Forecast, by Application 2019 & 2032
- Table 33: Belgium APAC Aviation Fuel Industry Revenue (Million) Forecast, by Application 2019 & 2032
- Table 34: Belgium APAC Aviation Fuel Industry Volume (Litre) Forecast, by Application 2019 & 2032
- Table 35: Netherland APAC Aviation Fuel Industry Revenue (Million) Forecast, by Application 2019 & 2032
- Table 36: Netherland APAC Aviation Fuel Industry Volume (Litre) Forecast, by Application 2019 & 2032
- Table 37: Nordics APAC Aviation Fuel Industry Revenue (Million) Forecast, by Application 2019 & 2032
- Table 38: Nordics APAC Aviation Fuel Industry Volume (Litre) Forecast, by Application 2019 & 2032
- Table 39: Rest of Europe APAC Aviation Fuel Industry Revenue (Million) Forecast, by Application 2019 & 2032
- Table 40: Rest of Europe APAC Aviation Fuel Industry Volume (Litre) Forecast, by Application 2019 & 2032
- Table 41: Global APAC Aviation Fuel Industry Revenue Million Forecast, by Country 2019 & 2032
- Table 42: Global APAC Aviation Fuel Industry Volume Litre Forecast, by Country 2019 & 2032
- Table 43: China APAC Aviation Fuel Industry Revenue (Million) Forecast, by Application 2019 & 2032
- Table 44: China APAC Aviation Fuel Industry Volume (Litre) Forecast, by Application 2019 & 2032
- Table 45: Japan APAC Aviation Fuel Industry Revenue (Million) Forecast, by Application 2019 & 2032
- Table 46: Japan APAC Aviation Fuel Industry Volume (Litre) Forecast, by Application 2019 & 2032
- Table 47: India APAC Aviation Fuel Industry Revenue (Million) Forecast, by Application 2019 & 2032
- Table 48: India APAC Aviation Fuel Industry Volume (Litre) Forecast, by Application 2019 & 2032
- Table 49: South Korea APAC Aviation Fuel Industry Revenue (Million) Forecast, by Application 2019 & 2032
- Table 50: South Korea APAC Aviation Fuel Industry Volume (Litre) Forecast, by Application 2019 & 2032
- Table 51: Southeast Asia APAC Aviation Fuel Industry Revenue (Million) Forecast, by Application 2019 & 2032
- Table 52: Southeast Asia APAC Aviation Fuel Industry Volume (Litre) Forecast, by Application 2019 & 2032
- Table 53: Australia APAC Aviation Fuel Industry Revenue (Million) Forecast, by Application 2019 & 2032
- Table 54: Australia APAC Aviation Fuel Industry Volume (Litre) Forecast, by Application 2019 & 2032
- Table 55: Indonesia APAC Aviation Fuel Industry Revenue (Million) Forecast, by Application 2019 & 2032
- Table 56: Indonesia APAC Aviation Fuel Industry Volume (Litre) Forecast, by Application 2019 & 2032
- Table 57: Phillipes APAC Aviation Fuel Industry Revenue (Million) Forecast, by Application 2019 & 2032
- Table 58: Phillipes APAC Aviation Fuel Industry Volume (Litre) Forecast, by Application 2019 & 2032
- Table 59: Singapore APAC Aviation Fuel Industry Revenue (Million) Forecast, by Application 2019 & 2032
- Table 60: Singapore APAC Aviation Fuel Industry Volume (Litre) Forecast, by Application 2019 & 2032
- Table 61: Thailandc APAC Aviation Fuel Industry Revenue (Million) Forecast, by Application 2019 & 2032
- Table 62: Thailandc APAC Aviation Fuel Industry Volume (Litre) Forecast, by Application 2019 & 2032
- Table 63: Rest of Asia Pacific APAC Aviation Fuel Industry Revenue (Million) Forecast, by Application 2019 & 2032
- Table 64: Rest of Asia Pacific APAC Aviation Fuel Industry Volume (Litre) Forecast, by Application 2019 & 2032
- Table 65: Global APAC Aviation Fuel Industry Revenue Million Forecast, by Country 2019 & 2032
- Table 66: Global APAC Aviation Fuel Industry Volume Litre Forecast, by Country 2019 & 2032
- Table 67: Brazil APAC Aviation Fuel Industry Revenue (Million) Forecast, by Application 2019 & 2032
- Table 68: Brazil APAC Aviation Fuel Industry Volume (Litre) Forecast, by Application 2019 & 2032
- Table 69: Argentina APAC Aviation Fuel Industry Revenue (Million) Forecast, by Application 2019 & 2032
- Table 70: Argentina APAC Aviation Fuel Industry Volume (Litre) Forecast, by Application 2019 & 2032
- Table 71: Peru APAC Aviation Fuel Industry Revenue (Million) Forecast, by Application 2019 & 2032
- Table 72: Peru APAC Aviation Fuel Industry Volume (Litre) Forecast, by Application 2019 & 2032
- Table 73: Chile APAC Aviation Fuel Industry Revenue (Million) Forecast, by Application 2019 & 2032
- Table 74: Chile APAC Aviation Fuel Industry Volume (Litre) Forecast, by Application 2019 & 2032
- Table 75: Colombia APAC Aviation Fuel Industry Revenue (Million) Forecast, by Application 2019 & 2032
- Table 76: Colombia APAC Aviation Fuel Industry Volume (Litre) Forecast, by Application 2019 & 2032
- Table 77: Ecuador APAC Aviation Fuel Industry Revenue (Million) Forecast, by Application 2019 & 2032
- Table 78: Ecuador APAC Aviation Fuel Industry Volume (Litre) Forecast, by Application 2019 & 2032
- Table 79: Venezuela APAC Aviation Fuel Industry Revenue (Million) Forecast, by Application 2019 & 2032
- Table 80: Venezuela APAC Aviation Fuel Industry Volume (Litre) Forecast, by Application 2019 & 2032
- Table 81: Rest of South America APAC Aviation Fuel Industry Revenue (Million) Forecast, by Application 2019 & 2032
- Table 82: Rest of South America APAC Aviation Fuel Industry Volume (Litre) Forecast, by Application 2019 & 2032
- Table 83: Global APAC Aviation Fuel Industry Revenue Million Forecast, by Country 2019 & 2032
- Table 84: Global APAC Aviation Fuel Industry Volume Litre Forecast, by Country 2019 & 2032
- Table 85: United States APAC Aviation Fuel Industry Revenue (Million) Forecast, by Application 2019 & 2032
- Table 86: United States APAC Aviation Fuel Industry Volume (Litre) Forecast, by Application 2019 & 2032
- Table 87: Canada APAC Aviation Fuel Industry Revenue (Million) Forecast, by Application 2019 & 2032
- Table 88: Canada APAC Aviation Fuel Industry Volume (Litre) Forecast, by Application 2019 & 2032
- Table 89: Mexico APAC Aviation Fuel Industry Revenue (Million) Forecast, by Application 2019 & 2032
- Table 90: Mexico APAC Aviation Fuel Industry Volume (Litre) Forecast, by Application 2019 & 2032
- Table 91: Global APAC Aviation Fuel Industry Revenue Million Forecast, by Country 2019 & 2032
- Table 92: Global APAC Aviation Fuel Industry Volume Litre Forecast, by Country 2019 & 2032
- Table 93: United Arab Emirates APAC Aviation Fuel Industry Revenue (Million) Forecast, by Application 2019 & 2032
- Table 94: United Arab Emirates APAC Aviation Fuel Industry Volume (Litre) Forecast, by Application 2019 & 2032
- Table 95: Saudi Arabia APAC Aviation Fuel Industry Revenue (Million) Forecast, by Application 2019 & 2032
- Table 96: Saudi Arabia APAC Aviation Fuel Industry Volume (Litre) Forecast, by Application 2019 & 2032
- Table 97: South Africa APAC Aviation Fuel Industry Revenue (Million) Forecast, by Application 2019 & 2032
- Table 98: South Africa APAC Aviation Fuel Industry Volume (Litre) Forecast, by Application 2019 & 2032
- Table 99: Rest of Middle East and Africa APAC Aviation Fuel Industry Revenue (Million) Forecast, by Application 2019 & 2032
- Table 100: Rest of Middle East and Africa APAC Aviation Fuel Industry Volume (Litre) Forecast, by Application 2019 & 2032
- Table 101: Global APAC Aviation Fuel Industry Revenue Million Forecast, by Fuel Type 2019 & 2032
- Table 102: Global APAC Aviation Fuel Industry Volume Litre Forecast, by Fuel Type 2019 & 2032
- Table 103: Global APAC Aviation Fuel Industry Revenue Million Forecast, by Application 2019 & 2032
- Table 104: Global APAC Aviation Fuel Industry Volume Litre Forecast, by Application 2019 & 2032
- Table 105: Global APAC Aviation Fuel Industry Revenue Million Forecast, by Geography 2019 & 2032
- Table 106: Global APAC Aviation Fuel Industry Volume Litre Forecast, by Geography 2019 & 2032
- Table 107: Global APAC Aviation Fuel Industry Revenue Million Forecast, by Country 2019 & 2032
- Table 108: Global APAC Aviation Fuel Industry Volume Litre Forecast, by Country 2019 & 2032
- Table 109: Global APAC Aviation Fuel Industry Revenue Million Forecast, by Fuel Type 2019 & 2032
- Table 110: Global APAC Aviation Fuel Industry Volume Litre Forecast, by Fuel Type 2019 & 2032
- Table 111: Global APAC Aviation Fuel Industry Revenue Million Forecast, by Application 2019 & 2032
- Table 112: Global APAC Aviation Fuel Industry Volume Litre Forecast, by Application 2019 & 2032
- Table 113: Global APAC Aviation Fuel Industry Revenue Million Forecast, by Geography 2019 & 2032
- Table 114: Global APAC Aviation Fuel Industry Volume Litre Forecast, by Geography 2019 & 2032
- Table 115: Global APAC Aviation Fuel Industry Revenue Million Forecast, by Country 2019 & 2032
- Table 116: Global APAC Aviation Fuel Industry Volume Litre Forecast, by Country 2019 & 2032
- Table 117: Global APAC Aviation Fuel Industry Revenue Million Forecast, by Fuel Type 2019 & 2032
- Table 118: Global APAC Aviation Fuel Industry Volume Litre Forecast, by Fuel Type 2019 & 2032
- Table 119: Global APAC Aviation Fuel Industry Revenue Million Forecast, by Application 2019 & 2032
- Table 120: Global APAC Aviation Fuel Industry Volume Litre Forecast, by Application 2019 & 2032
- Table 121: Global APAC Aviation Fuel Industry Revenue Million Forecast, by Geography 2019 & 2032
- Table 122: Global APAC Aviation Fuel Industry Volume Litre Forecast, by Geography 2019 & 2032
- Table 123: Global APAC Aviation Fuel Industry Revenue Million Forecast, by Country 2019 & 2032
- Table 124: Global APAC Aviation Fuel Industry Volume Litre Forecast, by Country 2019 & 2032
- Table 125: Global APAC Aviation Fuel Industry Revenue Million Forecast, by Fuel Type 2019 & 2032
- Table 126: Global APAC Aviation Fuel Industry Volume Litre Forecast, by Fuel Type 2019 & 2032
- Table 127: Global APAC Aviation Fuel Industry Revenue Million Forecast, by Application 2019 & 2032
- Table 128: Global APAC Aviation Fuel Industry Volume Litre Forecast, by Application 2019 & 2032
- Table 129: Global APAC Aviation Fuel Industry Revenue Million Forecast, by Geography 2019 & 2032
- Table 130: Global APAC Aviation Fuel Industry Volume Litre Forecast, by Geography 2019 & 2032
- Table 131: Global APAC Aviation Fuel Industry Revenue Million Forecast, by Country 2019 & 2032
- Table 132: Global APAC Aviation Fuel Industry Volume Litre Forecast, by Country 2019 & 2032
- Table 133: Global APAC Aviation Fuel Industry Revenue Million Forecast, by Fuel Type 2019 & 2032
- Table 134: Global APAC Aviation Fuel Industry Volume Litre Forecast, by Fuel Type 2019 & 2032
- Table 135: Global APAC Aviation Fuel Industry Revenue Million Forecast, by Application 2019 & 2032
- Table 136: Global APAC Aviation Fuel Industry Volume Litre Forecast, by Application 2019 & 2032
- Table 137: Global APAC Aviation Fuel Industry Revenue Million Forecast, by Geography 2019 & 2032
- Table 138: Global APAC Aviation Fuel Industry Volume Litre Forecast, by Geography 2019 & 2032
- Table 139: Global APAC Aviation Fuel Industry Revenue Million Forecast, by Country 2019 & 2032
- Table 140: Global APAC Aviation Fuel Industry Volume Litre Forecast, by Country 2019 & 2032
- Table 141: Global APAC Aviation Fuel Industry Revenue Million Forecast, by Fuel Type 2019 & 2032
- Table 142: Global APAC Aviation Fuel Industry Volume Litre Forecast, by Fuel Type 2019 & 2032
- Table 143: Global APAC Aviation Fuel Industry Revenue Million Forecast, by Application 2019 & 2032
- Table 144: Global APAC Aviation Fuel Industry Volume Litre Forecast, by Application 2019 & 2032
- Table 145: Global APAC Aviation Fuel Industry Revenue Million Forecast, by Geography 2019 & 2032
- Table 146: Global APAC Aviation Fuel Industry Volume Litre Forecast, by Geography 2019 & 2032
- Table 147: Global APAC Aviation Fuel Industry Revenue Million Forecast, by Country 2019 & 2032
- Table 148: Global APAC Aviation Fuel Industry Volume Litre Forecast, by Country 2019 & 2032
Frequently Asked Questions
1. What is the projected Compound Annual Growth Rate (CAGR) of the APAC Aviation Fuel Industry?
The projected CAGR is approximately > 10.00%.
2. Which companies are prominent players in the APAC Aviation Fuel Industry?
Key companies in the market include BP plc, Bharat Petroleum Corp Ltd, Exxon Mobil Corporation*List Not Exhaustive, Royal Dutch Shell Plc, Pertamina Persero PT, Chevron Corporation, World Fuel Services Corp, Petronas Aviation Sdn Bhd, China Aviation Oil Corporation Ltd, Vitol Holding BV.
3. What are the main segments of the APAC Aviation Fuel Industry?
The market segments include Fuel Type, Application, Geography.
4. Can you provide details about the market size?
The market size is estimated to be USD XX Million as of 2022.
5. What are some drivers contributing to market growth?
4.; Increase in Prices of Electricity Procured from Conventional Mechanisms 4.; Decline in Cost of Solar Energy Infrastructure.
6. What are the notable trends driving market growth?
Commercial Aircraft Segment to Dominate the Market.
7. Are there any restraints impacting market growth?
4.; Competition from Other Alternative Energy Sources.
8. Can you provide examples of recent developments in the market?
N/A
9. What pricing options are available for accessing the report?
Pricing options include single-user, multi-user, and enterprise licenses priced at USD 4750, USD 5250, and USD 8750 respectively.
10. Is the market size provided in terms of value or volume?
The market size is provided in terms of value, measured in Million and volume, measured in Litre.
11. Are there any specific market keywords associated with the report?
Yes, the market keyword associated with the report is "APAC Aviation Fuel Industry," which aids in identifying and referencing the specific market segment covered.
12. How do I determine which pricing option suits my needs best?
The pricing options vary based on user requirements and access needs. Individual users may opt for single-user licenses, while businesses requiring broader access may choose multi-user or enterprise licenses for cost-effective access to the report.
13. Are there any additional resources or data provided in the APAC Aviation Fuel Industry report?
While the report offers comprehensive insights, it's advisable to review the specific contents or supplementary materials provided to ascertain if additional resources or data are available.
14. How can I stay updated on further developments or reports in the APAC Aviation Fuel Industry?
To stay informed about further developments, trends, and reports in the APAC Aviation Fuel Industry, consider subscribing to industry newsletters, following relevant companies and organizations, or regularly checking reputable industry news sources and publications.
Methodology
Step 1 - Identification of Relevant Samples Size from Population Database


Step 2 - Approaches for Defining Global Market Size (Value, Volume* & Price*)

Note*: In applicable scenarios
Step 3 - Data Sources
Primary Research
- Web Analytics
- Survey Reports
- Research Institute
- Latest Research Reports
- Opinion Leaders
Secondary Research
- Annual Reports
- White Paper
- Latest Press Release
- Industry Association
- Paid Database
- Investor Presentations

Step 4 - Data Triangulation
Involves using different sources of information in order to increase the validity of a study
These sources are likely to be stakeholders in a program - participants, other researchers, program staff, other community members, and so on.
Then we put all data in single framework & apply various statistical tools to find out the dynamic on the market.
During the analysis stage, feedback from the stakeholder groups would be compared to determine areas of agreement as well as areas of divergence
