

Key Insights
The Augmented Reality (AR) and Mixed Reality (MR) market is poised for substantial expansion, forecasted to reach 120.21 billion by 2025, driven by a robust Compound Annual Growth Rate (CAGR) of 29.7%. Key growth drivers include increasing device affordability and accessibility, continuous hardware and software advancements enhancing user experience, and widespread integration across diverse industries such as gaming, healthcare, and manufacturing. Expanding application possibilities in immersive entertainment, remote collaboration, and advanced training simulations are solidifying AR/MR's indispensable role.
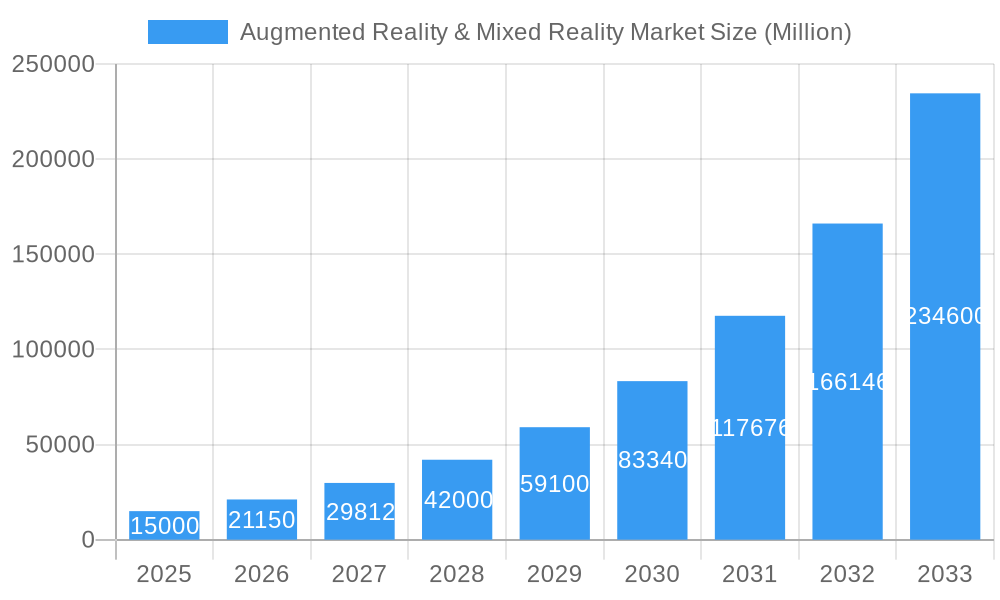
Augmented Reality & Mixed Reality Market Market Size (In Billion)
Market segmentation highlights significant potential across end-user verticals. While consumers drive adoption through gaming and entertainment, medical, healthcare, industrial, education, and defense sectors present promising opportunities for applications like surgical simulations, remote monitoring, manufacturing efficiency, and enhanced training. Despite challenges related to cost, complexity, and content development, sustained and robust market growth is anticipated. North America and Asia-Pacific are expected to lead market penetration due to high technology adoption and significant R&D investments.
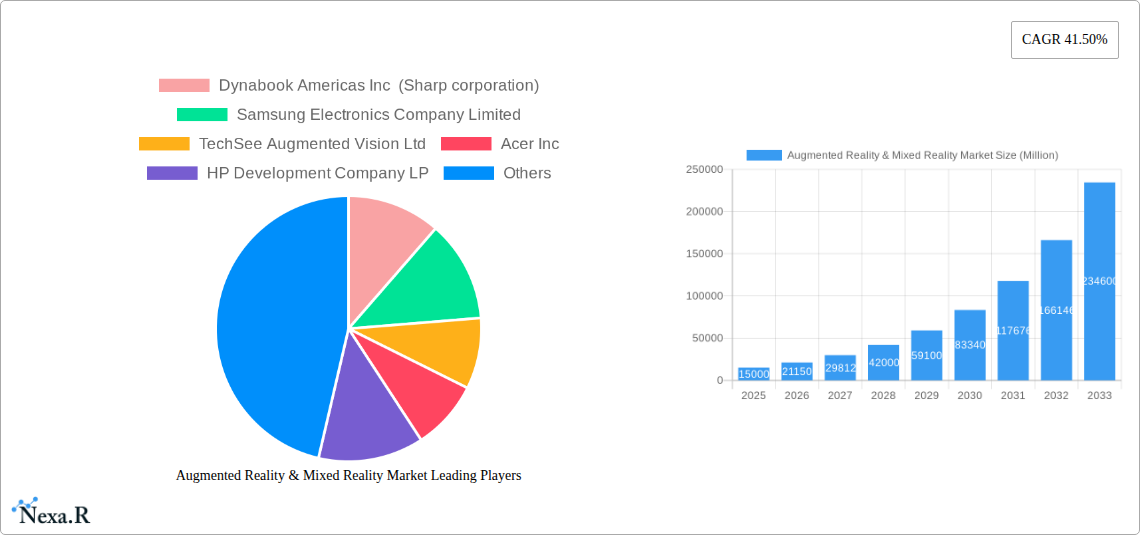
Augmented Reality & Mixed Reality Market Company Market Share
Augmented Reality & Mixed Reality Market: A Comprehensive Market Report (2019-2033)
This in-depth report provides a comprehensive analysis of the Augmented Reality (AR) & Mixed Reality (MR) market, encompassing market dynamics, growth trends, regional dominance, product landscapes, and key players. The study period spans from 2019 to 2033, with 2025 serving as the base and estimated year. The report forecasts market trends from 2025 to 2033, leveraging data from the historical period of 2019-2024. This report is essential for industry professionals, investors, and strategists seeking actionable insights into this rapidly evolving technological landscape. The market is segmented by end-user vertical, including Consumer, Medical and Healthcare, Industrial, and Other End-User Verticals (Education, Military, and Defense). The total market size is projected to reach xx Million by 2033.
Augmented Reality & Mixed Reality Market Dynamics & Structure
The AR/MR market is characterized by a moderately concentrated landscape with several key players vying for market share. Technological innovation, particularly in areas like display technology, processing power, and sensor integration, is a major driver of market growth. Regulatory frameworks governing data privacy and safety standards are evolving and influencing market dynamics. Competitive product substitutes, such as traditional display technologies, pose a challenge, while end-user demographics (particularly the younger generation's adoption) are pivotal. Mergers and acquisitions (M&A) activity is significant, with larger companies strategically acquiring smaller innovative firms to expand their product portfolios and technological capabilities.
- Market Concentration: Moderately concentrated, with a few dominant players and numerous smaller niche players. The top 5 players hold approximately xx% of the market share in 2025.
- Technological Innovation: MicroLED display technology, advancements in computer vision, and improved haptic feedback are key innovation drivers.
- Regulatory Frameworks: Data privacy regulations (e.g., GDPR) and safety standards for AR/MR devices are shaping market development.
- Competitive Product Substitutes: Traditional displays and alternative user interfaces pose competitive pressures.
- End-User Demographics: Younger generations are driving adoption rates, with the older population segment showing slower penetration.
- M&A Trends: Significant M&A activity, with an average of xx deals per year between 2019 and 2024.
Augmented Reality & Mixed Reality Market Growth Trends & Insights
The AR/MR market exhibits robust growth, driven by increasing consumer adoption, technological advancements, and expansion into diverse industry verticals. The market experienced a CAGR of xx% during the historical period (2019-2024) and is projected to maintain a CAGR of xx% during the forecast period (2025-2033). Technological disruptions, such as the introduction of 5G and improved battery life, are accelerating market penetration. Consumer behavior is shifting towards greater acceptance of immersive technologies, fostering market expansion. Specific market segments, such as the industrial and medical sectors, are experiencing particularly high growth rates due to enhanced productivity and improved healthcare outcomes. The market size is expected to reach xx Million by 2033, driven by a combination of increasing adoption rates across verticals and the introduction of innovative applications. The penetration rate is expected to reach xx% by 2033, up from xx% in 2025.
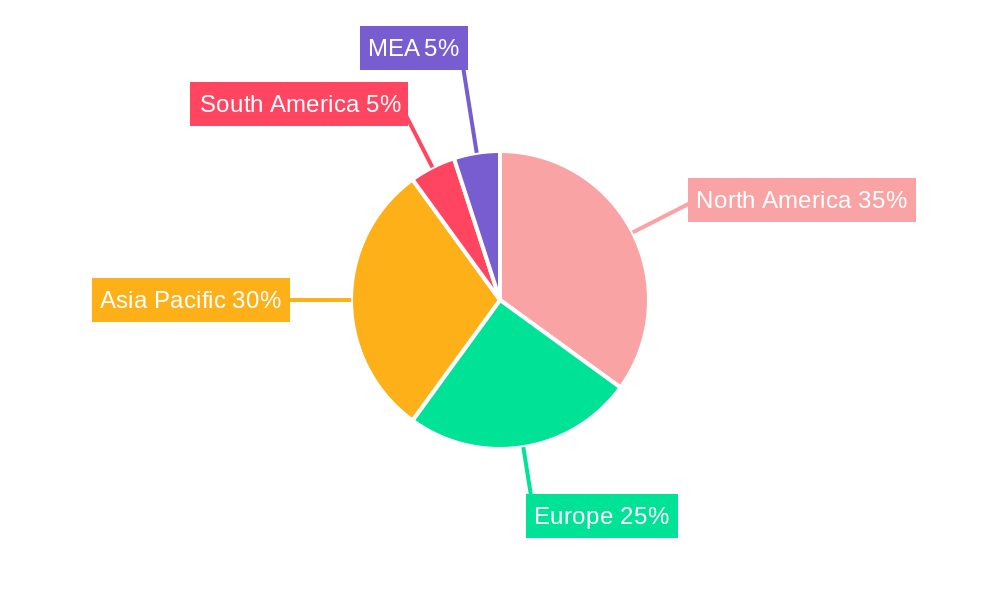
Dominant Regions, Countries, or Segments in Augmented Reality & Mixed Reality Market
North America currently holds the largest market share in the AR/MR market, driven by early adoption of technology, strong research and development investments, and a robust industrial sector. However, the Asia-Pacific region is poised for rapid growth, fueled by increasing smartphone penetration, expanding manufacturing capabilities, and favorable government policies. Within the segment breakdown, the Industrial sector displays the highest growth potential due to the increasing demand for enhanced efficiency and remote collaboration in manufacturing, logistics, and other industrial applications. The Medical and Healthcare sector is witnessing significant growth due to the application of AR/MR in surgical procedures, diagnostics, and patient rehabilitation.
- North America: Strong R&D investment, high early adoption, and advanced industrial sector drive market leadership.
- Asia-Pacific: Rapid growth driven by increasing smartphone penetration, expanding manufacturing, and supportive government policies.
- Industrial Sector: Highest growth potential due to increased demand for efficiency and remote collaboration.
- Medical and Healthcare Sector: Significant growth driven by AR/MR applications in surgery, diagnostics, and rehabilitation.
Augmented Reality & Mixed Reality Market Product Landscape
The AR/MR product landscape is dynamic, with a wide range of devices and applications constantly evolving. Head-mounted displays (HMDs), smart glasses, and handheld AR devices dominate the market. These products offer varying levels of immersion, functionality, and price points. Performance metrics such as field of view (FOV), latency, and processing power are key factors influencing consumer and enterprise adoption. Unique selling propositions (USPs) include innovative features such as hand tracking, eye tracking, and advanced spatial computing capabilities. Technological advancements continuously enhance the user experience, driving increased market penetration.
Key Drivers, Barriers & Challenges in Augmented Reality & Mixed Reality Market
Key Drivers:
- Technological advancements: Improved display technology, processing power, and sensor integration are driving market growth.
- Increasing consumer adoption: Growing acceptance of immersive technologies fuels market expansion.
- Expanding applications across various sectors: AR/MR solutions find application in diverse fields, driving sector-specific growth.
Key Barriers and Challenges:
- High cost of devices: The price of AR/MR devices remains a significant barrier to widespread adoption.
- Content limitations: A lack of high-quality, engaging content restricts market growth.
- Technical challenges: Issues such as motion sickness, latency, and limited battery life hinder the adoption of AR/MR.
- Regulatory uncertainty: Evolving regulations and standards pose challenges to market development.
Emerging Opportunities in Augmented Reality & Mixed Reality Market
Untapped markets, particularly in developing economies, offer substantial growth potential for AR/MR technologies. Innovative applications in education, training, and entertainment are emerging as significant growth drivers. The evolving consumer preference for personalized experiences and immersive interactions creates lucrative opportunities for new AR/MR products and services. The integration of AR/MR with other technologies, like the Internet of Things (IoT) and Artificial Intelligence (AI), is creating new avenues for innovation and market expansion.
Growth Accelerators in the Augmented Reality & Mixed Reality Market Industry
Technological breakthroughs, including advancements in microLED displays and improved processing power, are accelerating market growth. Strategic partnerships between technology providers and industry players are expanding the application of AR/MR technologies across various sectors. Market expansion into new geographical regions and underserved markets is unlocking additional growth opportunities. Furthermore, continuous refinement of AR/MR software and applications are enhancing user experience and driving wider adoption.
Key Players Shaping the Augmented Reality & Mixed Reality Market Market
- Dynabook Americas Inc (Sharp corporation)
- Samsung Electronics Company Limited
- TechSee Augmented Vision Ltd
- Acer Inc
- HP Development Company LP
- Magic Leap Inc
- Amber Garage (Holokit)
- Wikitude GMBH
- Google LLC (Alphabet Inc)
- Microsoft Corporation
- Vuzix Corporation
- Ultraleap Limited
- AsusTek Computer Inc
- Seiko Epson Corporation
- PTC Inc
- Niantic Inc
- Dell Technologies Inc
- Occipital Inc
- Realwear Inc
- Atheer Inc
- Optinvent
- Blippar com Ltd
Notable Milestones in Augmented Reality & Mixed Reality Market Sector
- October 2022: Micledi Microdisplays and Kura Technologies collaborate to manufacture AR glasses incorporating 300mm microLED displays. This significantly improves the performance of next-generation AR glasses.
- May 2022: Vuzix Corporation announces an agreement with Atomistic SAS for mLED technology, potentially leading to the acquisition of Atomistic and the development of advanced AR glasses. This highlights the ongoing drive for improved display technology in the AR/MR market.
In-Depth Augmented Reality & Mixed Reality Market Market Outlook
The AR/MR market is poised for continued strong growth, driven by technological advancements, expanding applications, and increasing consumer adoption. Strategic opportunities exist in exploring new market segments, developing innovative applications, and forging strategic partnerships to accelerate market penetration. The focus on improving user experience, addressing technical challenges, and fostering content development will be crucial for unlocking the full potential of the AR/MR market. The future potential is vast, with applications extending far beyond current implementations.
Augmented Reality & Mixed Reality Market Segmentation
-
1. Type
- 1.1. Hardware
- 1.2. Software
-
2. End-user Vertical
- 2.1. Gaming
- 2.2. Education
- 2.3. Healthcare
- 2.4. Retail and Advertising
- 2.5. Automotive
- 2.6. Military and Defense
- 2.7. Other End-user Verticals
-
3. End-user Vertical
- 3.1. Consumer
- 3.2. Medical and Healthcare
- 3.3. Industrial
- 3.4. Other End-user
Augmented Reality & Mixed Reality Market Segmentation By Geography
- 1. North America
- 2. Europe
- 3. Asia Pacific
- 4. Rest of the World
- 5. North America
- 6. Europe
- 7. Asia Pacific
- 8. Rest of the World
Augmented Reality & Mixed Reality Market Regional Market Share
Geographic Coverage of Augmented Reality & Mixed Reality Market
Augmented Reality & Mixed Reality Market REPORT HIGHLIGHTS
| Aspects | Details |
|---|---|
| Study Period | 2020-2034 |
| Base Year | 2025 |
| Estimated Year | 2026 |
| Forecast Period | 2026-2034 |
| Historical Period | 2020-2025 |
| Growth Rate | CAGR of 29.7% from 2020-2034 |
| Segmentation |
|
Table of Contents
- 1. Introduction
- 1.1. Research Scope
- 1.2. Market Segmentation
- 1.3. Research Objective
- 1.4. Definitions and Assumptions
- 2. Executive Summary
- 2.1. Market Snapshot
- 3. Market Dynamics
- 3.1. Market Drivers
- 3.2. Market Restrains
- 3.3. Market Trends
- 3.4. Market Opportunities
- 4. Market Factor Analysis
- 4.1. Porters Five Forces
- 4.1.1. Bargaining Power of Suppliers
- 4.1.2. Bargaining Power of Buyers
- 4.1.3. Threat of New Entrants
- 4.1.4. Threat of Substitutes
- 4.1.5. Competitive Rivalry
- 4.2. PESTEL analysis
- 4.3. BCG Analysis
- 4.3.1. Stars (High Growth, High Market Share)
- 4.3.2. Cash Cows (Low Growth, High Market Share)
- 4.3.3. Question Mark (High Growth, Low Market Share)
- 4.3.4. Dogs (Low Growth, Low Market Share)
- 4.4. Ansoff Matrix Analysis
- 4.5. Supply Chain Analysis
- 4.6. Regulatory Landscape
- 4.7. Current Market Potential and Opportunity Assessment (TAM–SAM–SOM Framework)
- 4.8. NRP Analyst Note
- 4.1. Porters Five Forces
- 5. Market Analysis, Insights and Forecast 2021-2033
- 5.1. Market Analysis, Insights and Forecast - by Type
- 5.1.1. Hardware
- 5.1.2. Software
- 5.2. Market Analysis, Insights and Forecast - by End-user Vertical
- 5.2.1. Gaming
- 5.2.2. Education
- 5.2.3. Healthcare
- 5.2.4. Retail and Advertising
- 5.2.5. Automotive
- 5.2.6. Military and Defense
- 5.2.7. Other End-user Verticals
- 5.3. Market Analysis, Insights and Forecast - by End-user Vertical
- 5.3.1. Consumer
- 5.3.2. Medical and Healthcare
- 5.3.3. Industrial
- 5.3.4. Other End-user
- 5.4. Market Analysis, Insights and Forecast - by Region
- 5.4.1. North America
- 5.4.2. Europe
- 5.4.3. Asia Pacific
- 5.4.4. Rest of the World
- 5.4.5. North America
- 5.4.6. Europe
- 5.4.7. Asia Pacific
- 5.4.8. Rest of the World
- 5.1. Market Analysis, Insights and Forecast - by Type
- 6. Global Augmented Reality & Mixed Reality Market Analysis, Insights and Forecast, 2021-2033
- 6.1. Market Analysis, Insights and Forecast - by Type
- 6.1.1. Hardware
- 6.1.2. Software
- 6.2. Market Analysis, Insights and Forecast - by End-user Vertical
- 6.2.1. Gaming
- 6.2.2. Education
- 6.2.3. Healthcare
- 6.2.4. Retail and Advertising
- 6.2.5. Automotive
- 6.2.6. Military and Defense
- 6.2.7. Other End-user Verticals
- 6.3. Market Analysis, Insights and Forecast - by End-user Vertical
- 6.3.1. Consumer
- 6.3.2. Medical and Healthcare
- 6.3.3. Industrial
- 6.3.4. Other End-user
- 6.1. Market Analysis, Insights and Forecast - by Type
- 7. North America Augmented Reality & Mixed Reality Market Analysis, Insights and Forecast, 2020-2032
- 7.1. Market Analysis, Insights and Forecast - by Type
- 7.1.1. Hardware
- 7.1.2. Software
- 7.2. Market Analysis, Insights and Forecast - by End-user Vertical
- 7.2.1. Gaming
- 7.2.2. Education
- 7.2.3. Healthcare
- 7.2.4. Retail and Advertising
- 7.2.5. Automotive
- 7.2.6. Military and Defense
- 7.2.7. Other End-user Verticals
- 7.3. Market Analysis, Insights and Forecast - by End-user Vertical
- 7.3.1. Consumer
- 7.3.2. Medical and Healthcare
- 7.3.3. Industrial
- 7.3.4. Other End-user
- 7.1. Market Analysis, Insights and Forecast - by Type
- 8. Europe Augmented Reality & Mixed Reality Market Analysis, Insights and Forecast, 2020-2032
- 8.1. Market Analysis, Insights and Forecast - by Type
- 8.1.1. Hardware
- 8.1.2. Software
- 8.2. Market Analysis, Insights and Forecast - by End-user Vertical
- 8.2.1. Gaming
- 8.2.2. Education
- 8.2.3. Healthcare
- 8.2.4. Retail and Advertising
- 8.2.5. Automotive
- 8.2.6. Military and Defense
- 8.2.7. Other End-user Verticals
- 8.3. Market Analysis, Insights and Forecast - by End-user Vertical
- 8.3.1. Consumer
- 8.3.2. Medical and Healthcare
- 8.3.3. Industrial
- 8.3.4. Other End-user
- 8.1. Market Analysis, Insights and Forecast - by Type
- 9. Asia Pacific Augmented Reality & Mixed Reality Market Analysis, Insights and Forecast, 2020-2032
- 9.1. Market Analysis, Insights and Forecast - by Type
- 9.1.1. Hardware
- 9.1.2. Software
- 9.2. Market Analysis, Insights and Forecast - by End-user Vertical
- 9.2.1. Gaming
- 9.2.2. Education
- 9.2.3. Healthcare
- 9.2.4. Retail and Advertising
- 9.2.5. Automotive
- 9.2.6. Military and Defense
- 9.2.7. Other End-user Verticals
- 9.3. Market Analysis, Insights and Forecast - by End-user Vertical
- 9.3.1. Consumer
- 9.3.2. Medical and Healthcare
- 9.3.3. Industrial
- 9.3.4. Other End-user
- 9.1. Market Analysis, Insights and Forecast - by Type
- 10. Rest of the World Augmented Reality & Mixed Reality Market Analysis, Insights and Forecast, 2020-2032
- 10.1. Market Analysis, Insights and Forecast - by Type
- 10.1.1. Hardware
- 10.1.2. Software
- 10.2. Market Analysis, Insights and Forecast - by End-user Vertical
- 10.2.1. Gaming
- 10.2.2. Education
- 10.2.3. Healthcare
- 10.2.4. Retail and Advertising
- 10.2.5. Automotive
- 10.2.6. Military and Defense
- 10.2.7. Other End-user Verticals
- 10.3. Market Analysis, Insights and Forecast - by End-user Vertical
- 10.3.1. Consumer
- 10.3.2. Medical and Healthcare
- 10.3.3. Industrial
- 10.3.4. Other End-user
- 10.1. Market Analysis, Insights and Forecast - by Type
- 11. North America Augmented Reality & Mixed Reality Market Analysis, Insights and Forecast, 2020-2032
- 11.1. Market Analysis, Insights and Forecast - by Type
- 11.1.1. Hardware
- 11.1.2. Software
- 11.2. Market Analysis, Insights and Forecast - by End-user Vertical
- 11.2.1. Gaming
- 11.2.2. Education
- 11.2.3. Healthcare
- 11.2.4. Retail and Advertising
- 11.2.5. Automotive
- 11.2.6. Military and Defense
- 11.2.7. Other End-user Verticals
- 11.3. Market Analysis, Insights and Forecast - by End-user Vertical
- 11.3.1. Consumer
- 11.3.2. Medical and Healthcare
- 11.3.3. Industrial
- 11.3.4. Other End-user
- 11.1. Market Analysis, Insights and Forecast - by Type
- 12. Europe Augmented Reality & Mixed Reality Market Analysis, Insights and Forecast, 2020-2032
- 12.1. Market Analysis, Insights and Forecast - by Type
- 12.1.1. Hardware
- 12.1.2. Software
- 12.2. Market Analysis, Insights and Forecast - by End-user Vertical
- 12.2.1. Gaming
- 12.2.2. Education
- 12.2.3. Healthcare
- 12.2.4. Retail and Advertising
- 12.2.5. Automotive
- 12.2.6. Military and Defense
- 12.2.7. Other End-user Verticals
- 12.3. Market Analysis, Insights and Forecast - by End-user Vertical
- 12.3.1. Consumer
- 12.3.2. Medical and Healthcare
- 12.3.3. Industrial
- 12.3.4. Other End-user
- 12.1. Market Analysis, Insights and Forecast - by Type
- 13. Asia Pacific Augmented Reality & Mixed Reality Market Analysis, Insights and Forecast, 2020-2032
- 13.1. Market Analysis, Insights and Forecast - by Type
- 13.1.1. Hardware
- 13.1.2. Software
- 13.2. Market Analysis, Insights and Forecast - by End-user Vertical
- 13.2.1. Gaming
- 13.2.2. Education
- 13.2.3. Healthcare
- 13.2.4. Retail and Advertising
- 13.2.5. Automotive
- 13.2.6. Military and Defense
- 13.2.7. Other End-user Verticals
- 13.3. Market Analysis, Insights and Forecast - by End-user Vertical
- 13.3.1. Consumer
- 13.3.2. Medical and Healthcare
- 13.3.3. Industrial
- 13.3.4. Other End-user
- 13.1. Market Analysis, Insights and Forecast - by Type
- 14. Rest of the World Augmented Reality & Mixed Reality Market Analysis, Insights and Forecast, 2020-2032
- 14.1. Market Analysis, Insights and Forecast - by Type
- 14.1.1. Hardware
- 14.1.2. Software
- 14.2. Market Analysis, Insights and Forecast - by End-user Vertical
- 14.2.1. Gaming
- 14.2.2. Education
- 14.2.3. Healthcare
- 14.2.4. Retail and Advertising
- 14.2.5. Automotive
- 14.2.6. Military and Defense
- 14.2.7. Other End-user Verticals
- 14.3. Market Analysis, Insights and Forecast - by End-user Vertical
- 14.3.1. Consumer
- 14.3.2. Medical and Healthcare
- 14.3.3. Industrial
- 14.3.4. Other End-user
- 14.1. Market Analysis, Insights and Forecast - by Type
- 15. Competitive Analysis
- 15.1. Company Profiles
- 15.1.1 Dynabook Americas Inc (Sharp corporation)
- 15.1.1.1. Company Overview
- 15.1.1.2. Products
- 15.1.1.3. Company Financials
- 15.1.1.4. SWOT Analysis
- 15.1.2 Samsung Electronics Company Limited
- 15.1.2.1. Company Overview
- 15.1.2.2. Products
- 15.1.2.3. Company Financials
- 15.1.2.4. SWOT Analysis
- 15.1.3 TechSee Augmented Vision Ltd
- 15.1.3.1. Company Overview
- 15.1.3.2. Products
- 15.1.3.3. Company Financials
- 15.1.3.4. SWOT Analysis
- 15.1.4 Acer Inc
- 15.1.4.1. Company Overview
- 15.1.4.2. Products
- 15.1.4.3. Company Financials
- 15.1.4.4. SWOT Analysis
- 15.1.5 HP Development Company LP
- 15.1.5.1. Company Overview
- 15.1.5.2. Products
- 15.1.5.3. Company Financials
- 15.1.5.4. SWOT Analysis
- 15.1.6 Magic Leap Inc
- 15.1.6.1. Company Overview
- 15.1.6.2. Products
- 15.1.6.3. Company Financials
- 15.1.6.4. SWOT Analysis
- 15.1.7 Amber Garage (Holokit)
- 15.1.7.1. Company Overview
- 15.1.7.2. Products
- 15.1.7.3. Company Financials
- 15.1.7.4. SWOT Analysis
- 15.1.8 Wikitude GMBH
- 15.1.8.1. Company Overview
- 15.1.8.2. Products
- 15.1.8.3. Company Financials
- 15.1.8.4. SWOT Analysis
- 15.1.9 Google LLC (Alphabet Inc )
- 15.1.9.1. Company Overview
- 15.1.9.2. Products
- 15.1.9.3. Company Financials
- 15.1.9.4. SWOT Analysis
- 15.1.10 Microsoft Corporation
- 15.1.10.1. Company Overview
- 15.1.10.2. Products
- 15.1.10.3. Company Financials
- 15.1.10.4. SWOT Analysis
- 15.1.11 Vuzix Corporation
- 15.1.11.1. Company Overview
- 15.1.11.2. Products
- 15.1.11.3. Company Financials
- 15.1.11.4. SWOT Analysis
- 15.1.12 Ultraleap Limited
- 15.1.12.1. Company Overview
- 15.1.12.2. Products
- 15.1.12.3. Company Financials
- 15.1.12.4. SWOT Analysis
- 15.1.13 AsusTek Computer Inc
- 15.1.13.1. Company Overview
- 15.1.13.2. Products
- 15.1.13.3. Company Financials
- 15.1.13.4. SWOT Analysis
- 15.1.14 Seiko Epson Corporation
- 15.1.14.1. Company Overview
- 15.1.14.2. Products
- 15.1.14.3. Company Financials
- 15.1.14.4. SWOT Analysis
- 15.1.15 PTC Inc
- 15.1.15.1. Company Overview
- 15.1.15.2. Products
- 15.1.15.3. Company Financials
- 15.1.15.4. SWOT Analysis
- 15.1.16 Niantic Inc
- 15.1.16.1. Company Overview
- 15.1.16.2. Products
- 15.1.16.3. Company Financials
- 15.1.16.4. SWOT Analysis
- 15.1.17 Dell Technologies Inc
- 15.1.17.1. Company Overview
- 15.1.17.2. Products
- 15.1.17.3. Company Financials
- 15.1.17.4. SWOT Analysis
- 15.1.18 Occipital Inc
- 15.1.18.1. Company Overview
- 15.1.18.2. Products
- 15.1.18.3. Company Financials
- 15.1.18.4. SWOT Analysis
- 15.1.19 Realwear Inc
- 15.1.19.1. Company Overview
- 15.1.19.2. Products
- 15.1.19.3. Company Financials
- 15.1.19.4. SWOT Analysis
- 15.1.20 Atheer Inc
- 15.1.20.1. Company Overview
- 15.1.20.2. Products
- 15.1.20.3. Company Financials
- 15.1.20.4. SWOT Analysis
- 15.1.21 Optinvent
- 15.1.21.1. Company Overview
- 15.1.21.2. Products
- 15.1.21.3. Company Financials
- 15.1.21.4. SWOT Analysis
- 15.1.22 Blippar com Ltd
- 15.1.22.1. Company Overview
- 15.1.22.2. Products
- 15.1.22.3. Company Financials
- 15.1.22.4. SWOT Analysis
- 15.1.1 Dynabook Americas Inc (Sharp corporation)
- 15.2. Market Entropy
- 15.2.1 Company's Key Areas Served
- 15.2.2 Recent Developments
- 15.3. Company Market Share Analysis 2025
- 15.3.1 Top 5 Companies Market Share Analysis
- 15.3.2 Top 3 Companies Market Share Analysis
- 15.4. List of Potential Customers
- 16. Research Methodology
List of Figures
- Figure 1: Global Augmented Reality & Mixed Reality Market Revenue Breakdown (billion, %) by Region 2025 & 2033
- Figure 2: Global Augmented Reality & Mixed Reality Market Volume Breakdown (K Unit, %) by Region 2025 & 2033
- Figure 3: North America Augmented Reality & Mixed Reality Market Revenue (billion), by Type 2025 & 2033
- Figure 4: North America Augmented Reality & Mixed Reality Market Volume (K Unit), by Type 2025 & 2033
- Figure 5: North America Augmented Reality & Mixed Reality Market Revenue Share (%), by Type 2025 & 2033
- Figure 6: North America Augmented Reality & Mixed Reality Market Volume Share (%), by Type 2025 & 2033
- Figure 7: North America Augmented Reality & Mixed Reality Market Revenue (billion), by End-user Vertical 2025 & 2033
- Figure 8: North America Augmented Reality & Mixed Reality Market Volume (K Unit), by End-user Vertical 2025 & 2033
- Figure 9: North America Augmented Reality & Mixed Reality Market Revenue Share (%), by End-user Vertical 2025 & 2033
- Figure 10: North America Augmented Reality & Mixed Reality Market Volume Share (%), by End-user Vertical 2025 & 2033
- Figure 11: North America Augmented Reality & Mixed Reality Market Revenue (billion), by End-user Vertical 2025 & 2033
- Figure 12: North America Augmented Reality & Mixed Reality Market Volume (K Unit), by End-user Vertical 2025 & 2033
- Figure 13: North America Augmented Reality & Mixed Reality Market Revenue Share (%), by End-user Vertical 2025 & 2033
- Figure 14: North America Augmented Reality & Mixed Reality Market Volume Share (%), by End-user Vertical 2025 & 2033
- Figure 15: North America Augmented Reality & Mixed Reality Market Revenue (billion), by Country 2025 & 2033
- Figure 16: North America Augmented Reality & Mixed Reality Market Volume (K Unit), by Country 2025 & 2033
- Figure 17: North America Augmented Reality & Mixed Reality Market Revenue Share (%), by Country 2025 & 2033
- Figure 18: North America Augmented Reality & Mixed Reality Market Volume Share (%), by Country 2025 & 2033
- Figure 19: Europe Augmented Reality & Mixed Reality Market Revenue (billion), by Type 2025 & 2033
- Figure 20: Europe Augmented Reality & Mixed Reality Market Volume (K Unit), by Type 2025 & 2033
- Figure 21: Europe Augmented Reality & Mixed Reality Market Revenue Share (%), by Type 2025 & 2033
- Figure 22: Europe Augmented Reality & Mixed Reality Market Volume Share (%), by Type 2025 & 2033
- Figure 23: Europe Augmented Reality & Mixed Reality Market Revenue (billion), by End-user Vertical 2025 & 2033
- Figure 24: Europe Augmented Reality & Mixed Reality Market Volume (K Unit), by End-user Vertical 2025 & 2033
- Figure 25: Europe Augmented Reality & Mixed Reality Market Revenue Share (%), by End-user Vertical 2025 & 2033
- Figure 26: Europe Augmented Reality & Mixed Reality Market Volume Share (%), by End-user Vertical 2025 & 2033
- Figure 27: Europe Augmented Reality & Mixed Reality Market Revenue (billion), by End-user Vertical 2025 & 2033
- Figure 28: Europe Augmented Reality & Mixed Reality Market Volume (K Unit), by End-user Vertical 2025 & 2033
- Figure 29: Europe Augmented Reality & Mixed Reality Market Revenue Share (%), by End-user Vertical 2025 & 2033
- Figure 30: Europe Augmented Reality & Mixed Reality Market Volume Share (%), by End-user Vertical 2025 & 2033
- Figure 31: Europe Augmented Reality & Mixed Reality Market Revenue (billion), by Country 2025 & 2033
- Figure 32: Europe Augmented Reality & Mixed Reality Market Volume (K Unit), by Country 2025 & 2033
- Figure 33: Europe Augmented Reality & Mixed Reality Market Revenue Share (%), by Country 2025 & 2033
- Figure 34: Europe Augmented Reality & Mixed Reality Market Volume Share (%), by Country 2025 & 2033
- Figure 35: Asia Pacific Augmented Reality & Mixed Reality Market Revenue (billion), by Type 2025 & 2033
- Figure 36: Asia Pacific Augmented Reality & Mixed Reality Market Volume (K Unit), by Type 2025 & 2033
- Figure 37: Asia Pacific Augmented Reality & Mixed Reality Market Revenue Share (%), by Type 2025 & 2033
- Figure 38: Asia Pacific Augmented Reality & Mixed Reality Market Volume Share (%), by Type 2025 & 2033
- Figure 39: Asia Pacific Augmented Reality & Mixed Reality Market Revenue (billion), by End-user Vertical 2025 & 2033
- Figure 40: Asia Pacific Augmented Reality & Mixed Reality Market Volume (K Unit), by End-user Vertical 2025 & 2033
- Figure 41: Asia Pacific Augmented Reality & Mixed Reality Market Revenue Share (%), by End-user Vertical 2025 & 2033
- Figure 42: Asia Pacific Augmented Reality & Mixed Reality Market Volume Share (%), by End-user Vertical 2025 & 2033
- Figure 43: Asia Pacific Augmented Reality & Mixed Reality Market Revenue (billion), by End-user Vertical 2025 & 2033
- Figure 44: Asia Pacific Augmented Reality & Mixed Reality Market Volume (K Unit), by End-user Vertical 2025 & 2033
- Figure 45: Asia Pacific Augmented Reality & Mixed Reality Market Revenue Share (%), by End-user Vertical 2025 & 2033
- Figure 46: Asia Pacific Augmented Reality & Mixed Reality Market Volume Share (%), by End-user Vertical 2025 & 2033
- Figure 47: Asia Pacific Augmented Reality & Mixed Reality Market Revenue (billion), by Country 2025 & 2033
- Figure 48: Asia Pacific Augmented Reality & Mixed Reality Market Volume (K Unit), by Country 2025 & 2033
- Figure 49: Asia Pacific Augmented Reality & Mixed Reality Market Revenue Share (%), by Country 2025 & 2033
- Figure 50: Asia Pacific Augmented Reality & Mixed Reality Market Volume Share (%), by Country 2025 & 2033
- Figure 51: Rest of the World Augmented Reality & Mixed Reality Market Revenue (billion), by Type 2025 & 2033
- Figure 52: Rest of the World Augmented Reality & Mixed Reality Market Volume (K Unit), by Type 2025 & 2033
- Figure 53: Rest of the World Augmented Reality & Mixed Reality Market Revenue Share (%), by Type 2025 & 2033
- Figure 54: Rest of the World Augmented Reality & Mixed Reality Market Volume Share (%), by Type 2025 & 2033
- Figure 55: Rest of the World Augmented Reality & Mixed Reality Market Revenue (billion), by End-user Vertical 2025 & 2033
- Figure 56: Rest of the World Augmented Reality & Mixed Reality Market Volume (K Unit), by End-user Vertical 2025 & 2033
- Figure 57: Rest of the World Augmented Reality & Mixed Reality Market Revenue Share (%), by End-user Vertical 2025 & 2033
- Figure 58: Rest of the World Augmented Reality & Mixed Reality Market Volume Share (%), by End-user Vertical 2025 & 2033
- Figure 59: Rest of the World Augmented Reality & Mixed Reality Market Revenue (billion), by End-user Vertical 2025 & 2033
- Figure 60: Rest of the World Augmented Reality & Mixed Reality Market Volume (K Unit), by End-user Vertical 2025 & 2033
- Figure 61: Rest of the World Augmented Reality & Mixed Reality Market Revenue Share (%), by End-user Vertical 2025 & 2033
- Figure 62: Rest of the World Augmented Reality & Mixed Reality Market Volume Share (%), by End-user Vertical 2025 & 2033
- Figure 63: Rest of the World Augmented Reality & Mixed Reality Market Revenue (billion), by Country 2025 & 2033
- Figure 64: Rest of the World Augmented Reality & Mixed Reality Market Volume (K Unit), by Country 2025 & 2033
- Figure 65: Rest of the World Augmented Reality & Mixed Reality Market Revenue Share (%), by Country 2025 & 2033
- Figure 66: Rest of the World Augmented Reality & Mixed Reality Market Volume Share (%), by Country 2025 & 2033
- Figure 67: North America Augmented Reality & Mixed Reality Market Revenue (billion), by Type 2025 & 2033
- Figure 68: North America Augmented Reality & Mixed Reality Market Volume (K Unit), by Type 2025 & 2033
- Figure 69: North America Augmented Reality & Mixed Reality Market Revenue Share (%), by Type 2025 & 2033
- Figure 70: North America Augmented Reality & Mixed Reality Market Volume Share (%), by Type 2025 & 2033
- Figure 71: North America Augmented Reality & Mixed Reality Market Revenue (billion), by End-user Vertical 2025 & 2033
- Figure 72: North America Augmented Reality & Mixed Reality Market Volume (K Unit), by End-user Vertical 2025 & 2033
- Figure 73: North America Augmented Reality & Mixed Reality Market Revenue Share (%), by End-user Vertical 2025 & 2033
- Figure 74: North America Augmented Reality & Mixed Reality Market Volume Share (%), by End-user Vertical 2025 & 2033
- Figure 75: North America Augmented Reality & Mixed Reality Market Revenue (billion), by End-user Vertical 2025 & 2033
- Figure 76: North America Augmented Reality & Mixed Reality Market Volume (K Unit), by End-user Vertical 2025 & 2033
- Figure 77: North America Augmented Reality & Mixed Reality Market Revenue Share (%), by End-user Vertical 2025 & 2033
- Figure 78: North America Augmented Reality & Mixed Reality Market Volume Share (%), by End-user Vertical 2025 & 2033
- Figure 79: North America Augmented Reality & Mixed Reality Market Revenue (billion), by Country 2025 & 2033
- Figure 80: North America Augmented Reality & Mixed Reality Market Volume (K Unit), by Country 2025 & 2033
- Figure 81: North America Augmented Reality & Mixed Reality Market Revenue Share (%), by Country 2025 & 2033
- Figure 82: North America Augmented Reality & Mixed Reality Market Volume Share (%), by Country 2025 & 2033
- Figure 83: Europe Augmented Reality & Mixed Reality Market Revenue (billion), by Type 2025 & 2033
- Figure 84: Europe Augmented Reality & Mixed Reality Market Volume (K Unit), by Type 2025 & 2033
- Figure 85: Europe Augmented Reality & Mixed Reality Market Revenue Share (%), by Type 2025 & 2033
- Figure 86: Europe Augmented Reality & Mixed Reality Market Volume Share (%), by Type 2025 & 2033
- Figure 87: Europe Augmented Reality & Mixed Reality Market Revenue (billion), by End-user Vertical 2025 & 2033
- Figure 88: Europe Augmented Reality & Mixed Reality Market Volume (K Unit), by End-user Vertical 2025 & 2033
- Figure 89: Europe Augmented Reality & Mixed Reality Market Revenue Share (%), by End-user Vertical 2025 & 2033
- Figure 90: Europe Augmented Reality & Mixed Reality Market Volume Share (%), by End-user Vertical 2025 & 2033
- Figure 91: Europe Augmented Reality & Mixed Reality Market Revenue (billion), by End-user Vertical 2025 & 2033
- Figure 92: Europe Augmented Reality & Mixed Reality Market Volume (K Unit), by End-user Vertical 2025 & 2033
- Figure 93: Europe Augmented Reality & Mixed Reality Market Revenue Share (%), by End-user Vertical 2025 & 2033
- Figure 94: Europe Augmented Reality & Mixed Reality Market Volume Share (%), by End-user Vertical 2025 & 2033
- Figure 95: Europe Augmented Reality & Mixed Reality Market Revenue (billion), by Country 2025 & 2033
- Figure 96: Europe Augmented Reality & Mixed Reality Market Volume (K Unit), by Country 2025 & 2033
- Figure 97: Europe Augmented Reality & Mixed Reality Market Revenue Share (%), by Country 2025 & 2033
- Figure 98: Europe Augmented Reality & Mixed Reality Market Volume Share (%), by Country 2025 & 2033
- Figure 99: Asia Pacific Augmented Reality & Mixed Reality Market Revenue (billion), by Type 2025 & 2033
- Figure 100: Asia Pacific Augmented Reality & Mixed Reality Market Volume (K Unit), by Type 2025 & 2033
- Figure 101: Asia Pacific Augmented Reality & Mixed Reality Market Revenue Share (%), by Type 2025 & 2033
- Figure 102: Asia Pacific Augmented Reality & Mixed Reality Market Volume Share (%), by Type 2025 & 2033
- Figure 103: Asia Pacific Augmented Reality & Mixed Reality Market Revenue (billion), by End-user Vertical 2025 & 2033
- Figure 104: Asia Pacific Augmented Reality & Mixed Reality Market Volume (K Unit), by End-user Vertical 2025 & 2033
- Figure 105: Asia Pacific Augmented Reality & Mixed Reality Market Revenue Share (%), by End-user Vertical 2025 & 2033
- Figure 106: Asia Pacific Augmented Reality & Mixed Reality Market Volume Share (%), by End-user Vertical 2025 & 2033
- Figure 107: Asia Pacific Augmented Reality & Mixed Reality Market Revenue (billion), by End-user Vertical 2025 & 2033
- Figure 108: Asia Pacific Augmented Reality & Mixed Reality Market Volume (K Unit), by End-user Vertical 2025 & 2033
- Figure 109: Asia Pacific Augmented Reality & Mixed Reality Market Revenue Share (%), by End-user Vertical 2025 & 2033
- Figure 110: Asia Pacific Augmented Reality & Mixed Reality Market Volume Share (%), by End-user Vertical 2025 & 2033
- Figure 111: Asia Pacific Augmented Reality & Mixed Reality Market Revenue (billion), by Country 2025 & 2033
- Figure 112: Asia Pacific Augmented Reality & Mixed Reality Market Volume (K Unit), by Country 2025 & 2033
- Figure 113: Asia Pacific Augmented Reality & Mixed Reality Market Revenue Share (%), by Country 2025 & 2033
- Figure 114: Asia Pacific Augmented Reality & Mixed Reality Market Volume Share (%), by Country 2025 & 2033
- Figure 115: Rest of the World Augmented Reality & Mixed Reality Market Revenue (billion), by Type 2025 & 2033
- Figure 116: Rest of the World Augmented Reality & Mixed Reality Market Volume (K Unit), by Type 2025 & 2033
- Figure 117: Rest of the World Augmented Reality & Mixed Reality Market Revenue Share (%), by Type 2025 & 2033
- Figure 118: Rest of the World Augmented Reality & Mixed Reality Market Volume Share (%), by Type 2025 & 2033
- Figure 119: Rest of the World Augmented Reality & Mixed Reality Market Revenue (billion), by End-user Vertical 2025 & 2033
- Figure 120: Rest of the World Augmented Reality & Mixed Reality Market Volume (K Unit), by End-user Vertical 2025 & 2033
- Figure 121: Rest of the World Augmented Reality & Mixed Reality Market Revenue Share (%), by End-user Vertical 2025 & 2033
- Figure 122: Rest of the World Augmented Reality & Mixed Reality Market Volume Share (%), by End-user Vertical 2025 & 2033
- Figure 123: Rest of the World Augmented Reality & Mixed Reality Market Revenue (billion), by End-user Vertical 2025 & 2033
- Figure 124: Rest of the World Augmented Reality & Mixed Reality Market Volume (K Unit), by End-user Vertical 2025 & 2033
- Figure 125: Rest of the World Augmented Reality & Mixed Reality Market Revenue Share (%), by End-user Vertical 2025 & 2033
- Figure 126: Rest of the World Augmented Reality & Mixed Reality Market Volume Share (%), by End-user Vertical 2025 & 2033
- Figure 127: Rest of the World Augmented Reality & Mixed Reality Market Revenue (billion), by Country 2025 & 2033
- Figure 128: Rest of the World Augmented Reality & Mixed Reality Market Volume (K Unit), by Country 2025 & 2033
- Figure 129: Rest of the World Augmented Reality & Mixed Reality Market Revenue Share (%), by Country 2025 & 2033
- Figure 130: Rest of the World Augmented Reality & Mixed Reality Market Volume Share (%), by Country 2025 & 2033
List of Tables
- Table 1: Global Augmented Reality & Mixed Reality Market Revenue billion Forecast, by Type 2020 & 2033
- Table 2: Global Augmented Reality & Mixed Reality Market Volume K Unit Forecast, by Type 2020 & 2033
- Table 3: Global Augmented Reality & Mixed Reality Market Revenue billion Forecast, by End-user Vertical 2020 & 2033
- Table 4: Global Augmented Reality & Mixed Reality Market Volume K Unit Forecast, by End-user Vertical 2020 & 2033
- Table 5: Global Augmented Reality & Mixed Reality Market Revenue billion Forecast, by End-user Vertical 2020 & 2033
- Table 6: Global Augmented Reality & Mixed Reality Market Volume K Unit Forecast, by End-user Vertical 2020 & 2033
- Table 7: Global Augmented Reality & Mixed Reality Market Revenue billion Forecast, by Region 2020 & 2033
- Table 8: Global Augmented Reality & Mixed Reality Market Volume K Unit Forecast, by Region 2020 & 2033
- Table 9: Global Augmented Reality & Mixed Reality Market Revenue billion Forecast, by Type 2020 & 2033
- Table 10: Global Augmented Reality & Mixed Reality Market Volume K Unit Forecast, by Type 2020 & 2033
- Table 11: Global Augmented Reality & Mixed Reality Market Revenue billion Forecast, by End-user Vertical 2020 & 2033
- Table 12: Global Augmented Reality & Mixed Reality Market Volume K Unit Forecast, by End-user Vertical 2020 & 2033
- Table 13: Global Augmented Reality & Mixed Reality Market Revenue billion Forecast, by End-user Vertical 2020 & 2033
- Table 14: Global Augmented Reality & Mixed Reality Market Volume K Unit Forecast, by End-user Vertical 2020 & 2033
- Table 15: Global Augmented Reality & Mixed Reality Market Revenue billion Forecast, by Country 2020 & 2033
- Table 16: Global Augmented Reality & Mixed Reality Market Volume K Unit Forecast, by Country 2020 & 2033
- Table 17: Global Augmented Reality & Mixed Reality Market Revenue billion Forecast, by Type 2020 & 2033
- Table 18: Global Augmented Reality & Mixed Reality Market Volume K Unit Forecast, by Type 2020 & 2033
- Table 19: Global Augmented Reality & Mixed Reality Market Revenue billion Forecast, by End-user Vertical 2020 & 2033
- Table 20: Global Augmented Reality & Mixed Reality Market Volume K Unit Forecast, by End-user Vertical 2020 & 2033
- Table 21: Global Augmented Reality & Mixed Reality Market Revenue billion Forecast, by End-user Vertical 2020 & 2033
- Table 22: Global Augmented Reality & Mixed Reality Market Volume K Unit Forecast, by End-user Vertical 2020 & 2033
- Table 23: Global Augmented Reality & Mixed Reality Market Revenue billion Forecast, by Country 2020 & 2033
- Table 24: Global Augmented Reality & Mixed Reality Market Volume K Unit Forecast, by Country 2020 & 2033
- Table 25: Global Augmented Reality & Mixed Reality Market Revenue billion Forecast, by Type 2020 & 2033
- Table 26: Global Augmented Reality & Mixed Reality Market Volume K Unit Forecast, by Type 2020 & 2033
- Table 27: Global Augmented Reality & Mixed Reality Market Revenue billion Forecast, by End-user Vertical 2020 & 2033
- Table 28: Global Augmented Reality & Mixed Reality Market Volume K Unit Forecast, by End-user Vertical 2020 & 2033
- Table 29: Global Augmented Reality & Mixed Reality Market Revenue billion Forecast, by End-user Vertical 2020 & 2033
- Table 30: Global Augmented Reality & Mixed Reality Market Volume K Unit Forecast, by End-user Vertical 2020 & 2033
- Table 31: Global Augmented Reality & Mixed Reality Market Revenue billion Forecast, by Country 2020 & 2033
- Table 32: Global Augmented Reality & Mixed Reality Market Volume K Unit Forecast, by Country 2020 & 2033
- Table 33: Global Augmented Reality & Mixed Reality Market Revenue billion Forecast, by Type 2020 & 2033
- Table 34: Global Augmented Reality & Mixed Reality Market Volume K Unit Forecast, by Type 2020 & 2033
- Table 35: Global Augmented Reality & Mixed Reality Market Revenue billion Forecast, by End-user Vertical 2020 & 2033
- Table 36: Global Augmented Reality & Mixed Reality Market Volume K Unit Forecast, by End-user Vertical 2020 & 2033
- Table 37: Global Augmented Reality & Mixed Reality Market Revenue billion Forecast, by End-user Vertical 2020 & 2033
- Table 38: Global Augmented Reality & Mixed Reality Market Volume K Unit Forecast, by End-user Vertical 2020 & 2033
- Table 39: Global Augmented Reality & Mixed Reality Market Revenue billion Forecast, by Country 2020 & 2033
- Table 40: Global Augmented Reality & Mixed Reality Market Volume K Unit Forecast, by Country 2020 & 2033
- Table 41: Global Augmented Reality & Mixed Reality Market Revenue billion Forecast, by Type 2020 & 2033
- Table 42: Global Augmented Reality & Mixed Reality Market Volume K Unit Forecast, by Type 2020 & 2033
- Table 43: Global Augmented Reality & Mixed Reality Market Revenue billion Forecast, by End-user Vertical 2020 & 2033
- Table 44: Global Augmented Reality & Mixed Reality Market Volume K Unit Forecast, by End-user Vertical 2020 & 2033
- Table 45: Global Augmented Reality & Mixed Reality Market Revenue billion Forecast, by End-user Vertical 2020 & 2033
- Table 46: Global Augmented Reality & Mixed Reality Market Volume K Unit Forecast, by End-user Vertical 2020 & 2033
- Table 47: Global Augmented Reality & Mixed Reality Market Revenue billion Forecast, by Country 2020 & 2033
- Table 48: Global Augmented Reality & Mixed Reality Market Volume K Unit Forecast, by Country 2020 & 2033
- Table 49: Global Augmented Reality & Mixed Reality Market Revenue billion Forecast, by Type 2020 & 2033
- Table 50: Global Augmented Reality & Mixed Reality Market Volume K Unit Forecast, by Type 2020 & 2033
- Table 51: Global Augmented Reality & Mixed Reality Market Revenue billion Forecast, by End-user Vertical 2020 & 2033
- Table 52: Global Augmented Reality & Mixed Reality Market Volume K Unit Forecast, by End-user Vertical 2020 & 2033
- Table 53: Global Augmented Reality & Mixed Reality Market Revenue billion Forecast, by End-user Vertical 2020 & 2033
- Table 54: Global Augmented Reality & Mixed Reality Market Volume K Unit Forecast, by End-user Vertical 2020 & 2033
- Table 55: Global Augmented Reality & Mixed Reality Market Revenue billion Forecast, by Country 2020 & 2033
- Table 56: Global Augmented Reality & Mixed Reality Market Volume K Unit Forecast, by Country 2020 & 2033
- Table 57: Global Augmented Reality & Mixed Reality Market Revenue billion Forecast, by Type 2020 & 2033
- Table 58: Global Augmented Reality & Mixed Reality Market Volume K Unit Forecast, by Type 2020 & 2033
- Table 59: Global Augmented Reality & Mixed Reality Market Revenue billion Forecast, by End-user Vertical 2020 & 2033
- Table 60: Global Augmented Reality & Mixed Reality Market Volume K Unit Forecast, by End-user Vertical 2020 & 2033
- Table 61: Global Augmented Reality & Mixed Reality Market Revenue billion Forecast, by End-user Vertical 2020 & 2033
- Table 62: Global Augmented Reality & Mixed Reality Market Volume K Unit Forecast, by End-user Vertical 2020 & 2033
- Table 63: Global Augmented Reality & Mixed Reality Market Revenue billion Forecast, by Country 2020 & 2033
- Table 64: Global Augmented Reality & Mixed Reality Market Volume K Unit Forecast, by Country 2020 & 2033
- Table 65: Global Augmented Reality & Mixed Reality Market Revenue billion Forecast, by Type 2020 & 2033
- Table 66: Global Augmented Reality & Mixed Reality Market Volume K Unit Forecast, by Type 2020 & 2033
- Table 67: Global Augmented Reality & Mixed Reality Market Revenue billion Forecast, by End-user Vertical 2020 & 2033
- Table 68: Global Augmented Reality & Mixed Reality Market Volume K Unit Forecast, by End-user Vertical 2020 & 2033
- Table 69: Global Augmented Reality & Mixed Reality Market Revenue billion Forecast, by End-user Vertical 2020 & 2033
- Table 70: Global Augmented Reality & Mixed Reality Market Volume K Unit Forecast, by End-user Vertical 2020 & 2033
- Table 71: Global Augmented Reality & Mixed Reality Market Revenue billion Forecast, by Country 2020 & 2033
- Table 72: Global Augmented Reality & Mixed Reality Market Volume K Unit Forecast, by Country 2020 & 2033
Frequently Asked Questions
1. What is the projected Compound Annual Growth Rate (CAGR) of the Augmented Reality & Mixed Reality Market?
The projected CAGR is approximately 29.7%.
2. Which companies are prominent players in the Augmented Reality & Mixed Reality Market?
Key companies in the market include Dynabook Americas Inc (Sharp corporation), Samsung Electronics Company Limited, TechSee Augmented Vision Ltd, Acer Inc, HP Development Company LP, Magic Leap Inc, Amber Garage (Holokit), Wikitude GMBH, Google LLC (Alphabet Inc ), Microsoft Corporation, Vuzix Corporation, Ultraleap Limited, AsusTek Computer Inc, Seiko Epson Corporation, PTC Inc, Niantic Inc, Dell Technologies Inc, Occipital Inc, Realwear Inc, Atheer Inc, Optinvent, Blippar com Ltd.
3. What are the main segments of the Augmented Reality & Mixed Reality Market?
The market segments include Type, End-user Vertical, End-user Vertical.
4. Can you provide details about the market size?
The market size is estimated to be USD 120.21 billion as of 2022.
5. What are some drivers contributing to market growth?
Increasing Applications of Augmented Reality; High Demand for Mobile-based Augmented Reality.
6. What are the notable trends driving market growth?
Increasing Applications of Augmented Reality Drives the Market Growth.
7. Are there any restraints impacting market growth?
Security Issues Associated with Mobile Payments.
8. Can you provide examples of recent developments in the market?
October 2022: Micledi Microdisplays, a leading developer of microLED displays for augmented reality (AR) glasses, and Kura Technologies, one of the top global innovators in AR headsets, announced a collaboration to manufacture AR glasses. The new glasses are designed by Kura and incorporate MICLEDI's unique 300mm microLED displays to achieve the performance required for Kura's next generation of AR glasses.
9. What pricing options are available for accessing the report?
Pricing options include single-user, multi-user, and enterprise licenses priced at USD 4750, USD 5250, and USD 8750 respectively.
10. Is the market size provided in terms of value or volume?
The market size is provided in terms of value, measured in billion and volume, measured in K Unit.
11. Are there any specific market keywords associated with the report?
Yes, the market keyword associated with the report is "Augmented Reality & Mixed Reality Market," which aids in identifying and referencing the specific market segment covered.
12. How do I determine which pricing option suits my needs best?
The pricing options vary based on user requirements and access needs. Individual users may opt for single-user licenses, while businesses requiring broader access may choose multi-user or enterprise licenses for cost-effective access to the report.
13. Are there any additional resources or data provided in the Augmented Reality & Mixed Reality Market report?
While the report offers comprehensive insights, it's advisable to review the specific contents or supplementary materials provided to ascertain if additional resources or data are available.
14. How can I stay updated on further developments or reports in the Augmented Reality & Mixed Reality Market?
To stay informed about further developments, trends, and reports in the Augmented Reality & Mixed Reality Market, consider subscribing to industry newsletters, following relevant companies and organizations, or regularly checking reputable industry news sources and publications.
Methodology
Step 1 - Identification of Relevant Samples Size from Population Database


Step 2 - Approaches for Defining Global Market Size (Value, Volume* & Price*)

Note*: In applicable scenarios
Step 3 - Data Sources
Primary Research
- Web Analytics
- Survey Reports
- Research Institute
- Latest Research Reports
- Opinion Leaders
Secondary Research
- Annual Reports
- White Paper
- Latest Press Release
- Industry Association
- Paid Database
- Investor Presentations

Step 4 - Data Triangulation
Involves using different sources of information in order to increase the validity of a study
These sources are likely to be stakeholders in a program - participants, other researchers, program staff, other community members, and so on.
Then we put all data in single framework & apply various statistical tools to find out the dynamic on the market.
During the analysis stage, feedback from the stakeholder groups would be compared to determine areas of agreement as well as areas of divergence