

Key Insights
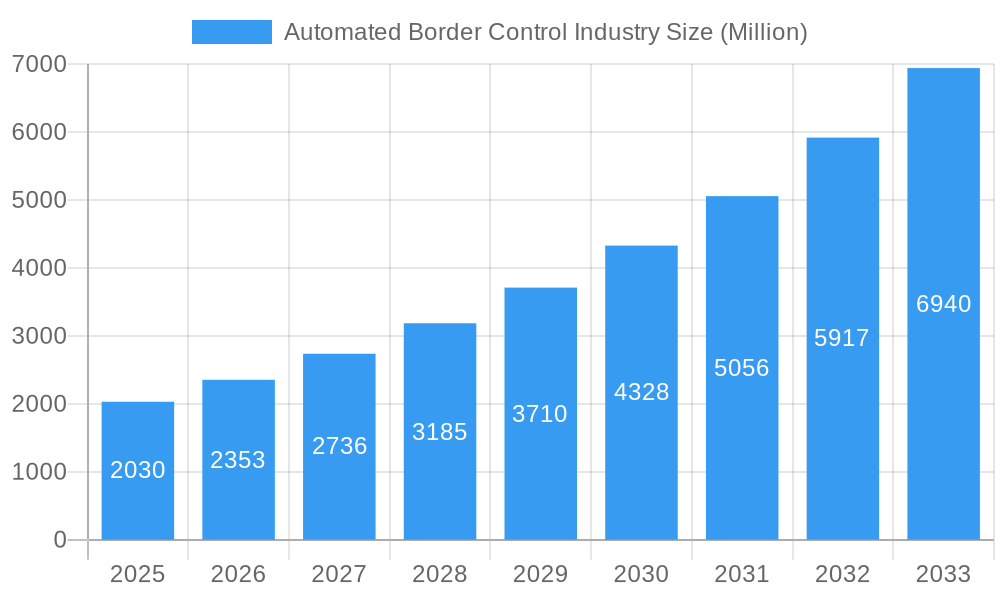
The Automated Border Control (ABC) system market is experiencing robust growth, projected to reach \$2.03 billion in 2025 and maintain a Compound Annual Growth Rate (CAGR) of 16.20% from 2025 to 2033. This expansion is driven by several key factors. Increased passenger traffic at global airports, seaports, and land borders necessitates efficient and secure processing solutions. Furthermore, rising concerns about national security and the need to combat terrorism and illegal immigration are fueling demand for advanced biometric technologies, such as facial recognition, fingerprint scanning, and iris recognition, integrated within ABC systems. Governments worldwide are investing heavily in upgrading their border control infrastructure to enhance efficiency, streamline passenger flow, and improve overall security. The adoption of cloud-based solutions and the integration of artificial intelligence (AI) and machine learning (ML) algorithms further accelerate market growth by improving accuracy and reducing processing times. The diverse range of offerings, including hardware (e-gates, kiosks), software, and services, caters to varied customer needs and budgets, fostering wider adoption.
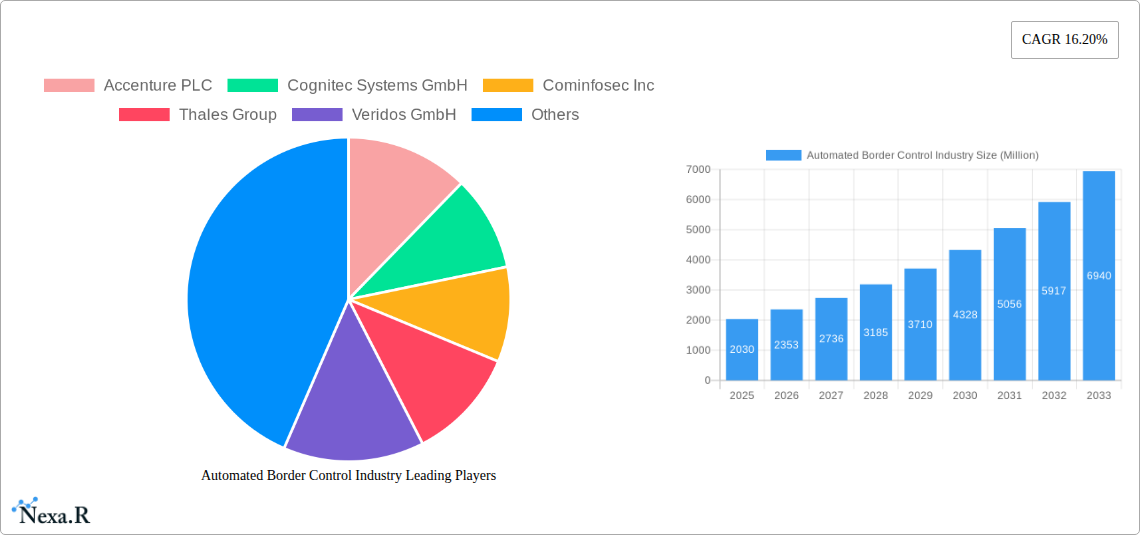
Automated Border Control Industry Market Size (In Billion)
Segmentation analysis reveals a strong preference for biometric verification systems, especially facial recognition, due to its speed and ease of use. While airports currently dominate the application segment, the increasing adoption of ABC systems in land and seaports indicates a significant growth opportunity in these areas. Geographically, North America and Europe are currently leading the market, but the Asia-Pacific region is poised for rapid expansion due to substantial investments in infrastructure development and increasing passenger traffic in countries like China and India. The presence of major technology players like Accenture, Thales Group, and HID Global indicates the robust nature of the industry and the ongoing innovation driving technological advancement. Competition is likely to intensify as companies invest in research and development to enhance the capabilities of their ABC systems. Competitive advantages will hinge upon factors such as accuracy, speed, integration capabilities, and cost-effectiveness.
Automated Border Control Industry Company Market Share
Automated Border Control Industry Market Report: 2019-2033
This comprehensive report provides an in-depth analysis of the Automated Border Control (ABC) industry, encompassing market dynamics, growth trends, regional dominance, product landscape, and key players. The report covers the period from 2019 to 2033, with a focus on the forecast period 2025-2033 and a base year of 2025. This analysis will be invaluable for industry professionals, investors, and policymakers seeking to understand and capitalize on the opportunities within this rapidly evolving sector. The parent market is Security and Surveillance Technology and the child market is Automated Border Control systems. The global market size is estimated at xx Million in 2025.
Automated Border Control Industry Market Dynamics & Structure
The Automated Border Control (ABC) industry is characterized by a moderately concentrated market structure, with several key players competing for market share. Technological innovation is a primary driver, with advancements in biometric verification systems (BVS), including face, fingerprint, iris, palm, and vein recognition, significantly impacting market growth. Stringent regulatory frameworks and evolving data privacy regulations influence market dynamics. Product substitutes, such as traditional manual border checks, still exist, but their usage is declining. End-user demographics, primarily comprising international travelers and border control agencies, shape market demand. Mergers and acquisitions (M&A) activity has been moderate, with strategic consolidations aimed at expanding capabilities and market reach.
- Market Concentration: Moderately concentrated, with top 5 players holding approximately xx% market share in 2025.
- Technological Innovation: Focus on AI, machine learning, and improved biometric accuracy.
- Regulatory Frameworks: Compliance with data privacy and security regulations (e.g., GDPR, CCPA).
- Competitive Product Substitutes: Manual border checks, gradually being replaced by ABC systems.
- End-User Demographics: Growth driven by increasing international travel and heightened security concerns.
- M&A Trends: Strategic acquisitions to enhance technology portfolios and geographic reach; approximately xx M&A deals in the last 5 years.
Automated Border Control Industry Growth Trends & Insights
The ABC industry has experienced significant growth in recent years, driven by increasing passenger traffic, stricter security measures, and technological advancements. The market size is projected to expand at a Compound Annual Growth Rate (CAGR) of xx% during the forecast period (2025-2033), reaching an estimated xx Million by 2033. Adoption rates are increasing, particularly in major airports and increasingly in land and seaports. Technological disruptions, such as the introduction of advanced biometric technologies and AI-powered analytics, are reshaping the landscape. Consumer behavior shifts towards seamless travel experiences are contributing to market growth. Market penetration is highest in developed regions, but developing countries are witnessing rapid expansion, particularly in regions with increasing travel and economic development.
Dominant Regions, Countries, or Segments in Automated Border Control Industry
North America and Europe currently dominate the ABC market, driven by high passenger traffic, advanced infrastructure, and strong government support. However, the Asia-Pacific region is poised for significant growth, fueled by increasing investment in airport infrastructure and rising international travel.
By Type:
- ABC E-gates: Highest market share, driven by ease of use and high throughput.
- ABC Kiosks: Growing market share, offering self-service options for document verification.
By Offering:
- Hardware: Largest segment, including e-gates, kiosks, and biometric scanners.
- Biometric Verification Systems (BVS): Face recognition holds the largest share, followed by fingerprint recognition.
- Software: Growing segment, encompassing border control management systems and data analytics platforms.
- Services: Includes integration, maintenance, and support services.
By Application:
- Airports: Largest segment, driven by high passenger volume and security requirements.
- Land ports: Growing segment, particularly in regions with high cross-border traffic.
- Seaports: Smallest segment, but with potential for future growth.
Key Drivers:
- Increased passenger traffic at airports and land borders globally.
- Government initiatives focused on enhancing border security.
- Technological advancements in biometric technology and AI-powered analytics.
Automated Border Control Industry Product Landscape
The ABC product landscape is dynamic, characterized by continuous innovation in biometric technologies and software solutions. Products range from automated e-gates and kiosks to advanced biometric verification systems incorporating face, fingerprint, iris, and other recognition technologies. Unique selling propositions often involve speed, accuracy, and ease of integration into existing infrastructure. Technological advancements focus on improving biometric accuracy, enhancing security features, and simplifying user experience.
Key Drivers, Barriers & Challenges in Automated Border Control Industry
Key Drivers:
- Growing passenger volume and demand for streamlined border crossings.
- Enhanced security concerns and the need for efficient threat detection.
- Technological advancements in biometric identification and data analytics.
Key Barriers and Challenges:
- High initial investment costs for implementing ABC systems.
- Data privacy concerns and regulations related to the collection and use of biometric data.
- Integration challenges with existing border control infrastructure.
- Cybersecurity risks associated with vulnerable systems and data breaches (estimated impact on market growth: xx%).
Emerging Opportunities in Automated Border Control Industry
- Expansion into emerging markets with developing infrastructure.
- Integration of ABC systems with other travel technologies (e.g., mobile boarding passes).
- Development of advanced analytics capabilities to enhance security and efficiency.
- Increased focus on user experience and accessibility for all travelers.
Growth Accelerators in the Automated Border Control Industry
Technological breakthroughs in artificial intelligence and biometric recognition are key growth accelerators. Strategic partnerships between technology providers and border control agencies are crucial for successful implementation and market expansion. Government initiatives aimed at modernizing border control infrastructure also significantly influence market growth.
Key Players Shaping the Automated Border Control Industry Market
- Accenture PLC
- Cognitec Systems GmbH
- Cominfosec Inc
- Thales Group
- Veridos GmbH
- HID Global Corporation
- Atos SE
- Rockwell Collins Aerospace and Electronics Inc
- NEC Technologies India Pvt Ltd
- Gunnebo Group Corporation
- Magnetic Autocontrol GmbH
Notable Milestones in Automated Border Control Industry Sector
- July 2022: UK Home Secretary announces plans for contactless border checkpoints, including a 2024 pilot program.
- June 2022: Bangladesh launches e-gates at Hazrat Shahjalal International Airport, becoming the first South Asian nation to adopt this technology.
- April 2022: Smiths Detection releases iCMORE Money, an automated currency identification software.
In-Depth Automated Border Control Industry Market Outlook
The future of the ABC industry is bright, with significant growth potential driven by technological advancements, increasing passenger traffic, and ongoing government investments in border security. Strategic opportunities exist for companies to develop innovative products and solutions, expand into new markets, and forge strategic partnerships to capitalize on this growth. The market is expected to witness sustained growth, with the increasing adoption of advanced biometric technologies and seamless integration with other travel processes.
Automated Border Control Industry Segmentation
-
1. Type
- 1.1. ABC E-gates
- 1.2. ABC Kiosks
-
2. Offerings
- 2.1. Hardware
- 2.2. Software
- 2.3. Services
-
3. Application
- 3.1. Airports
- 3.2. Land ports
- 3.3. Seaports
Automated Border Control Industry Segmentation By Geography
- 1. North America
- 2. Europe
- 3. Asia Pacific
- 4. Rest of the World
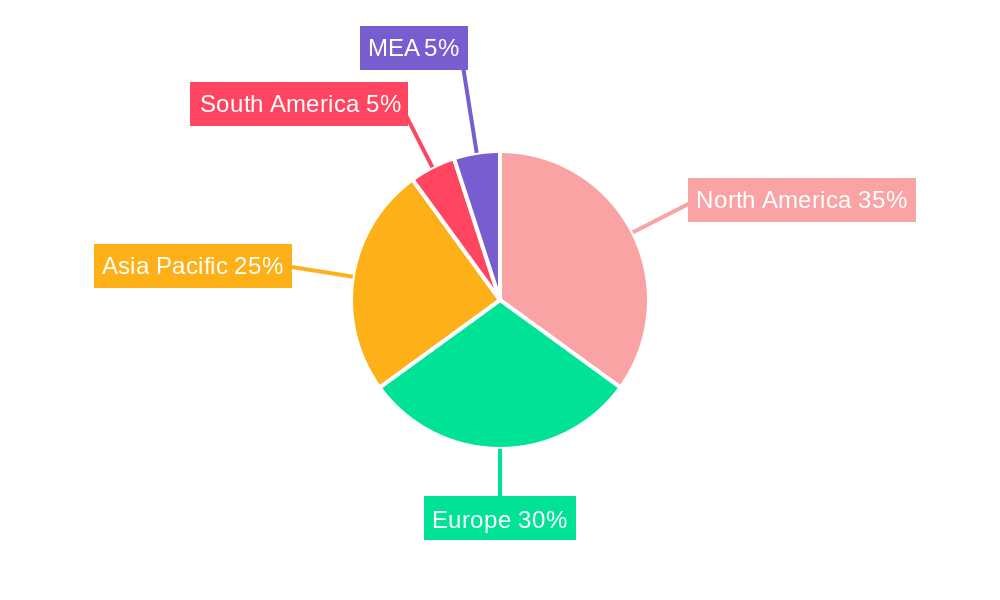
Automated Border Control Industry Regional Market Share
Geographic Coverage of Automated Border Control Industry
Automated Border Control Industry REPORT HIGHLIGHTS
| Aspects | Details |
|---|---|
| Study Period | 2020-2034 |
| Base Year | 2025 |
| Estimated Year | 2026 |
| Forecast Period | 2026-2034 |
| Historical Period | 2020-2025 |
| Growth Rate | CAGR of 16.20% from 2020-2034 |
| Segmentation |
|
Table of Contents
- 1. Introduction
- 1.1. Research Scope
- 1.2. Market Segmentation
- 1.3. Research Objective
- 1.4. Definitions and Assumptions
- 2. Executive Summary
- 2.1. Market Snapshot
- 3. Market Dynamics
- 3.1. Market Drivers
- 3.2. Market Restrains
- 3.3. Market Trends
- 3.4. Market Opportunities
- 4. Market Factor Analysis
- 4.1. Porters Five Forces
- 4.1.1. Bargaining Power of Suppliers
- 4.1.2. Bargaining Power of Buyers
- 4.1.3. Threat of New Entrants
- 4.1.4. Threat of Substitutes
- 4.1.5. Competitive Rivalry
- 4.2. PESTEL analysis
- 4.3. BCG Analysis
- 4.3.1. Stars (High Growth, High Market Share)
- 4.3.2. Cash Cows (Low Growth, High Market Share)
- 4.3.3. Question Mark (High Growth, Low Market Share)
- 4.3.4. Dogs (Low Growth, Low Market Share)
- 4.4. Ansoff Matrix Analysis
- 4.5. Supply Chain Analysis
- 4.6. Regulatory Landscape
- 4.7. Current Market Potential and Opportunity Assessment (TAM–SAM–SOM Framework)
- 4.8. NRP Analyst Note
- 4.1. Porters Five Forces
- 5. Market Analysis, Insights and Forecast 2021-2033
- 5.1. Market Analysis, Insights and Forecast - by Type
- 5.1.1. ABC E-gates
- 5.1.2. ABC Kiosks
- 5.2. Market Analysis, Insights and Forecast - by Offerings
- 5.2.1. Hardware
- 5.2.2. Software
- 5.2.3. Services
- 5.3. Market Analysis, Insights and Forecast - by Application
- 5.3.1. Airports
- 5.3.2. Land ports
- 5.3.3. Seaports
- 5.4. Market Analysis, Insights and Forecast - by Region
- 5.4.1. North America
- 5.4.2. Europe
- 5.4.3. Asia Pacific
- 5.4.4. Rest of the World
- 5.1. Market Analysis, Insights and Forecast - by Type
- 6. Global Automated Border Control Industry Analysis, Insights and Forecast, 2021-2033
- 6.1. Market Analysis, Insights and Forecast - by Type
- 6.1.1. ABC E-gates
- 6.1.2. ABC Kiosks
- 6.2. Market Analysis, Insights and Forecast - by Offerings
- 6.2.1. Hardware
- 6.2.2. Software
- 6.2.3. Services
- 6.3. Market Analysis, Insights and Forecast - by Application
- 6.3.1. Airports
- 6.3.2. Land ports
- 6.3.3. Seaports
- 6.1. Market Analysis, Insights and Forecast - by Type
- 7. North America Automated Border Control Industry Analysis, Insights and Forecast, 2020-2032
- 7.1. Market Analysis, Insights and Forecast - by Type
- 7.1.1. ABC E-gates
- 7.1.2. ABC Kiosks
- 7.2. Market Analysis, Insights and Forecast - by Offerings
- 7.2.1. Hardware
- 7.2.2. Software
- 7.2.3. Services
- 7.3. Market Analysis, Insights and Forecast - by Application
- 7.3.1. Airports
- 7.3.2. Land ports
- 7.3.3. Seaports
- 7.1. Market Analysis, Insights and Forecast - by Type
- 8. Europe Automated Border Control Industry Analysis, Insights and Forecast, 2020-2032
- 8.1. Market Analysis, Insights and Forecast - by Type
- 8.1.1. ABC E-gates
- 8.1.2. ABC Kiosks
- 8.2. Market Analysis, Insights and Forecast - by Offerings
- 8.2.1. Hardware
- 8.2.2. Software
- 8.2.3. Services
- 8.3. Market Analysis, Insights and Forecast - by Application
- 8.3.1. Airports
- 8.3.2. Land ports
- 8.3.3. Seaports
- 8.1. Market Analysis, Insights and Forecast - by Type
- 9. Asia Pacific Automated Border Control Industry Analysis, Insights and Forecast, 2020-2032
- 9.1. Market Analysis, Insights and Forecast - by Type
- 9.1.1. ABC E-gates
- 9.1.2. ABC Kiosks
- 9.2. Market Analysis, Insights and Forecast - by Offerings
- 9.2.1. Hardware
- 9.2.2. Software
- 9.2.3. Services
- 9.3. Market Analysis, Insights and Forecast - by Application
- 9.3.1. Airports
- 9.3.2. Land ports
- 9.3.3. Seaports
- 9.1. Market Analysis, Insights and Forecast - by Type
- 10. Rest of the World Automated Border Control Industry Analysis, Insights and Forecast, 2020-2032
- 10.1. Market Analysis, Insights and Forecast - by Type
- 10.1.1. ABC E-gates
- 10.1.2. ABC Kiosks
- 10.2. Market Analysis, Insights and Forecast - by Offerings
- 10.2.1. Hardware
- 10.2.2. Software
- 10.2.3. Services
- 10.3. Market Analysis, Insights and Forecast - by Application
- 10.3.1. Airports
- 10.3.2. Land ports
- 10.3.3. Seaports
- 10.1. Market Analysis, Insights and Forecast - by Type
- 11. Competitive Analysis
- 11.1. Company Profiles
- 11.1.1 Accenture PLC
- 11.1.1.1. Company Overview
- 11.1.1.2. Products
- 11.1.1.3. Company Financials
- 11.1.1.4. SWOT Analysis
- 11.1.2 Cognitec Systems GmbH
- 11.1.2.1. Company Overview
- 11.1.2.2. Products
- 11.1.2.3. Company Financials
- 11.1.2.4. SWOT Analysis
- 11.1.3 Cominfosec Inc
- 11.1.3.1. Company Overview
- 11.1.3.2. Products
- 11.1.3.3. Company Financials
- 11.1.3.4. SWOT Analysis
- 11.1.4 Thales Group
- 11.1.4.1. Company Overview
- 11.1.4.2. Products
- 11.1.4.3. Company Financials
- 11.1.4.4. SWOT Analysis
- 11.1.5 Veridos GmbH
- 11.1.5.1. Company Overview
- 11.1.5.2. Products
- 11.1.5.3. Company Financials
- 11.1.5.4. SWOT Analysis
- 11.1.6 HID Global Corporation
- 11.1.6.1. Company Overview
- 11.1.6.2. Products
- 11.1.6.3. Company Financials
- 11.1.6.4. SWOT Analysis
- 11.1.7 Atos SE
- 11.1.7.1. Company Overview
- 11.1.7.2. Products
- 11.1.7.3. Company Financials
- 11.1.7.4. SWOT Analysis
- 11.1.8 Rockwell Collins Aerospace and Electronics Inc
- 11.1.8.1. Company Overview
- 11.1.8.2. Products
- 11.1.8.3. Company Financials
- 11.1.8.4. SWOT Analysis
- 11.1.9 NEC Technologies India Pvt Ltd
- 11.1.9.1. Company Overview
- 11.1.9.2. Products
- 11.1.9.3. Company Financials
- 11.1.9.4. SWOT Analysis
- 11.1.10 Gunnebo Group Corporation
- 11.1.10.1. Company Overview
- 11.1.10.2. Products
- 11.1.10.3. Company Financials
- 11.1.10.4. SWOT Analysis
- 11.1.11 Magnetic Autocontrol GmbH
- 11.1.11.1. Company Overview
- 11.1.11.2. Products
- 11.1.11.3. Company Financials
- 11.1.11.4. SWOT Analysis
- 11.1.1 Accenture PLC
- 11.2. Market Entropy
- 11.2.1 Company's Key Areas Served
- 11.2.2 Recent Developments
- 11.3. Company Market Share Analysis 2025
- 11.3.1 Top 5 Companies Market Share Analysis
- 11.3.2 Top 3 Companies Market Share Analysis
- 11.4. List of Potential Customers
- 12. Research Methodology
List of Figures
- Figure 1: Global Automated Border Control Industry Revenue Breakdown (Million, %) by Region 2025 & 2033
- Figure 2: Global Automated Border Control Industry Volume Breakdown (K Unit, %) by Region 2025 & 2033
- Figure 3: North America Automated Border Control Industry Revenue (Million), by Type 2025 & 2033
- Figure 4: North America Automated Border Control Industry Volume (K Unit), by Type 2025 & 2033
- Figure 5: North America Automated Border Control Industry Revenue Share (%), by Type 2025 & 2033
- Figure 6: North America Automated Border Control Industry Volume Share (%), by Type 2025 & 2033
- Figure 7: North America Automated Border Control Industry Revenue (Million), by Offerings 2025 & 2033
- Figure 8: North America Automated Border Control Industry Volume (K Unit), by Offerings 2025 & 2033
- Figure 9: North America Automated Border Control Industry Revenue Share (%), by Offerings 2025 & 2033
- Figure 10: North America Automated Border Control Industry Volume Share (%), by Offerings 2025 & 2033
- Figure 11: North America Automated Border Control Industry Revenue (Million), by Application 2025 & 2033
- Figure 12: North America Automated Border Control Industry Volume (K Unit), by Application 2025 & 2033
- Figure 13: North America Automated Border Control Industry Revenue Share (%), by Application 2025 & 2033
- Figure 14: North America Automated Border Control Industry Volume Share (%), by Application 2025 & 2033
- Figure 15: North America Automated Border Control Industry Revenue (Million), by Country 2025 & 2033
- Figure 16: North America Automated Border Control Industry Volume (K Unit), by Country 2025 & 2033
- Figure 17: North America Automated Border Control Industry Revenue Share (%), by Country 2025 & 2033
- Figure 18: North America Automated Border Control Industry Volume Share (%), by Country 2025 & 2033
- Figure 19: Europe Automated Border Control Industry Revenue (Million), by Type 2025 & 2033
- Figure 20: Europe Automated Border Control Industry Volume (K Unit), by Type 2025 & 2033
- Figure 21: Europe Automated Border Control Industry Revenue Share (%), by Type 2025 & 2033
- Figure 22: Europe Automated Border Control Industry Volume Share (%), by Type 2025 & 2033
- Figure 23: Europe Automated Border Control Industry Revenue (Million), by Offerings 2025 & 2033
- Figure 24: Europe Automated Border Control Industry Volume (K Unit), by Offerings 2025 & 2033
- Figure 25: Europe Automated Border Control Industry Revenue Share (%), by Offerings 2025 & 2033
- Figure 26: Europe Automated Border Control Industry Volume Share (%), by Offerings 2025 & 2033
- Figure 27: Europe Automated Border Control Industry Revenue (Million), by Application 2025 & 2033
- Figure 28: Europe Automated Border Control Industry Volume (K Unit), by Application 2025 & 2033
- Figure 29: Europe Automated Border Control Industry Revenue Share (%), by Application 2025 & 2033
- Figure 30: Europe Automated Border Control Industry Volume Share (%), by Application 2025 & 2033
- Figure 31: Europe Automated Border Control Industry Revenue (Million), by Country 2025 & 2033
- Figure 32: Europe Automated Border Control Industry Volume (K Unit), by Country 2025 & 2033
- Figure 33: Europe Automated Border Control Industry Revenue Share (%), by Country 2025 & 2033
- Figure 34: Europe Automated Border Control Industry Volume Share (%), by Country 2025 & 2033
- Figure 35: Asia Pacific Automated Border Control Industry Revenue (Million), by Type 2025 & 2033
- Figure 36: Asia Pacific Automated Border Control Industry Volume (K Unit), by Type 2025 & 2033
- Figure 37: Asia Pacific Automated Border Control Industry Revenue Share (%), by Type 2025 & 2033
- Figure 38: Asia Pacific Automated Border Control Industry Volume Share (%), by Type 2025 & 2033
- Figure 39: Asia Pacific Automated Border Control Industry Revenue (Million), by Offerings 2025 & 2033
- Figure 40: Asia Pacific Automated Border Control Industry Volume (K Unit), by Offerings 2025 & 2033
- Figure 41: Asia Pacific Automated Border Control Industry Revenue Share (%), by Offerings 2025 & 2033
- Figure 42: Asia Pacific Automated Border Control Industry Volume Share (%), by Offerings 2025 & 2033
- Figure 43: Asia Pacific Automated Border Control Industry Revenue (Million), by Application 2025 & 2033
- Figure 44: Asia Pacific Automated Border Control Industry Volume (K Unit), by Application 2025 & 2033
- Figure 45: Asia Pacific Automated Border Control Industry Revenue Share (%), by Application 2025 & 2033
- Figure 46: Asia Pacific Automated Border Control Industry Volume Share (%), by Application 2025 & 2033
- Figure 47: Asia Pacific Automated Border Control Industry Revenue (Million), by Country 2025 & 2033
- Figure 48: Asia Pacific Automated Border Control Industry Volume (K Unit), by Country 2025 & 2033
- Figure 49: Asia Pacific Automated Border Control Industry Revenue Share (%), by Country 2025 & 2033
- Figure 50: Asia Pacific Automated Border Control Industry Volume Share (%), by Country 2025 & 2033
- Figure 51: Rest of the World Automated Border Control Industry Revenue (Million), by Type 2025 & 2033
- Figure 52: Rest of the World Automated Border Control Industry Volume (K Unit), by Type 2025 & 2033
- Figure 53: Rest of the World Automated Border Control Industry Revenue Share (%), by Type 2025 & 2033
- Figure 54: Rest of the World Automated Border Control Industry Volume Share (%), by Type 2025 & 2033
- Figure 55: Rest of the World Automated Border Control Industry Revenue (Million), by Offerings 2025 & 2033
- Figure 56: Rest of the World Automated Border Control Industry Volume (K Unit), by Offerings 2025 & 2033
- Figure 57: Rest of the World Automated Border Control Industry Revenue Share (%), by Offerings 2025 & 2033
- Figure 58: Rest of the World Automated Border Control Industry Volume Share (%), by Offerings 2025 & 2033
- Figure 59: Rest of the World Automated Border Control Industry Revenue (Million), by Application 2025 & 2033
- Figure 60: Rest of the World Automated Border Control Industry Volume (K Unit), by Application 2025 & 2033
- Figure 61: Rest of the World Automated Border Control Industry Revenue Share (%), by Application 2025 & 2033
- Figure 62: Rest of the World Automated Border Control Industry Volume Share (%), by Application 2025 & 2033
- Figure 63: Rest of the World Automated Border Control Industry Revenue (Million), by Country 2025 & 2033
- Figure 64: Rest of the World Automated Border Control Industry Volume (K Unit), by Country 2025 & 2033
- Figure 65: Rest of the World Automated Border Control Industry Revenue Share (%), by Country 2025 & 2033
- Figure 66: Rest of the World Automated Border Control Industry Volume Share (%), by Country 2025 & 2033
List of Tables
- Table 1: Global Automated Border Control Industry Revenue Million Forecast, by Type 2020 & 2033
- Table 2: Global Automated Border Control Industry Volume K Unit Forecast, by Type 2020 & 2033
- Table 3: Global Automated Border Control Industry Revenue Million Forecast, by Offerings 2020 & 2033
- Table 4: Global Automated Border Control Industry Volume K Unit Forecast, by Offerings 2020 & 2033
- Table 5: Global Automated Border Control Industry Revenue Million Forecast, by Application 2020 & 2033
- Table 6: Global Automated Border Control Industry Volume K Unit Forecast, by Application 2020 & 2033
- Table 7: Global Automated Border Control Industry Revenue Million Forecast, by Region 2020 & 2033
- Table 8: Global Automated Border Control Industry Volume K Unit Forecast, by Region 2020 & 2033
- Table 9: Global Automated Border Control Industry Revenue Million Forecast, by Type 2020 & 2033
- Table 10: Global Automated Border Control Industry Volume K Unit Forecast, by Type 2020 & 2033
- Table 11: Global Automated Border Control Industry Revenue Million Forecast, by Offerings 2020 & 2033
- Table 12: Global Automated Border Control Industry Volume K Unit Forecast, by Offerings 2020 & 2033
- Table 13: Global Automated Border Control Industry Revenue Million Forecast, by Application 2020 & 2033
- Table 14: Global Automated Border Control Industry Volume K Unit Forecast, by Application 2020 & 2033
- Table 15: Global Automated Border Control Industry Revenue Million Forecast, by Country 2020 & 2033
- Table 16: Global Automated Border Control Industry Volume K Unit Forecast, by Country 2020 & 2033
- Table 17: Global Automated Border Control Industry Revenue Million Forecast, by Type 2020 & 2033
- Table 18: Global Automated Border Control Industry Volume K Unit Forecast, by Type 2020 & 2033
- Table 19: Global Automated Border Control Industry Revenue Million Forecast, by Offerings 2020 & 2033
- Table 20: Global Automated Border Control Industry Volume K Unit Forecast, by Offerings 2020 & 2033
- Table 21: Global Automated Border Control Industry Revenue Million Forecast, by Application 2020 & 2033
- Table 22: Global Automated Border Control Industry Volume K Unit Forecast, by Application 2020 & 2033
- Table 23: Global Automated Border Control Industry Revenue Million Forecast, by Country 2020 & 2033
- Table 24: Global Automated Border Control Industry Volume K Unit Forecast, by Country 2020 & 2033
- Table 25: Global Automated Border Control Industry Revenue Million Forecast, by Type 2020 & 2033
- Table 26: Global Automated Border Control Industry Volume K Unit Forecast, by Type 2020 & 2033
- Table 27: Global Automated Border Control Industry Revenue Million Forecast, by Offerings 2020 & 2033
- Table 28: Global Automated Border Control Industry Volume K Unit Forecast, by Offerings 2020 & 2033
- Table 29: Global Automated Border Control Industry Revenue Million Forecast, by Application 2020 & 2033
- Table 30: Global Automated Border Control Industry Volume K Unit Forecast, by Application 2020 & 2033
- Table 31: Global Automated Border Control Industry Revenue Million Forecast, by Country 2020 & 2033
- Table 32: Global Automated Border Control Industry Volume K Unit Forecast, by Country 2020 & 2033
- Table 33: Global Automated Border Control Industry Revenue Million Forecast, by Type 2020 & 2033
- Table 34: Global Automated Border Control Industry Volume K Unit Forecast, by Type 2020 & 2033
- Table 35: Global Automated Border Control Industry Revenue Million Forecast, by Offerings 2020 & 2033
- Table 36: Global Automated Border Control Industry Volume K Unit Forecast, by Offerings 2020 & 2033
- Table 37: Global Automated Border Control Industry Revenue Million Forecast, by Application 2020 & 2033
- Table 38: Global Automated Border Control Industry Volume K Unit Forecast, by Application 2020 & 2033
- Table 39: Global Automated Border Control Industry Revenue Million Forecast, by Country 2020 & 2033
- Table 40: Global Automated Border Control Industry Volume K Unit Forecast, by Country 2020 & 2033
Frequently Asked Questions
1. What is the projected Compound Annual Growth Rate (CAGR) of the Automated Border Control Industry?
The projected CAGR is approximately 16.20%.
2. Which companies are prominent players in the Automated Border Control Industry?
Key companies in the market include Accenture PLC, Cognitec Systems GmbH, Cominfosec Inc, Thales Group, Veridos GmbH, HID Global Corporation, Atos SE, Rockwell Collins Aerospace and Electronics Inc , NEC Technologies India Pvt Ltd, Gunnebo Group Corporation, Magnetic Autocontrol GmbH.
3. What are the main segments of the Automated Border Control Industry?
The market segments include Type, Offerings, Application.
4. Can you provide details about the market size?
The market size is estimated to be USD 2.03 Million as of 2022.
5. What are some drivers contributing to market growth?
Growing Need of API Monitoring in the Digital Economy; The Increasing Use of Test Automation Leads to Lower the Operational Costs and Enhance the QA.
6. What are the notable trends driving market growth?
Airport Applications are Expected to Witness a Rapid Growth.
7. Are there any restraints impacting market growth?
High Initial Setup Cost; Large Installation Space.
8. Can you provide examples of recent developments in the market?
July 2022: The Home Secretary of the U.K. announced intentions to begin the introduction of security "contactless" border checkpoints as a portion of a broad declaration on the development of the U.K. Boundary. The Home Office is to commence testing technology that will allow certain travelers to access the U.K. and go through automatic border inspection without having to undertake an eGate or talk with a Border Force official. The Home Office intends to launch a pilot study in 2024.
9. What pricing options are available for accessing the report?
Pricing options include single-user, multi-user, and enterprise licenses priced at USD 4750, USD 5250, and USD 8750 respectively.
10. Is the market size provided in terms of value or volume?
The market size is provided in terms of value, measured in Million and volume, measured in K Unit.
11. Are there any specific market keywords associated with the report?
Yes, the market keyword associated with the report is "Automated Border Control Industry," which aids in identifying and referencing the specific market segment covered.
12. How do I determine which pricing option suits my needs best?
The pricing options vary based on user requirements and access needs. Individual users may opt for single-user licenses, while businesses requiring broader access may choose multi-user or enterprise licenses for cost-effective access to the report.
13. Are there any additional resources or data provided in the Automated Border Control Industry report?
While the report offers comprehensive insights, it's advisable to review the specific contents or supplementary materials provided to ascertain if additional resources or data are available.
14. How can I stay updated on further developments or reports in the Automated Border Control Industry?
To stay informed about further developments, trends, and reports in the Automated Border Control Industry, consider subscribing to industry newsletters, following relevant companies and organizations, or regularly checking reputable industry news sources and publications.
Methodology
Step 1 - Identification of Relevant Samples Size from Population Database


Step 2 - Approaches for Defining Global Market Size (Value, Volume* & Price*)

Note*: In applicable scenarios
Step 3 - Data Sources
Primary Research
- Web Analytics
- Survey Reports
- Research Institute
- Latest Research Reports
- Opinion Leaders
Secondary Research
- Annual Reports
- White Paper
- Latest Press Release
- Industry Association
- Paid Database
- Investor Presentations

Step 4 - Data Triangulation
Involves using different sources of information in order to increase the validity of a study
These sources are likely to be stakeholders in a program - participants, other researchers, program staff, other community members, and so on.
Then we put all data in single framework & apply various statistical tools to find out the dynamic on the market.
During the analysis stage, feedback from the stakeholder groups would be compared to determine areas of agreement as well as areas of divergence