

Key Insights
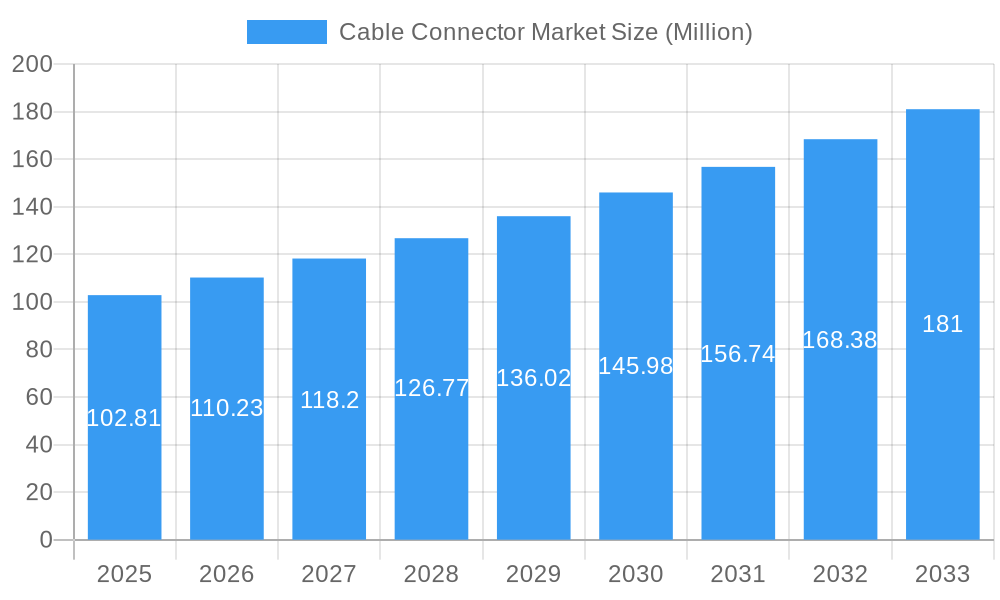
The global Cable Connector Market is poised for robust expansion, projected to reach a substantial market size of $102.81 million by 2025, with an impressive Compound Annual Growth Rate (CAGR) of 7.30% anticipated throughout the forecast period of 2025-2033. This growth is primarily propelled by the escalating demand for advanced connectivity solutions across a multitude of industries. Key drivers fueling this expansion include the relentless proliferation of the Internet of Things (IoT), the rapid evolution of 5G infrastructure, and the increasing sophistication of automotive electronics, particularly in the realm of electric and autonomous vehicles. The burgeoning consumer electronics sector, with its constant innovation and demand for compact, high-performance connectors, also plays a pivotal role. Furthermore, significant investments in industrial automation and smart manufacturing are creating a consistent need for reliable and durable cable connectors to support intricate machinery and data transfer systems.
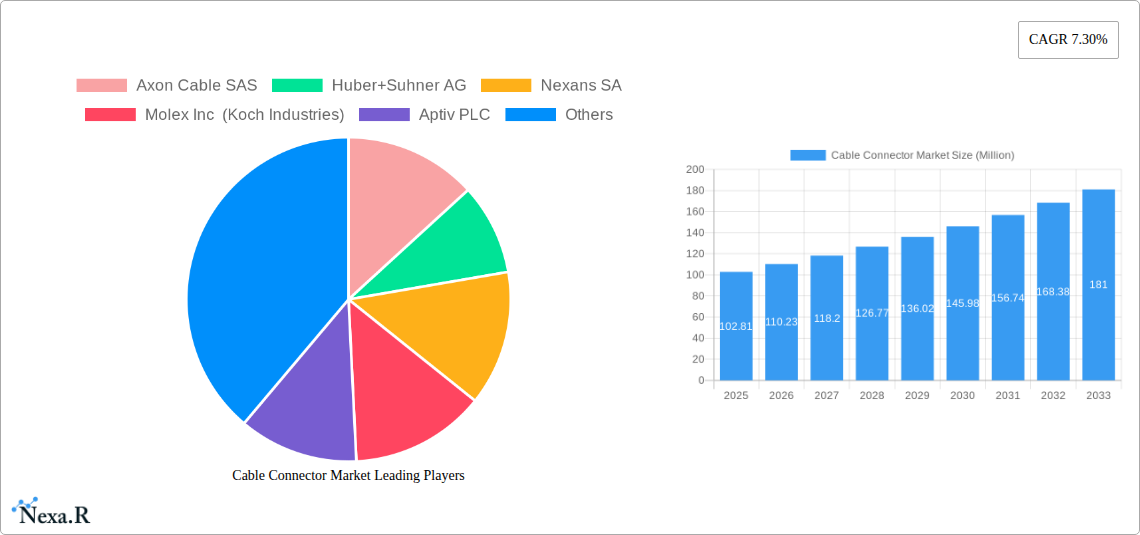
Cable Connector Market Market Size (In Million)
The market's trajectory is also shaped by emerging trends such as miniaturization, the integration of higher bandwidth capabilities, and the growing emphasis on robust and environmentally resistant connector designs. The increasing adoption of electric vehicles (EVs) is a particularly strong catalyst, demanding specialized, high-voltage, and fault-tolerant connectors. While the market exhibits strong upward momentum, certain restraining factors, such as the high cost of raw materials and stringent regulatory compliances in some regions, could present challenges. However, the continuous innovation in materials science and manufacturing processes, coupled with strategic partnerships and mergers, is expected to mitigate these restraints. The IT and Telecom, Automotive/Transportation, and Consumer sectors are anticipated to be the dominant end-user verticals, driving a significant portion of the market's value. The Asia Pacific region is expected to lead in market share due to its extensive manufacturing capabilities and rapid technological adoption.
Cable Connector Market Company Market Share
This in-depth report provides a detailed examination of the global cable connector market, a critical component underpinning the connectivity infrastructure of nearly every modern industry. Analyzing the market from 2019 to 2033, with a base year of 2025 and a forecast period of 2025-2033, this report offers unparalleled insights into market dynamics, growth trends, regional dominance, product landscapes, and the competitive strategies of key players.
The cable connector market size is experiencing robust expansion driven by the relentless demand for high-speed data transmission and miniaturization across sectors like IT and Telecom, Automotive, Consumer Electronics, and Industrial Automation. This report delves into the intricate interplay of technological advancements, evolving end-user needs, and regulatory landscapes that are shaping the global cable connector industry.
Cable Connector Market Market Dynamics & Structure
The cable connector market exhibits a moderately consolidated structure, with key players like TE Connectivity, Amphenol Corporation, and Molex Inc. (Koch Industries) holding significant market share. Technological innovation remains a primary driver, with continuous advancements in miniaturization, higher bandwidth capabilities, and enhanced environmental resistance fueling demand. Regulatory frameworks, particularly those concerning safety standards and material compliance, play a crucial role in market entry and product development. The competitive landscape is characterized by intense innovation, with companies focusing on developing solutions for emerging applications such as 5G infrastructure, electric vehicles (EVs), and advanced robotics. End-user demographics are shifting towards sectors demanding greater data processing power and reliable connectivity, influencing product roadmaps. Mergers and acquisitions (M&A) are also observed as companies seek to expand their product portfolios and geographical reach, contributing to market consolidation.
- Market Concentration: Moderately consolidated, with leading players dominating a significant portion of the market.
- Technological Innovation Drivers: Miniaturization, increased data transfer speeds, enhanced durability for harsh environments, and integration of smart functionalities.
- Regulatory Frameworks: Compliance with international safety standards (e.g., UL, RoHS, REACH) and specific industry regulations (e.g., automotive, medical).
- Competitive Product Substitutes: While direct substitutes are few, advancements in wireless technologies pose an indirect competitive pressure in certain applications.
- End-User Demographics: Growing demand from high-growth sectors including IT and Telecom, Automotive/Transportation, and Industrial Automation.
- M&A Trends: Strategic acquisitions by larger players to gain access to new technologies, markets, or customer bases. For instance, the cable connector market has seen consistent M&A activities aimed at strengthening portfolios.
Cable Connector Market Growth Trends & Insights
The cable connector market is projected to witness substantial growth, driven by an escalating global demand for data connectivity and advanced electronic devices. The global cable connector market size is anticipated to expand at a healthy Compound Annual Growth Rate (CAGR) throughout the forecast period. This expansion is fueled by the increasing adoption of high-speed internet infrastructure, the proliferation of IoT devices, and the rapid evolution of the automotive sector, particularly in the realm of electric and autonomous vehicles. The cable connector market forecast indicates a sustained upward trajectory as industries continue to invest in upgrading their connectivity solutions. Consumer behavior shifts towards devices with more integrated functionalities and higher performance expectations are also contributing significantly to market penetration of advanced connector types. The IT and Telecom sector remains a dominant end-user vertical, with the ongoing deployment of 5G networks and data centers requiring sophisticated and high-performance cabling solutions.
The automotive industry is another significant growth driver, with the increasing complexity of in-vehicle electronics, the transition to electric powertrains, and the development of advanced driver-assistance systems (ADAS) demanding robust, high-reliability connectors. The consumer electronics segment also contributes to market growth, driven by the demand for smaller, more powerful, and feature-rich devices like smartphones, wearables, and advanced gaming consoles. Furthermore, the industrial sector, encompassing automation, robotics, and smart manufacturing, presents substantial opportunities due to the need for durable, high-performance connectors capable of withstanding harsh operating conditions. The fiber optic connector market is expected to experience particularly strong growth due to its critical role in high-speed data transmission for telecommunications and data centers.
The base year (2025) is expected to see robust market activity, setting the stage for continued growth in the estimated year and beyond. Key trends influencing this growth include the development of PCB connectors with higher pin densities and improved signal integrity, alongside advancements in circular and rectangular connectors for industrial and military applications. The demand for efficient and reliable IO connectors for data input/output is also on the rise. The report's analysis will leverage these trends to provide a comprehensive understanding of the cable connector market's evolution, including estimated market share of various segments and their projected CAGRs.
Dominant Regions, Countries, or Segments in Cable Connector Market
The IT and Telecom sector is poised to be the dominant end-user vertical driving growth within the global cable connector market. This dominance is attributed to the continuous and substantial investments in digital infrastructure worldwide. The ongoing global rollout of 5G networks necessitates a massive deployment of high-performance fiber optic connectors and advanced data connectors for base stations, data centers, and core network infrastructure. The increasing demand for cloud computing, Big Data analytics, and the burgeoning IoT ecosystem further amplifies the need for reliable and high-speed connectivity solutions. Regions with significant investments in telecommunications infrastructure, such as North America, Europe, and Asia-Pacific, are expected to lead this segment's growth.
Within the Type segment, Fiber Optic Connectors are experiencing exceptional growth, directly correlated with the expansion of high-speed internet and data communication networks. The transition from copper to fiber optics for higher bandwidth and longer transmission distances in telecommunications and data centers is a primary catalyst. PCB Connectors also hold a substantial market share due to their ubiquitous use in electronic devices across all end-user verticals. However, the IT and Telecom vertical's sheer volume of deployment and continuous upgrades positions it as the leading force propelling the overall cable connector market.
Key drivers for this dominance include:
- Economic Policies: Government initiatives promoting digital transformation and broadband expansion.
- Infrastructure Development: Massive global investments in 5G, fiber optics, and data center expansion.
- Technological Advancements: Development of higher bandwidth, lower latency, and more robust connectivity solutions.
- Consumer Demand: Growing reliance on high-speed internet for streaming, gaming, remote work, and communication.
The Asia-Pacific region, particularly countries like China and South Korea, is expected to be a significant contributor to this growth, driven by substantial manufacturing capabilities and burgeoning domestic demand for connectivity. The Automotive/Transportation sector is the second-largest and fastest-growing end-user, propelled by the electrification of vehicles and the increasing adoption of autonomous driving technologies, which demand specialized, high-reliability connectors. The Industrial sector, with its focus on automation and smart manufacturing, also presents significant growth opportunities.
Cable Connector Market Product Landscape
The cable connector market product landscape is characterized by continuous innovation focused on enhancing performance, miniaturization, and reliability. Key product advancements include the development of ultra-high-speed connectors capable of supporting 112Gb/s and beyond, crucial for next-generation data centers and high-performance computing. Innovations in PCB connectors are leading to higher pin densities and improved signal integrity, enabling smaller and more powerful electronic devices. The fiber optic connector market is witnessing advancements in ferrule materials and termination technologies for improved performance and ease of installation. For the automotive sector, ruggedized and high-temperature connectors are being developed to withstand demanding environmental conditions and the increasing power demands of EVs. The IO connector segment is seeing a surge in USB-C and Thunderbolt technologies, offering versatile and high-speed data transfer solutions across consumer and industrial applications.
Key Drivers, Barriers & Challenges in Cable Connector Market
Key Drivers:
- Rapid Digital Transformation: The ongoing digital transformation across all industries necessitates robust and high-speed connectivity solutions.
- 5G Network Deployment: The global rollout of 5G infrastructure requires a massive increase in high-performance cable connectors.
- Growth of Data Centers: The ever-increasing demand for data storage and processing fuels the need for advanced data center cabling and connectors.
- Electrification of Vehicles: The booming EV market requires specialized, high-reliability connectors for battery systems, charging, and power management.
- Miniaturization Trends: The demand for smaller electronic devices drives innovation in compact and high-density connector solutions.
Barriers & Challenges:
- Supply Chain Disruptions: Geopolitical factors, raw material availability, and logistical complexities can impact production and lead times.
- Increasing Raw Material Costs: Fluctuations in the prices of metals and plastics can affect manufacturing costs and profit margins.
- Stringent Quality and Performance Standards: Meeting the demanding specifications of various industries requires significant investment in R&D and quality control.
- Intense Competition: A highly competitive market landscape can lead to price pressures and challenges in differentiating products.
- Technological Obsolescence: Rapid advancements in technology can lead to shorter product lifecycles, requiring continuous innovation to stay relevant.
Emerging Opportunities in Cable Connector Market
Emerging opportunities in the cable connector market lie in the continued expansion of the Internet of Things (IoT) ecosystem, demanding specialized connectors for a wide array of sensors and devices. The growing trend of edge computing presents a demand for compact and robust connectors for distributed processing units. Furthermore, the increasing focus on sustainable energy solutions, including advanced solar power systems and smart grids, will drive demand for specialized connectors designed for harsh environments and high-voltage applications. The medical device industry's reliance on miniaturized and highly reliable connectors for diagnostic and therapeutic equipment also offers a significant growth avenue.
Growth Accelerators in the Cable Connector Market Industry
Key catalysts driving long-term growth in the cable connector market include advancements in material science leading to more durable and lighter connectors, and the development of intelligent connectors with integrated sensing and communication capabilities. Strategic partnerships between connector manufacturers and semiconductor companies are crucial for co-developing integrated solutions. Market expansion strategies targeting underserved regions and niche applications, such as aerospace and defense, will further accelerate growth. The increasing adoption of automation and robotics in manufacturing processes also creates a sustained demand for reliable and high-performance industrial connectors.
Key Players Shaping the Cable Connector Market Market
- Axon Cable SAS
- Huber+Suhner AG
- Nexans SA
- Molex Inc (Koch Industries)
- Aptiv PLC
- Prysmian SpA
- 3M Company
- Fujitsu Limited
- Amphenol Corporation
- Huawei Technologies Co Ltd
- TE Connectivity Limited
- Yazaki Corporation
- Alcatel-Lucent SA
Notable Milestones in Cable Connector Market Sector
- November 2021: TE Connectivity launched new connectors designed for robots and UAVs, featuring high-temperature rated plastic assembly and contact position locks for extreme environments and high vibration resistance.
- September 2021: Amphenol ICC and eTopus Technology developed a 112Gb/s interconnect technology using PAM4, validated with Amphenol's ExaMax2 connector and a 1-meter copper cable, significantly boosting bandwidth capacity.
In-Depth Cable Connector Market Market Outlook
The cable connector market is set for sustained and significant growth, fueled by overarching technological trends and increasing connectivity demands across all sectors. The continuous evolution of 5G networks, the expansion of data centers, and the accelerating pace of electric vehicle adoption will remain primary growth accelerators. Emerging opportunities in the IoT, edge computing, and renewable energy sectors offer substantial untapped potential. Strategic investments in research and development, focusing on higher bandwidth, greater miniaturization, and enhanced environmental resilience, will be crucial for market players to capitalize on future opportunities. The market's outlook is characterized by innovation, expansion, and a critical role in enabling the connected future.
Cable Connector Market Segmentation
-
1. Type
- 1.1. PCB Connectors
- 1.2. Circular/Rectangular Connectors
- 1.3. Fiber Optic Connectors
- 1.4. IO Connectors
- 1.5. Other Types
-
2. End-user Vertical
- 2.1. IT and Telecom
- 2.2. Automotive/Transportation
- 2.3. Consumer
- 2.4. Industrial
- 2.5. Other En
Cable Connector Market Segmentation By Geography
- 1. North America
- 2. Europe
- 3. Asia Pacific
- 4. Latin America
- 5. Middle East and Africa
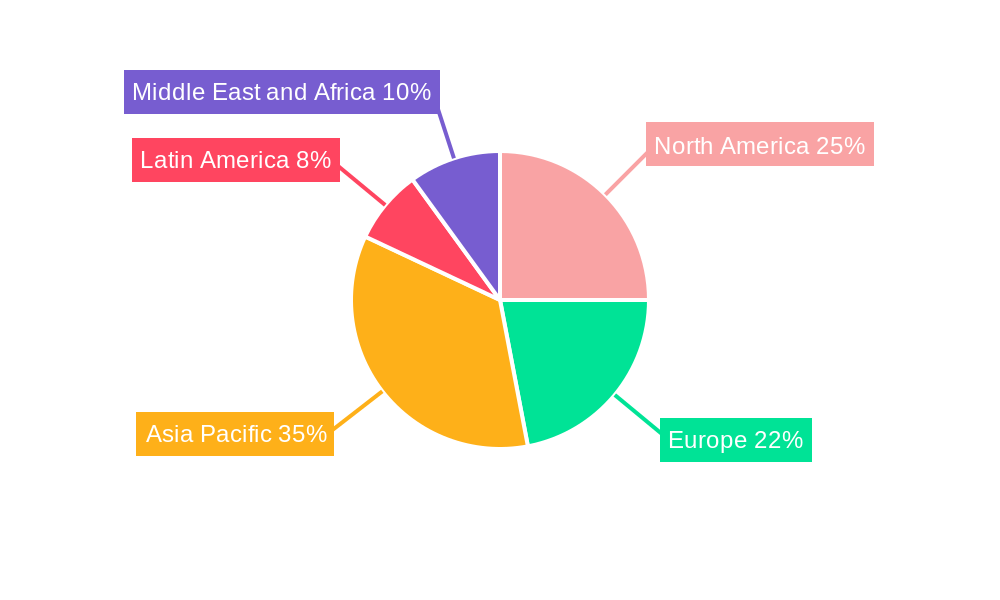
Cable Connector Market Regional Market Share
Geographic Coverage of Cable Connector Market
Cable Connector Market REPORT HIGHLIGHTS
| Aspects | Details |
|---|---|
| Study Period | 2020-2034 |
| Base Year | 2025 |
| Estimated Year | 2026 |
| Forecast Period | 2026-2034 |
| Historical Period | 2020-2025 |
| Growth Rate | CAGR of 7.30% from 2020-2034 |
| Segmentation |
|
Table of Contents
- 1. Introduction
- 1.1. Research Scope
- 1.2. Market Segmentation
- 1.3. Research Objective
- 1.4. Definitions and Assumptions
- 2. Executive Summary
- 2.1. Market Snapshot
- 3. Market Dynamics
- 3.1. Market Drivers
- 3.2. Market Restrains
- 3.3. Market Trends
- 3.4. Market Opportunities
- 4. Market Factor Analysis
- 4.1. Porters Five Forces
- 4.1.1. Bargaining Power of Suppliers
- 4.1.2. Bargaining Power of Buyers
- 4.1.3. Threat of New Entrants
- 4.1.4. Threat of Substitutes
- 4.1.5. Competitive Rivalry
- 4.2. PESTEL analysis
- 4.3. BCG Analysis
- 4.3.1. Stars (High Growth, High Market Share)
- 4.3.2. Cash Cows (Low Growth, High Market Share)
- 4.3.3. Question Mark (High Growth, Low Market Share)
- 4.3.4. Dogs (Low Growth, Low Market Share)
- 4.4. Ansoff Matrix Analysis
- 4.5. Supply Chain Analysis
- 4.6. Regulatory Landscape
- 4.7. Current Market Potential and Opportunity Assessment (TAM–SAM–SOM Framework)
- 4.8. NRP Analyst Note
- 4.1. Porters Five Forces
- 5. Market Analysis, Insights and Forecast 2021-2033
- 5.1. Market Analysis, Insights and Forecast - by Type
- 5.1.1. PCB Connectors
- 5.1.2. Circular/Rectangular Connectors
- 5.1.3. Fiber Optic Connectors
- 5.1.4. IO Connectors
- 5.1.5. Other Types
- 5.2. Market Analysis, Insights and Forecast - by End-user Vertical
- 5.2.1. IT and Telecom
- 5.2.2. Automotive/Transportation
- 5.2.3. Consumer
- 5.2.4. Industrial
- 5.2.5. Other En
- 5.3. Market Analysis, Insights and Forecast - by Region
- 5.3.1. North America
- 5.3.2. Europe
- 5.3.3. Asia Pacific
- 5.3.4. Latin America
- 5.3.5. Middle East and Africa
- 5.1. Market Analysis, Insights and Forecast - by Type
- 6. Global Cable Connector Market Analysis, Insights and Forecast, 2021-2033
- 6.1. Market Analysis, Insights and Forecast - by Type
- 6.1.1. PCB Connectors
- 6.1.2. Circular/Rectangular Connectors
- 6.1.3. Fiber Optic Connectors
- 6.1.4. IO Connectors
- 6.1.5. Other Types
- 6.2. Market Analysis, Insights and Forecast - by End-user Vertical
- 6.2.1. IT and Telecom
- 6.2.2. Automotive/Transportation
- 6.2.3. Consumer
- 6.2.4. Industrial
- 6.2.5. Other En
- 6.1. Market Analysis, Insights and Forecast - by Type
- 7. North America Cable Connector Market Analysis, Insights and Forecast, 2020-2032
- 7.1. Market Analysis, Insights and Forecast - by Type
- 7.1.1. PCB Connectors
- 7.1.2. Circular/Rectangular Connectors
- 7.1.3. Fiber Optic Connectors
- 7.1.4. IO Connectors
- 7.1.5. Other Types
- 7.2. Market Analysis, Insights and Forecast - by End-user Vertical
- 7.2.1. IT and Telecom
- 7.2.2. Automotive/Transportation
- 7.2.3. Consumer
- 7.2.4. Industrial
- 7.2.5. Other En
- 7.1. Market Analysis, Insights and Forecast - by Type
- 8. Europe Cable Connector Market Analysis, Insights and Forecast, 2020-2032
- 8.1. Market Analysis, Insights and Forecast - by Type
- 8.1.1. PCB Connectors
- 8.1.2. Circular/Rectangular Connectors
- 8.1.3. Fiber Optic Connectors
- 8.1.4. IO Connectors
- 8.1.5. Other Types
- 8.2. Market Analysis, Insights and Forecast - by End-user Vertical
- 8.2.1. IT and Telecom
- 8.2.2. Automotive/Transportation
- 8.2.3. Consumer
- 8.2.4. Industrial
- 8.2.5. Other En
- 8.1. Market Analysis, Insights and Forecast - by Type
- 9. Asia Pacific Cable Connector Market Analysis, Insights and Forecast, 2020-2032
- 9.1. Market Analysis, Insights and Forecast - by Type
- 9.1.1. PCB Connectors
- 9.1.2. Circular/Rectangular Connectors
- 9.1.3. Fiber Optic Connectors
- 9.1.4. IO Connectors
- 9.1.5. Other Types
- 9.2. Market Analysis, Insights and Forecast - by End-user Vertical
- 9.2.1. IT and Telecom
- 9.2.2. Automotive/Transportation
- 9.2.3. Consumer
- 9.2.4. Industrial
- 9.2.5. Other En
- 9.1. Market Analysis, Insights and Forecast - by Type
- 10. Latin America Cable Connector Market Analysis, Insights and Forecast, 2020-2032
- 10.1. Market Analysis, Insights and Forecast - by Type
- 10.1.1. PCB Connectors
- 10.1.2. Circular/Rectangular Connectors
- 10.1.3. Fiber Optic Connectors
- 10.1.4. IO Connectors
- 10.1.5. Other Types
- 10.2. Market Analysis, Insights and Forecast - by End-user Vertical
- 10.2.1. IT and Telecom
- 10.2.2. Automotive/Transportation
- 10.2.3. Consumer
- 10.2.4. Industrial
- 10.2.5. Other En
- 10.1. Market Analysis, Insights and Forecast - by Type
- 11. Middle East and Africa Cable Connector Market Analysis, Insights and Forecast, 2020-2032
- 11.1. Market Analysis, Insights and Forecast - by Type
- 11.1.1. PCB Connectors
- 11.1.2. Circular/Rectangular Connectors
- 11.1.3. Fiber Optic Connectors
- 11.1.4. IO Connectors
- 11.1.5. Other Types
- 11.2. Market Analysis, Insights and Forecast - by End-user Vertical
- 11.2.1. IT and Telecom
- 11.2.2. Automotive/Transportation
- 11.2.3. Consumer
- 11.2.4. Industrial
- 11.2.5. Other En
- 11.1. Market Analysis, Insights and Forecast - by Type
- 12. Competitive Analysis
- 12.1. Company Profiles
- 12.1.1 Axon Cable SAS
- 12.1.1.1. Company Overview
- 12.1.1.2. Products
- 12.1.1.3. Company Financials
- 12.1.1.4. SWOT Analysis
- 12.1.2 Huber+Suhner AG
- 12.1.2.1. Company Overview
- 12.1.2.2. Products
- 12.1.2.3. Company Financials
- 12.1.2.4. SWOT Analysis
- 12.1.3 Nexans SA
- 12.1.3.1. Company Overview
- 12.1.3.2. Products
- 12.1.3.3. Company Financials
- 12.1.3.4. SWOT Analysis
- 12.1.4 Molex Inc (Koch Industries)
- 12.1.4.1. Company Overview
- 12.1.4.2. Products
- 12.1.4.3. Company Financials
- 12.1.4.4. SWOT Analysis
- 12.1.5 Aptiv PLC
- 12.1.5.1. Company Overview
- 12.1.5.2. Products
- 12.1.5.3. Company Financials
- 12.1.5.4. SWOT Analysis
- 12.1.6 Prysmian SpA
- 12.1.6.1. Company Overview
- 12.1.6.2. Products
- 12.1.6.3. Company Financials
- 12.1.6.4. SWOT Analysis
- 12.1.7 3M Company
- 12.1.7.1. Company Overview
- 12.1.7.2. Products
- 12.1.7.3. Company Financials
- 12.1.7.4. SWOT Analysis
- 12.1.8 Fujitsu Limited
- 12.1.8.1. Company Overview
- 12.1.8.2. Products
- 12.1.8.3. Company Financials
- 12.1.8.4. SWOT Analysis
- 12.1.9 Amphenol Corporation
- 12.1.9.1. Company Overview
- 12.1.9.2. Products
- 12.1.9.3. Company Financials
- 12.1.9.4. SWOT Analysis
- 12.1.10 Huawei Technologies Co Ltd
- 12.1.10.1. Company Overview
- 12.1.10.2. Products
- 12.1.10.3. Company Financials
- 12.1.10.4. SWOT Analysis
- 12.1.11 TE Connectivity Limited
- 12.1.11.1. Company Overview
- 12.1.11.2. Products
- 12.1.11.3. Company Financials
- 12.1.11.4. SWOT Analysis
- 12.1.12 Yazaki Corporation
- 12.1.12.1. Company Overview
- 12.1.12.2. Products
- 12.1.12.3. Company Financials
- 12.1.12.4. SWOT Analysis
- 12.1.13 Alcatel-Lucent SA
- 12.1.13.1. Company Overview
- 12.1.13.2. Products
- 12.1.13.3. Company Financials
- 12.1.13.4. SWOT Analysis
- 12.1.1 Axon Cable SAS
- 12.2. Market Entropy
- 12.2.1 Company's Key Areas Served
- 12.2.2 Recent Developments
- 12.3. Company Market Share Analysis 2025
- 12.3.1 Top 5 Companies Market Share Analysis
- 12.3.2 Top 3 Companies Market Share Analysis
- 12.4. List of Potential Customers
- 13. Research Methodology
List of Figures
- Figure 1: Global Cable Connector Market Revenue Breakdown (Million, %) by Region 2025 & 2033
- Figure 2: Global Cable Connector Market Volume Breakdown (K Unit, %) by Region 2025 & 2033
- Figure 3: North America Cable Connector Market Revenue (Million), by Type 2025 & 2033
- Figure 4: North America Cable Connector Market Volume (K Unit), by Type 2025 & 2033
- Figure 5: North America Cable Connector Market Revenue Share (%), by Type 2025 & 2033
- Figure 6: North America Cable Connector Market Volume Share (%), by Type 2025 & 2033
- Figure 7: North America Cable Connector Market Revenue (Million), by End-user Vertical 2025 & 2033
- Figure 8: North America Cable Connector Market Volume (K Unit), by End-user Vertical 2025 & 2033
- Figure 9: North America Cable Connector Market Revenue Share (%), by End-user Vertical 2025 & 2033
- Figure 10: North America Cable Connector Market Volume Share (%), by End-user Vertical 2025 & 2033
- Figure 11: North America Cable Connector Market Revenue (Million), by Country 2025 & 2033
- Figure 12: North America Cable Connector Market Volume (K Unit), by Country 2025 & 2033
- Figure 13: North America Cable Connector Market Revenue Share (%), by Country 2025 & 2033
- Figure 14: North America Cable Connector Market Volume Share (%), by Country 2025 & 2033
- Figure 15: Europe Cable Connector Market Revenue (Million), by Type 2025 & 2033
- Figure 16: Europe Cable Connector Market Volume (K Unit), by Type 2025 & 2033
- Figure 17: Europe Cable Connector Market Revenue Share (%), by Type 2025 & 2033
- Figure 18: Europe Cable Connector Market Volume Share (%), by Type 2025 & 2033
- Figure 19: Europe Cable Connector Market Revenue (Million), by End-user Vertical 2025 & 2033
- Figure 20: Europe Cable Connector Market Volume (K Unit), by End-user Vertical 2025 & 2033
- Figure 21: Europe Cable Connector Market Revenue Share (%), by End-user Vertical 2025 & 2033
- Figure 22: Europe Cable Connector Market Volume Share (%), by End-user Vertical 2025 & 2033
- Figure 23: Europe Cable Connector Market Revenue (Million), by Country 2025 & 2033
- Figure 24: Europe Cable Connector Market Volume (K Unit), by Country 2025 & 2033
- Figure 25: Europe Cable Connector Market Revenue Share (%), by Country 2025 & 2033
- Figure 26: Europe Cable Connector Market Volume Share (%), by Country 2025 & 2033
- Figure 27: Asia Pacific Cable Connector Market Revenue (Million), by Type 2025 & 2033
- Figure 28: Asia Pacific Cable Connector Market Volume (K Unit), by Type 2025 & 2033
- Figure 29: Asia Pacific Cable Connector Market Revenue Share (%), by Type 2025 & 2033
- Figure 30: Asia Pacific Cable Connector Market Volume Share (%), by Type 2025 & 2033
- Figure 31: Asia Pacific Cable Connector Market Revenue (Million), by End-user Vertical 2025 & 2033
- Figure 32: Asia Pacific Cable Connector Market Volume (K Unit), by End-user Vertical 2025 & 2033
- Figure 33: Asia Pacific Cable Connector Market Revenue Share (%), by End-user Vertical 2025 & 2033
- Figure 34: Asia Pacific Cable Connector Market Volume Share (%), by End-user Vertical 2025 & 2033
- Figure 35: Asia Pacific Cable Connector Market Revenue (Million), by Country 2025 & 2033
- Figure 36: Asia Pacific Cable Connector Market Volume (K Unit), by Country 2025 & 2033
- Figure 37: Asia Pacific Cable Connector Market Revenue Share (%), by Country 2025 & 2033
- Figure 38: Asia Pacific Cable Connector Market Volume Share (%), by Country 2025 & 2033
- Figure 39: Latin America Cable Connector Market Revenue (Million), by Type 2025 & 2033
- Figure 40: Latin America Cable Connector Market Volume (K Unit), by Type 2025 & 2033
- Figure 41: Latin America Cable Connector Market Revenue Share (%), by Type 2025 & 2033
- Figure 42: Latin America Cable Connector Market Volume Share (%), by Type 2025 & 2033
- Figure 43: Latin America Cable Connector Market Revenue (Million), by End-user Vertical 2025 & 2033
- Figure 44: Latin America Cable Connector Market Volume (K Unit), by End-user Vertical 2025 & 2033
- Figure 45: Latin America Cable Connector Market Revenue Share (%), by End-user Vertical 2025 & 2033
- Figure 46: Latin America Cable Connector Market Volume Share (%), by End-user Vertical 2025 & 2033
- Figure 47: Latin America Cable Connector Market Revenue (Million), by Country 2025 & 2033
- Figure 48: Latin America Cable Connector Market Volume (K Unit), by Country 2025 & 2033
- Figure 49: Latin America Cable Connector Market Revenue Share (%), by Country 2025 & 2033
- Figure 50: Latin America Cable Connector Market Volume Share (%), by Country 2025 & 2033
- Figure 51: Middle East and Africa Cable Connector Market Revenue (Million), by Type 2025 & 2033
- Figure 52: Middle East and Africa Cable Connector Market Volume (K Unit), by Type 2025 & 2033
- Figure 53: Middle East and Africa Cable Connector Market Revenue Share (%), by Type 2025 & 2033
- Figure 54: Middle East and Africa Cable Connector Market Volume Share (%), by Type 2025 & 2033
- Figure 55: Middle East and Africa Cable Connector Market Revenue (Million), by End-user Vertical 2025 & 2033
- Figure 56: Middle East and Africa Cable Connector Market Volume (K Unit), by End-user Vertical 2025 & 2033
- Figure 57: Middle East and Africa Cable Connector Market Revenue Share (%), by End-user Vertical 2025 & 2033
- Figure 58: Middle East and Africa Cable Connector Market Volume Share (%), by End-user Vertical 2025 & 2033
- Figure 59: Middle East and Africa Cable Connector Market Revenue (Million), by Country 2025 & 2033
- Figure 60: Middle East and Africa Cable Connector Market Volume (K Unit), by Country 2025 & 2033
- Figure 61: Middle East and Africa Cable Connector Market Revenue Share (%), by Country 2025 & 2033
- Figure 62: Middle East and Africa Cable Connector Market Volume Share (%), by Country 2025 & 2033
List of Tables
- Table 1: Global Cable Connector Market Revenue Million Forecast, by Type 2020 & 2033
- Table 2: Global Cable Connector Market Volume K Unit Forecast, by Type 2020 & 2033
- Table 3: Global Cable Connector Market Revenue Million Forecast, by End-user Vertical 2020 & 2033
- Table 4: Global Cable Connector Market Volume K Unit Forecast, by End-user Vertical 2020 & 2033
- Table 5: Global Cable Connector Market Revenue Million Forecast, by Region 2020 & 2033
- Table 6: Global Cable Connector Market Volume K Unit Forecast, by Region 2020 & 2033
- Table 7: Global Cable Connector Market Revenue Million Forecast, by Type 2020 & 2033
- Table 8: Global Cable Connector Market Volume K Unit Forecast, by Type 2020 & 2033
- Table 9: Global Cable Connector Market Revenue Million Forecast, by End-user Vertical 2020 & 2033
- Table 10: Global Cable Connector Market Volume K Unit Forecast, by End-user Vertical 2020 & 2033
- Table 11: Global Cable Connector Market Revenue Million Forecast, by Country 2020 & 2033
- Table 12: Global Cable Connector Market Volume K Unit Forecast, by Country 2020 & 2033
- Table 13: Global Cable Connector Market Revenue Million Forecast, by Type 2020 & 2033
- Table 14: Global Cable Connector Market Volume K Unit Forecast, by Type 2020 & 2033
- Table 15: Global Cable Connector Market Revenue Million Forecast, by End-user Vertical 2020 & 2033
- Table 16: Global Cable Connector Market Volume K Unit Forecast, by End-user Vertical 2020 & 2033
- Table 17: Global Cable Connector Market Revenue Million Forecast, by Country 2020 & 2033
- Table 18: Global Cable Connector Market Volume K Unit Forecast, by Country 2020 & 2033
- Table 19: Global Cable Connector Market Revenue Million Forecast, by Type 2020 & 2033
- Table 20: Global Cable Connector Market Volume K Unit Forecast, by Type 2020 & 2033
- Table 21: Global Cable Connector Market Revenue Million Forecast, by End-user Vertical 2020 & 2033
- Table 22: Global Cable Connector Market Volume K Unit Forecast, by End-user Vertical 2020 & 2033
- Table 23: Global Cable Connector Market Revenue Million Forecast, by Country 2020 & 2033
- Table 24: Global Cable Connector Market Volume K Unit Forecast, by Country 2020 & 2033
- Table 25: Global Cable Connector Market Revenue Million Forecast, by Type 2020 & 2033
- Table 26: Global Cable Connector Market Volume K Unit Forecast, by Type 2020 & 2033
- Table 27: Global Cable Connector Market Revenue Million Forecast, by End-user Vertical 2020 & 2033
- Table 28: Global Cable Connector Market Volume K Unit Forecast, by End-user Vertical 2020 & 2033
- Table 29: Global Cable Connector Market Revenue Million Forecast, by Country 2020 & 2033
- Table 30: Global Cable Connector Market Volume K Unit Forecast, by Country 2020 & 2033
- Table 31: Global Cable Connector Market Revenue Million Forecast, by Type 2020 & 2033
- Table 32: Global Cable Connector Market Volume K Unit Forecast, by Type 2020 & 2033
- Table 33: Global Cable Connector Market Revenue Million Forecast, by End-user Vertical 2020 & 2033
- Table 34: Global Cable Connector Market Volume K Unit Forecast, by End-user Vertical 2020 & 2033
- Table 35: Global Cable Connector Market Revenue Million Forecast, by Country 2020 & 2033
- Table 36: Global Cable Connector Market Volume K Unit Forecast, by Country 2020 & 2033
Frequently Asked Questions
1. What is the projected Compound Annual Growth Rate (CAGR) of the Cable Connector Market?
The projected CAGR is approximately 7.30%.
2. Which companies are prominent players in the Cable Connector Market?
Key companies in the market include Axon Cable SAS, Huber+Suhner AG, Nexans SA, Molex Inc (Koch Industries), Aptiv PLC, Prysmian SpA, 3M Company, Fujitsu Limited, Amphenol Corporation, Huawei Technologies Co Ltd, TE Connectivity Limited, Yazaki Corporation, Alcatel-Lucent SA.
3. What are the main segments of the Cable Connector Market?
The market segments include Type, End-user Vertical.
4. Can you provide details about the market size?
The market size is estimated to be USD 102.81 Million as of 2022.
5. What are some drivers contributing to market growth?
Growing Advancements In The Telecom Sector Coupled With Greater Demand for Improved Connectivity; Increasing Demand for High Bandwidth.
6. What are the notable trends driving market growth?
Automotive Sector is Expected to Hold Significant Market Share.
7. Are there any restraints impacting market growth?
Fragmentation in the Regional Markets; Volatility in Raw Material Prices.
8. Can you provide examples of recent developments in the market?
November 2021 - TE Connectivity announced the launch of new connectors that are designed to work with robots and UAVs. To protect the unit from extreme environments, the connector is encased in a high-temperature rated plastic assembly. The connector is also outfitted with contact position locks to secure the housing during high and frequent vibration events.
9. What pricing options are available for accessing the report?
Pricing options include single-user, multi-user, and enterprise licenses priced at USD 4750, USD 5250, and USD 8750 respectively.
10. Is the market size provided in terms of value or volume?
The market size is provided in terms of value, measured in Million and volume, measured in K Unit.
11. Are there any specific market keywords associated with the report?
Yes, the market keyword associated with the report is "Cable Connector Market," which aids in identifying and referencing the specific market segment covered.
12. How do I determine which pricing option suits my needs best?
The pricing options vary based on user requirements and access needs. Individual users may opt for single-user licenses, while businesses requiring broader access may choose multi-user or enterprise licenses for cost-effective access to the report.
13. Are there any additional resources or data provided in the Cable Connector Market report?
While the report offers comprehensive insights, it's advisable to review the specific contents or supplementary materials provided to ascertain if additional resources or data are available.
14. How can I stay updated on further developments or reports in the Cable Connector Market?
To stay informed about further developments, trends, and reports in the Cable Connector Market, consider subscribing to industry newsletters, following relevant companies and organizations, or regularly checking reputable industry news sources and publications.
Methodology
Step 1 - Identification of Relevant Samples Size from Population Database


Step 2 - Approaches for Defining Global Market Size (Value, Volume* & Price*)

Note*: In applicable scenarios
Step 3 - Data Sources
Primary Research
- Web Analytics
- Survey Reports
- Research Institute
- Latest Research Reports
- Opinion Leaders
Secondary Research
- Annual Reports
- White Paper
- Latest Press Release
- Industry Association
- Paid Database
- Investor Presentations

Step 4 - Data Triangulation
Involves using different sources of information in order to increase the validity of a study
These sources are likely to be stakeholders in a program - participants, other researchers, program staff, other community members, and so on.
Then we put all data in single framework & apply various statistical tools to find out the dynamic on the market.
During the analysis stage, feedback from the stakeholder groups would be compared to determine areas of agreement as well as areas of divergence