

Key Insights for Ceramic Solutions Market
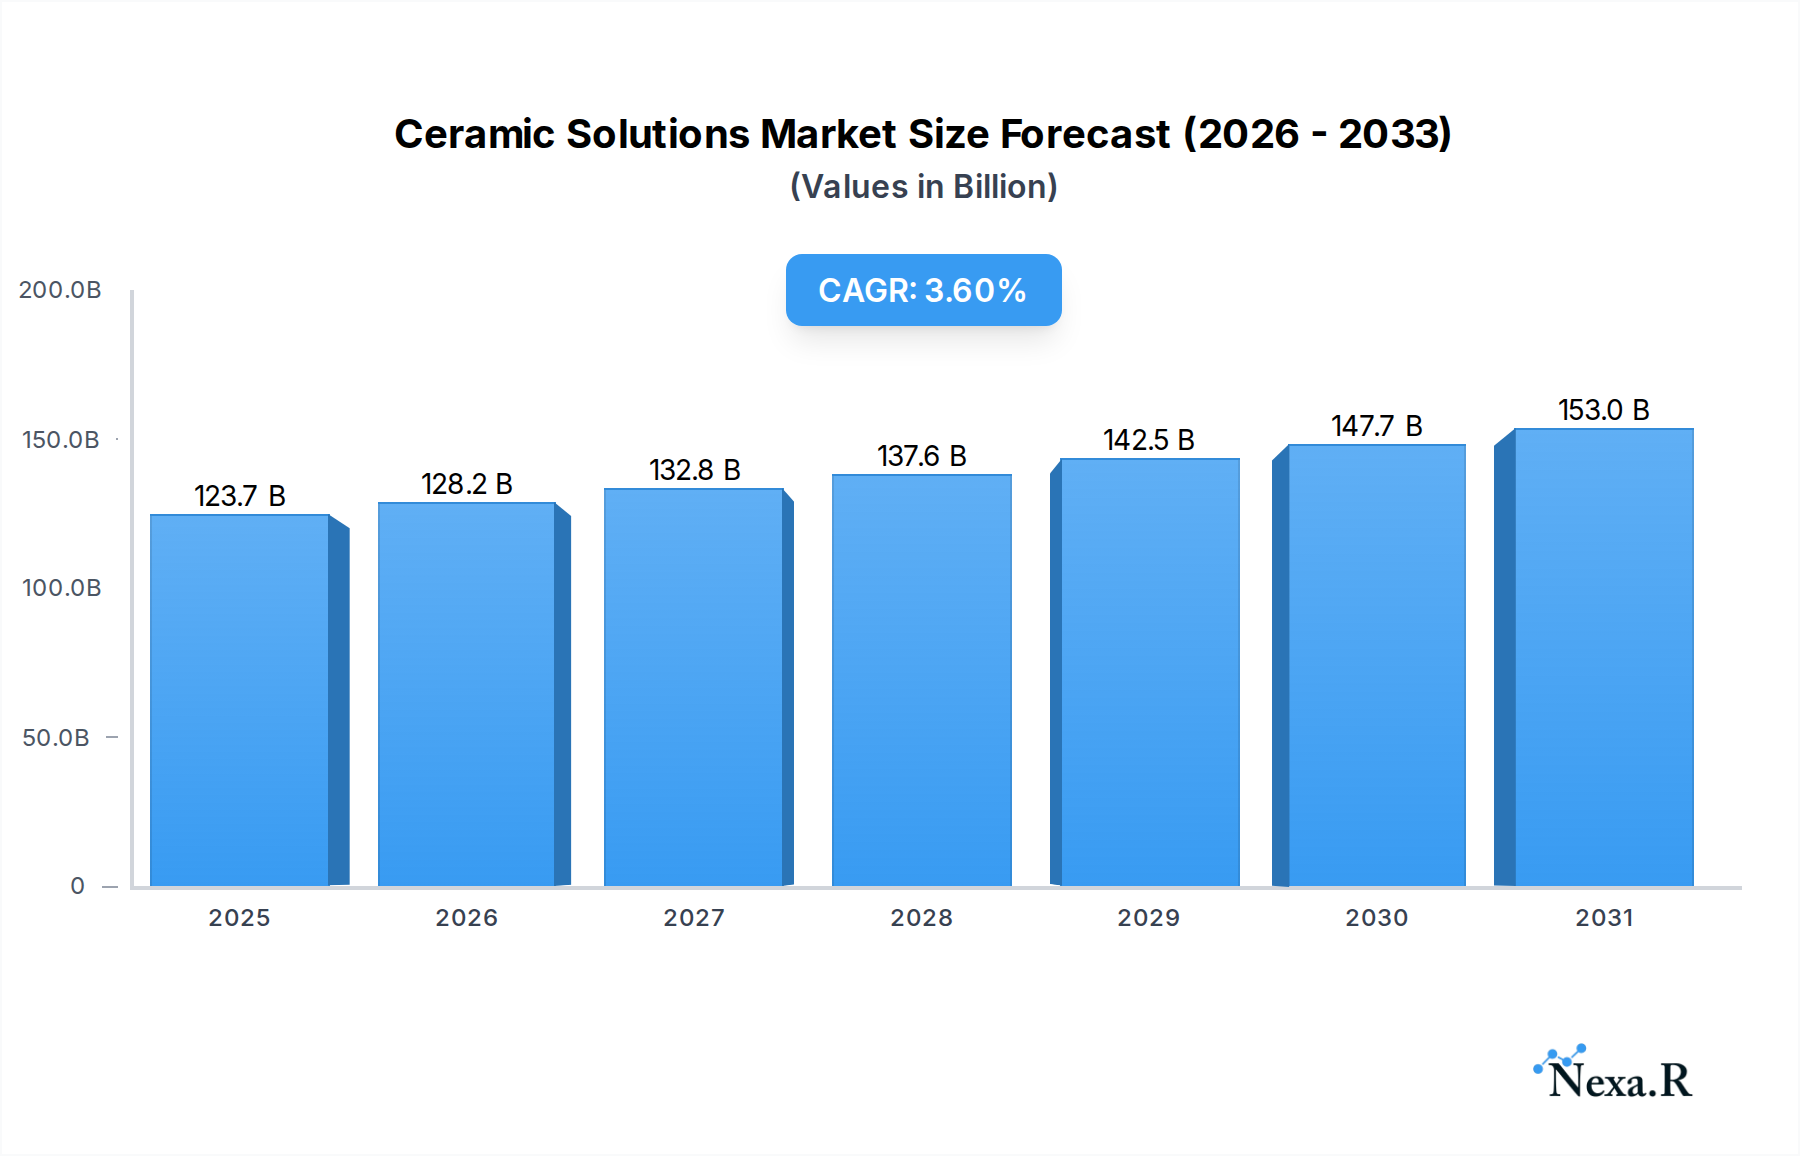
The Global Ceramic Solutions Market, a critical component within the broader Technology, Media and Telecom sector, was valued at an estimated $119.44 billion in 2025. Projections indicate a robust expansion, with the market anticipated to reach approximately $164.7 billion by 2034, demonstrating a compound annual growth rate (CAGR) of 3.6% over the forecast period. This significant growth is primarily propelled by the escalating demand for high-performance materials capable of operating under extreme conditions, alongside technological advancements across various end-user industries. Key demand drivers include the miniaturization and enhanced functionality requirements within the Electronics & Semiconductors sector, the imperative for lightweight and high-strength components in Automotive and Aerospace & Defense applications, and the increasing adoption of biocompatible ceramic implants in Healthcare & Medical. Macro tailwinds such as rapid industrialization, particularly in emerging economies, and the global shift towards sustainable manufacturing practices, further underscore the market's positive trajectory. Innovation in material science, focusing on novel composite structures, advanced processing techniques, and the integration of smart functionalities, is continuously expanding the application landscape for ceramic solutions. The Advanced Materials Market is inherently linked to the progression of ceramic technologies, as these solutions offer unparalleled properties in terms of thermal stability, wear resistance, electrical insulation, and corrosion resistance. Furthermore, the growing sophistication of the Electronic Materials Market necessitates ceramic components with precise dielectric properties and efficient heat dissipation capabilities, driving sustained investment in research and development within this domain. This forward-looking outlook suggests a dynamic market poised for substantial expansion, underpinned by continuous innovation and diversified application potential.
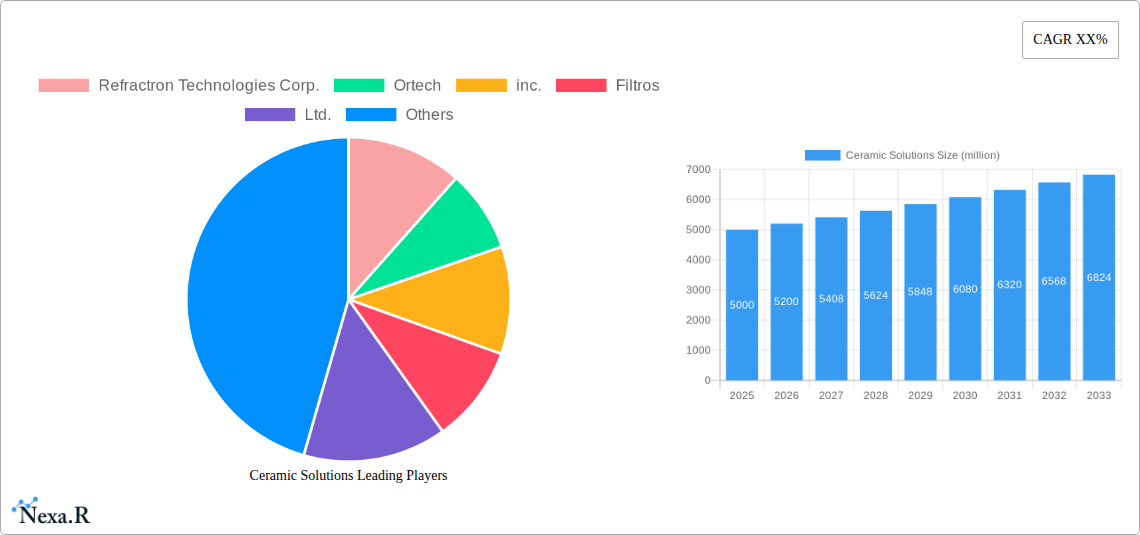
Ceramic Solutions Market Size (In Billion)
The Dominance of Electronics & Semiconductors in Ceramic Solutions Market
The Electronics & Semiconductors segment, classified under End User Industry, stands out as the single largest segment by revenue share within the Ceramic Solutions Market. This dominance is attributed to the intrinsic properties of ceramics that are indispensable for modern electronic devices and semiconductor manufacturing. Ceramics offer superior electrical insulation, high dielectric strength, excellent thermal conductivity, and chemical inertness, making them ideal for critical components such as substrates, packaging, insulators, capacitors, and various sensor applications. The ongoing global trend of miniaturization in electronic devices, coupled with the increasing demand for higher processing speeds and greater energy efficiency, directly fuels the adoption of advanced ceramic solutions. For instance, in power electronics, ceramics are vital for thermal management, enabling efficient heat dissipation from high-power devices, thereby extending their operational life and reliability. The proliferation of 5G technology, Artificial Intelligence (AI), Internet of Things (IoT) devices, and electric vehicles (EVs) is creating unprecedented demand for high-performance electronic components, many of which rely on specialized ceramic materials. Companies operating in this space, such as Kyocera Corporation and NGK Insulators, Ltd., are at the forefront of developing sophisticated ceramic solutions tailored for semiconductor fabrication equipment and advanced electronic packaging. The segment's share is not only significant but also poised for continued growth, driven by sustained innovation in areas like ceramic-on-metal substrates, low-temperature co-fired ceramics (LTCC), and ultra-thin ceramic films. The burgeoning Electronic Materials Market is profoundly influenced by these developments, as ceramic materials underpin the foundational performance characteristics required for next-generation devices. The demand for materials like high-purity Alumina Market ceramics in integrated circuit manufacturing, due to their excellent insulating properties and high thermal conductivity, exemplifies this segment's enduring importance. As electronic devices become more complex and operate under more demanding conditions, the reliance on advanced ceramic solutions for their stability, performance, and longevity will only intensify, solidifying this segment's leading position within the Ceramic Solutions Market.
Ceramic Solutions Company Market Share
Catalytic Drivers & Strategic Constraints in Ceramic Solutions Market
The Ceramic Solutions Market is primarily propelled by the escalating demand for materials exhibiting exceptional performance characteristics in extreme operating environments. A significant driver is the continuous advancement in end-user industries such as Aerospace & Defense, where ceramics are critical for high-temperature resistance, lightweighting, and structural integrity. The use of ceramic matrix composites in jet engine components, for example, allows for higher operating temperatures and improved fuel efficiency, directly addressing the aerospace sector's push for performance optimization and emissions reduction. Similarly, the Automotive Ceramics Market sees robust growth driven by the need for enhanced wear resistance, thermal management, and corrosion protection in engine components, exhaust systems, and brake pads, particularly with the rise of electric vehicles requiring efficient thermal management solutions for batteries and power electronics. In the Healthcare & Medical sector, the demand for biocompatible and wear-resistant ceramics for dental implants, orthopedic prosthetics, and surgical instruments represents another key driver, with market growth directly tied to an aging global population and increasing healthcare expenditure. The Alumina Market and Silicon Carbide Market, specifically, benefit from these trends due to their inherent hardness, chemical inertness, and high-temperature stability. Conversely, the market faces several strategic constraints. The high manufacturing costs associated with producing advanced ceramics, primarily due to energy-intensive processing and the precision required in fabrication, can limit broader adoption. The inherent brittleness of many ceramic materials, leading to susceptibility to catastrophic failure under tensile stress, remains a significant engineering challenge. Furthermore, the complexity of designing and processing ceramic components, often requiring specialized equipment and skilled labor, contributes to longer lead times and higher overall project costs. Variability in raw material quality and supply chain complexities can also pose limitations, particularly for specialized Ceramic Powders Market segments. Addressing these constraints through advanced additive manufacturing techniques, improved material design, and cost-effective processing innovations is crucial for unlocking the full potential of the Ceramic Solutions Market.
Competitive Ecosystem of Ceramic Solutions Market
The Ceramic Solutions Market is characterized by a diverse competitive landscape, featuring established multinational corporations and specialized manufacturers focusing on niche applications. Key players leverage extensive R&D, strategic partnerships, and a broad product portfolio to maintain market share and drive innovation across various end-use sectors.
- CoorsTek, LLC: A global leader in engineered ceramics, specializing in advanced ceramic solutions for automotive, medical, aerospace, and semiconductor industries, known for high-performance technical ceramics and custom-engineered components.
- Ortech, Inc.: Focuses on precision ceramic machining and manufacturing, offering custom ceramic parts and components for a wide range of industrial and scientific applications.
- Kyocera Corporation: A diversified global company with a strong presence in fine ceramics, providing components for electronics, automotive, industrial machinery, and medical devices, recognized for its advanced material science expertise.
- Morgan Advanced Materials PLC: An international manufacturer of advanced materials, including technical ceramics, thermal products, and carbon and composites, serving energy, transport, healthcare, and industrial sectors.
- CeramTec GmbH: A leading international manufacturer of advanced ceramics for medical technology, automotive, electronics, and industrial applications, renowned for its high-performance and biocompatible ceramic products.
- Saint-Gobain S.A.: A global leader in light and sustainable construction, with a significant advanced ceramics division producing high-performance materials for demanding industrial applications.
- 3M Company: A multinational conglomerate that applies science to improve lives, offering a range of advanced materials including ceramic technologies used in abrasives, filters, and specialized coatings.
- NGK Insulators, Ltd.: A prominent manufacturer of insulators, ceramics for semiconductor manufacturing equipment, and automotive components, known for its expertise in large-scale ceramic structures and high-temperature applications.
- SCHOTT AG: An international technology group specializing in glass and glass-ceramics, providing high-tech materials for optics, electronics, healthcare, and household appliances, including ceramic solutions for specialized applications.
- Rauschert GmbH & Co. KG: A family-owned company specializing in technical ceramics, offering a wide array of ceramic components for electrical engineering, heating, and mechanical engineering applications.
- Ibiden Co., Ltd.: A Japanese company known for its electronics-related products, including ceramic substrates for integrated circuits, diesel particulate filters, and other advanced ceramic components.
- Refractron Technologies Corp.: Specializes in high-performance ceramic manufacturing, producing custom and standard ceramic components for harsh industrial and scientific environments.
- Filtros, Ltd.: A manufacturer of porous ceramic components, offering filtration solutions and other specialized ceramic products for industrial and environmental applications.
- Elan Technology: A provider of custom-engineered ceramic powders and advanced ceramic solutions, serving diverse markets with expertise in material formulation and processing.
- Blasch Precision Ceramics: Manufactures complex, refractory ceramic shapes with tight tolerances for demanding industrial applications, specializing in intricate designs and high-temperature performance.
- AdTech Ceramics Company: Focuses on advanced ceramic packaging and high-temperature ceramic components, primarily serving the aerospace, defense, and electronics industries.
Recent Developments & Milestones in Ceramic Solutions Market
The Ceramic Solutions Market is consistently evolving with continuous advancements in material science, manufacturing processes, and strategic collaborations, driving innovation and expanding application possibilities.
- May 2024: A leading Advanced Materials Market player announced a breakthrough in additive manufacturing techniques for Ceramic Matrix Composites Market, enabling the production of more intricate geometries with enhanced strength-to-weight ratios for aerospace applications.
- March 2024: Several major automotive suppliers partnered to develop next-generation Automotive Ceramics Market components designed to withstand higher temperatures and provide superior wear resistance in electric vehicle powertrains, improving efficiency and durability.
- January 2024: A prominent ceramics manufacturer launched a new line of high-purity Alumina Market powders specifically engineered for advanced semiconductor packaging, aiming to improve thermal management and electrical performance in high-density integrated circuits.
- November 2023: Collaborations between academic institutions and industrial firms resulted in the development of self-healing ceramic coatings, promising extended lifespan and reduced maintenance for components in harsh industrial environments.
- September 2023: A key player in the Electronic Materials Market introduced novel Silicon Carbide Market substrates tailored for 5G telecommunications infrastructure, offering enhanced power handling and reduced signal loss at high frequencies.
- July 2023: Strategic alliances focused on sustainable manufacturing practices within the Ceramic Solutions Market led to investments in energy-efficient kilns and circular economy initiatives for ceramic waste recycling, aligning with global ESG objectives.
- April 2023: The Ceramic Coatings Market witnessed the introduction of bio-inert and antimicrobial ceramic coatings designed for medical implants and instruments, enhancing patient safety and product longevity in the healthcare sector.
- February 2023: A new regulatory framework was proposed in key regions to standardize testing and certification for advanced ceramic components, particularly those used in critical aerospace and defense applications, ensuring reliability and performance.
Regional Market Dynamics for Ceramic Solutions Market
The Global Ceramic Solutions Market exhibits distinct regional dynamics, influenced by varying industrial landscapes, technological adoption rates, and regulatory environments. Asia Pacific currently dominates the market in terms of revenue share and is also projected to be the fastest-growing region. This is primarily driven by the robust expansion of manufacturing sectors, particularly electronics, automotive, and industrial machinery, in countries like China, India, Japan, and South Korea. The rapid urbanization and infrastructure development in these nations further bolster the demand for ceramic solutions in construction and utility applications. The region's extensive production capabilities and competitive manufacturing costs make it a global hub for ceramic product development and export, including the burgeoning Industrial Ceramics Market. The significant growth in semiconductor manufacturing and consumer electronics further solidifies Asia Pacific's leading position, particularly impacting the demand for specialized Electronic Materials Market components.
North America, a mature market, holds a substantial revenue share, largely due to its strong presence in high-value industries such as Aerospace & Defense, Healthcare & Medical, and advanced research & development. The region is a key innovator in developing next-generation ceramic solutions for demanding applications, driven by stringent performance requirements and significant investment in R&D. Demand here is particularly high for Aerospace & Defense Ceramics Market components and advanced medical ceramics, prioritizing performance and reliability over cost.
Europe also represents a mature but technologically advanced market, with significant contributions from Germany, France, and the UK. The region’s focus on precision engineering, luxury automotive manufacturing, and stringent environmental regulations drives the adoption of high-performance and sustainable ceramic solutions. European players are prominent in specialized segments like Ceramic Coatings Market and advanced Ceramic Matrix Composites Market, catering to industrial, energy, and automotive applications, including the evolving Automotive Ceramics Market through lightweighting and efficiency improvements.
The Middle East & Africa and South America regions, while smaller in market share, are expected to demonstrate steady growth. This growth is spurred by increasing investments in infrastructure development, industrialization, and diversification of economies beyond oil and gas in the Middle East, leading to rising demand for refractories and wear-resistant ceramic solutions. South America's growth is largely tied to its mining, automotive, and construction sectors. These regions represent emerging opportunities as industrial bases expand and technological adoption accelerates, gradually increasing their contribution to the global Ceramic Solutions Market.
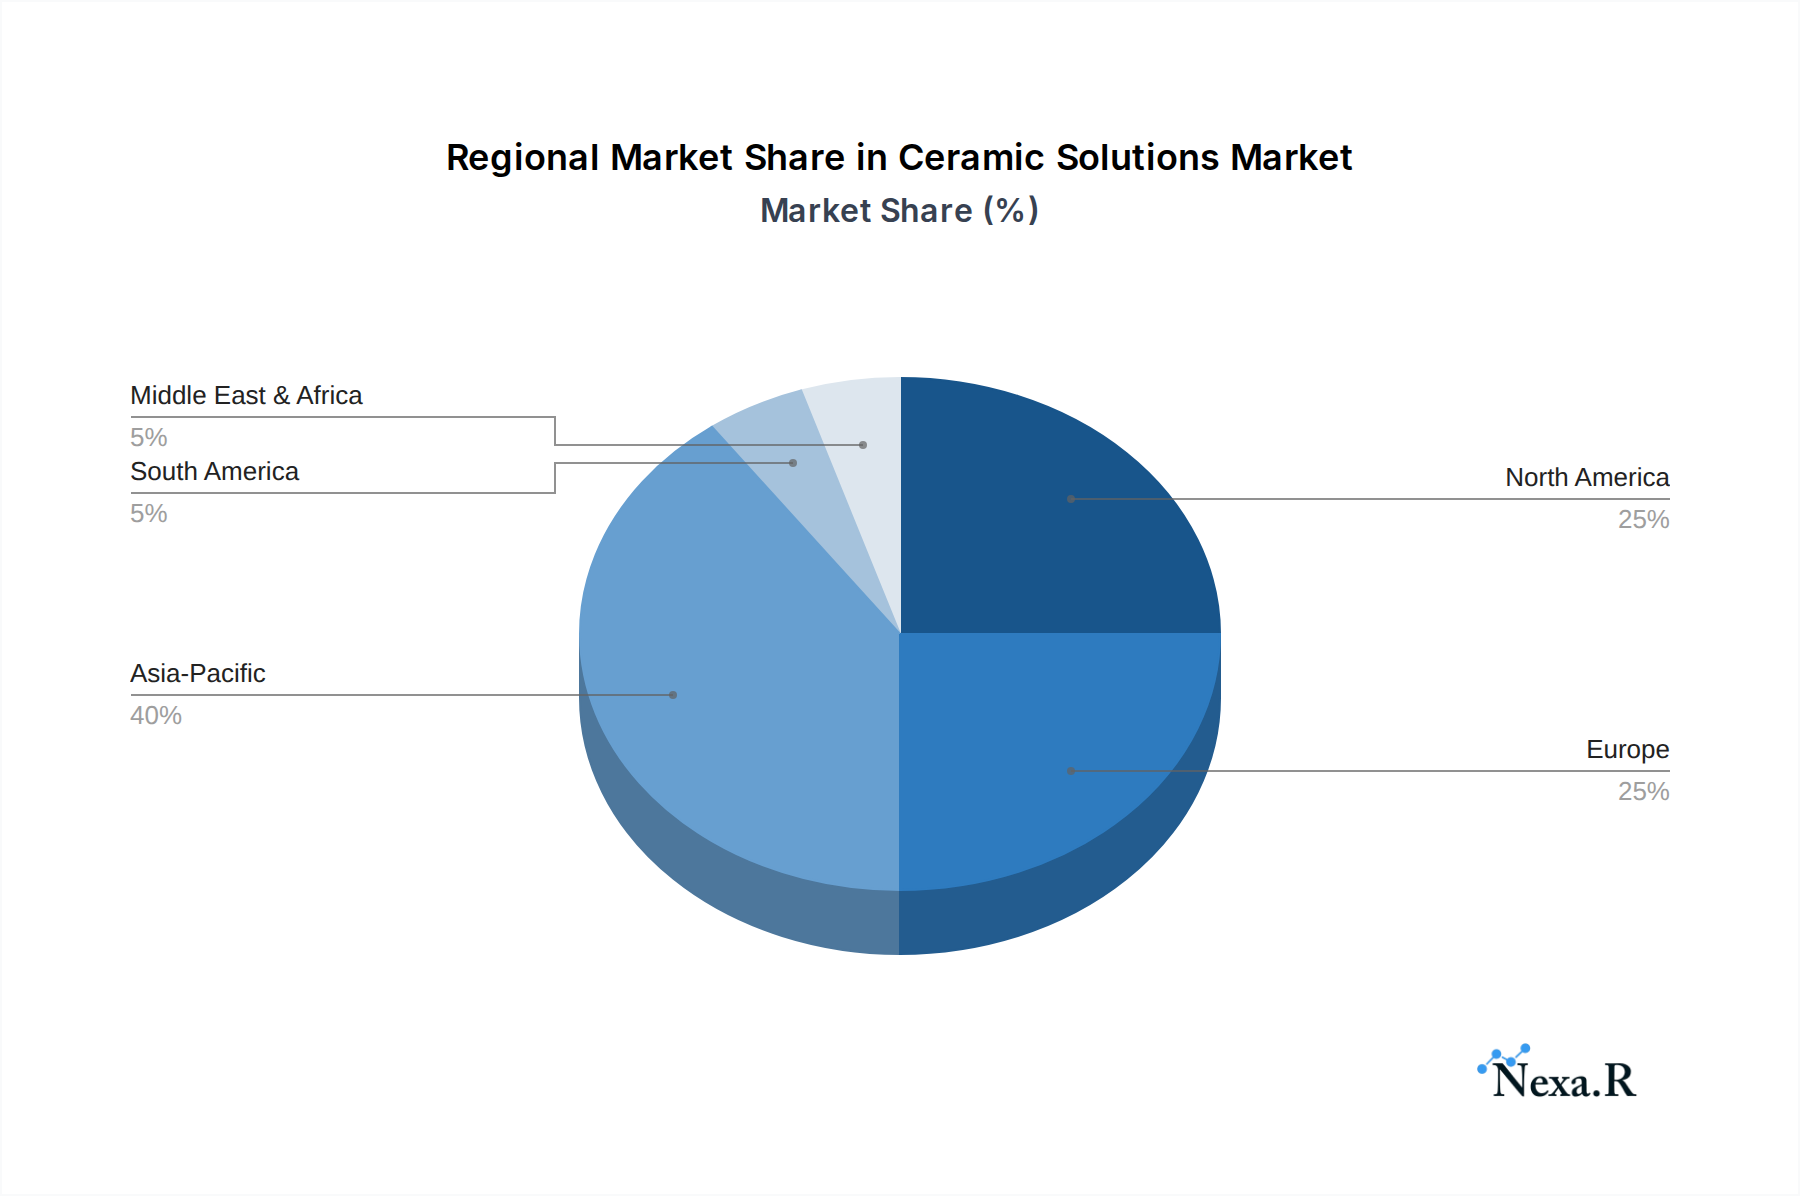
Ceramic Solutions Regional Market Share
Sustainability & ESG Pressures on Ceramic Solutions Market
The Ceramic Solutions Market is increasingly subject to rigorous sustainability and ESG (Environmental, Social, and Governance) pressures, influencing every stage from raw material sourcing to end-of-life management. Environmental regulations, such as those related to greenhouse gas emissions and hazardous waste disposal, are compelling manufacturers to adopt greener production processes. The energy-intensive nature of ceramic firing processes, for instance, is driving innovation in energy-efficient kiln technologies and the integration of renewable energy sources. Companies are investing in R&D to develop low-temperature sintering methods and less energy-intensive manufacturing techniques, aiming to reduce their carbon footprint. Furthermore, the push for a circular economy is prompting ceramic solution providers to explore recycling opportunities for ceramic waste and develop products with enhanced durability and reparability to extend their lifespan, thereby minimizing waste sent to landfills. This is particularly relevant for high-volume segments within the Industrial Ceramics Market where significant material inputs are required.
From a material perspective, there's a growing preference for non-toxic and sustainably sourced raw materials. This includes investigating alternative raw materials that have a lower environmental impact or are derived from recycled content, alongside ensuring responsible mining practices. ESG investor criteria are also playing a crucial role, with capital increasingly flowing towards companies demonstrating strong environmental stewardship, fair labor practices, and transparent governance. This pressure is accelerating the development of lightweight ceramic components, particularly evident in the Automotive Ceramics Market and Aerospace & Defense Ceramics Market, where material lightweighting directly translates to improved fuel efficiency and reduced emissions during vehicle and aircraft operation. Manufacturers are also focusing on the lifecycle assessment of their products to identify and mitigate environmental impacts at every stage, from production to disposal. Addressing these ESG pressures is not merely a compliance issue but a strategic imperative, driving innovation in sustainable product design, manufacturing processes, and supply chain management to gain a competitive edge in the Ceramic Solutions Market.
Export, Trade Flow & Tariff Impact on Ceramic Solutions Market
The Ceramic Solutions Market is intrinsically global, with complex export and trade flows influenced by production hubs, technological expertise, and regional demand patterns. Major trade corridors typically involve exports from highly industrialized nations with advanced ceramic manufacturing capabilities to regions with burgeoning manufacturing sectors or specific application demands. China, Germany, Japan, and the United States stand out as significant exporting nations for various ceramic solutions, including raw materials like Alumina Market and specialized products such as Ceramic Matrix Composites Market. Key importing nations include the United States, various European countries, and emerging economies in Asia and South America, which rely on imported advanced ceramics for their electronics, automotive, and industrial sectors.
Recent trade policies and tariffs have introduced notable disruptions to these established flows. For instance, the trade tensions between the U.S. and China have resulted in tariffs on specific advanced materials and components, increasing the cost of imports and compelling supply chain diversification. These tariffs can directly impact the profitability of ceramic solution providers, leading to higher prices for end-users or incentivizing local production to avoid duties. For specialized products like Ceramic Coatings Market used in high-tech industries, even minor tariff changes can significantly affect cross-border volume due to the high-value nature and critical performance requirements. Non-tariff barriers, such as stringent product certifications, environmental regulations, and intellectual property protection, also play a crucial role in shaping trade dynamics. Companies in the Aerospace & Defense Ceramics Market, for example, face complex export control regulations that restrict the transfer of sensitive technologies. Geopolitical shifts and regional trade agreements can either facilitate or impede the movement of ceramic solutions, impacting market access and competition. As global supply chains become more interconnected, monitoring these trade policies and adapting strategies to navigate tariff landscapes and regulatory complexities remains a critical challenge for stakeholders in the Ceramic Solutions Market, influencing investment decisions and market expansion plans.
Ceramic Solutions Segmentation
-
1. Product Type
- 1.1. Monolithic Ceramics
- 1.2. Ceramic Coatings
- 1.3. Ceramic Matrix Composites
- 1.4. Ceramic Powders
-
2. Material Type
- 2.1. Alumina
- 2.2. Silicon Carbide
- 2.3. Zirconia
-
3. Application
- 3.1. Electrical Insulation
- 3.2. Thermal Barrier
- 3.3. Wear Resistance
- 3.4. Corrosion Resistance
- 3.5. Others
-
4. End User Industry
- 4.1. Electronics & Semiconductors
- 4.2. Automotive
- 4.3. Healthcare & Medical
- 4.4. Industrial & Machinery
- 4.5. Aerospace & Defense
- 4.6. Chemical & Petrochemical
- 4.7. Others
-
5. Sales Channel
- 5.1. Direct Sales
- 5.2. Distributors & Wholesalers
- 5.3. Online
Ceramic Solutions Segmentation By Geography
-
1. North America
- 1.1. United States
- 1.2. Canada
- 1.3. Mexico
-
2. South America
- 2.1. Brazil
- 2.2. Argentina
- 2.3. Rest of South America
-
3. Europe
- 3.1. United Kingdom
- 3.2. Germany
- 3.3. France
- 3.4. Italy
- 3.5. Spain
- 3.6. Russia
- 3.7. Benelux
- 3.8. Nordics
- 3.9. Rest of Europe
-
4. Middle East & Africa
- 4.1. Turkey
- 4.2. Israel
- 4.3. GCC
- 4.4. North Africa
- 4.5. South Africa
- 4.6. Rest of Middle East & Africa
-
5. Asia Pacific
- 5.1. China
- 5.2. India
- 5.3. Japan
- 5.4. South Korea
- 5.5. ASEAN
- 5.6. Oceania
- 5.7. Rest of Asia Pacific
Ceramic Solutions Regional Market Share
Geographic Coverage of Ceramic Solutions
Ceramic Solutions REPORT HIGHLIGHTS
| Aspects | Details |
|---|---|
| Study Period | 2020-2034 |
| Base Year | 2025 |
| Estimated Year | 2026 |
| Forecast Period | 2026-2034 |
| Historical Period | 2020-2025 |
| Growth Rate | CAGR of 3.6% from 2020-2034 |
| Segmentation |
|
Table of Contents
- 1. Introduction
- 1.1. Research Scope
- 1.2. Market Segmentation
- 1.3. Research Objective
- 1.4. Definitions and Assumptions
- 2. Executive Summary
- 2.1. Market Snapshot
- 3. Market Dynamics
- 3.1. Market Drivers
- 3.2. Market Restrains
- 3.3. Market Trends
- 3.4. Market Opportunities
- 4. Market Factor Analysis
- 4.1. Porters Five Forces
- 4.1.1. Bargaining Power of Suppliers
- 4.1.2. Bargaining Power of Buyers
- 4.1.3. Threat of New Entrants
- 4.1.4. Threat of Substitutes
- 4.1.5. Competitive Rivalry
- 4.2. PESTEL analysis
- 4.3. BCG Analysis
- 4.3.1. Stars (High Growth, High Market Share)
- 4.3.2. Cash Cows (Low Growth, High Market Share)
- 4.3.3. Question Mark (High Growth, Low Market Share)
- 4.3.4. Dogs (Low Growth, Low Market Share)
- 4.4. Ansoff Matrix Analysis
- 4.5. Supply Chain Analysis
- 4.6. Regulatory Landscape
- 4.7. Current Market Potential and Opportunity Assessment (TAM–SAM–SOM Framework)
- 4.8. NRP Analyst Note
- 4.1. Porters Five Forces
- 5. Market Analysis, Insights and Forecast 2021-2033
- 5.1. Market Analysis, Insights and Forecast - by Product Type
- 5.1.1. Monolithic Ceramics
- 5.1.2. Ceramic Coatings
- 5.1.3. Ceramic Matrix Composites
- 5.1.4. Ceramic Powders
- 5.2. Market Analysis, Insights and Forecast - by Material Type
- 5.2.1. Alumina
- 5.2.2. Silicon Carbide
- 5.2.3. Zirconia
- 5.3. Market Analysis, Insights and Forecast - by Application
- 5.3.1. Electrical Insulation
- 5.3.2. Thermal Barrier
- 5.3.3. Wear Resistance
- 5.3.4. Corrosion Resistance
- 5.3.5. Others
- 5.4. Market Analysis, Insights and Forecast - by End User Industry
- 5.4.1. Electronics & Semiconductors
- 5.4.2. Automotive
- 5.4.3. Healthcare & Medical
- 5.4.4. Industrial & Machinery
- 5.4.5. Aerospace & Defense
- 5.4.6. Chemical & Petrochemical
- 5.4.7. Others
- 5.5. Market Analysis, Insights and Forecast - by Sales Channel
- 5.5.1. Direct Sales
- 5.5.2. Distributors & Wholesalers
- 5.5.3. Online
- 5.6. Market Analysis, Insights and Forecast - by Region
- 5.6.1. North America
- 5.6.2. South America
- 5.6.3. Europe
- 5.6.4. Middle East & Africa
- 5.6.5. Asia Pacific
- 5.1. Market Analysis, Insights and Forecast - by Product Type
- 6. Global Ceramic Solutions Analysis, Insights and Forecast, 2021-2033
- 6.1. Market Analysis, Insights and Forecast - by Product Type
- 6.1.1. Monolithic Ceramics
- 6.1.2. Ceramic Coatings
- 6.1.3. Ceramic Matrix Composites
- 6.1.4. Ceramic Powders
- 6.2. Market Analysis, Insights and Forecast - by Material Type
- 6.2.1. Alumina
- 6.2.2. Silicon Carbide
- 6.2.3. Zirconia
- 6.3. Market Analysis, Insights and Forecast - by Application
- 6.3.1. Electrical Insulation
- 6.3.2. Thermal Barrier
- 6.3.3. Wear Resistance
- 6.3.4. Corrosion Resistance
- 6.3.5. Others
- 6.4. Market Analysis, Insights and Forecast - by End User Industry
- 6.4.1. Electronics & Semiconductors
- 6.4.2. Automotive
- 6.4.3. Healthcare & Medical
- 6.4.4. Industrial & Machinery
- 6.4.5. Aerospace & Defense
- 6.4.6. Chemical & Petrochemical
- 6.4.7. Others
- 6.5. Market Analysis, Insights and Forecast - by Sales Channel
- 6.5.1. Direct Sales
- 6.5.2. Distributors & Wholesalers
- 6.5.3. Online
- 6.1. Market Analysis, Insights and Forecast - by Product Type
- 7. North America Ceramic Solutions Analysis, Insights and Forecast, 2020-2032
- 7.1. Market Analysis, Insights and Forecast - by Product Type
- 7.1.1. Monolithic Ceramics
- 7.1.2. Ceramic Coatings
- 7.1.3. Ceramic Matrix Composites
- 7.1.4. Ceramic Powders
- 7.2. Market Analysis, Insights and Forecast - by Material Type
- 7.2.1. Alumina
- 7.2.2. Silicon Carbide
- 7.2.3. Zirconia
- 7.3. Market Analysis, Insights and Forecast - by Application
- 7.3.1. Electrical Insulation
- 7.3.2. Thermal Barrier
- 7.3.3. Wear Resistance
- 7.3.4. Corrosion Resistance
- 7.3.5. Others
- 7.4. Market Analysis, Insights and Forecast - by End User Industry
- 7.4.1. Electronics & Semiconductors
- 7.4.2. Automotive
- 7.4.3. Healthcare & Medical
- 7.4.4. Industrial & Machinery
- 7.4.5. Aerospace & Defense
- 7.4.6. Chemical & Petrochemical
- 7.4.7. Others
- 7.5. Market Analysis, Insights and Forecast - by Sales Channel
- 7.5.1. Direct Sales
- 7.5.2. Distributors & Wholesalers
- 7.5.3. Online
- 7.1. Market Analysis, Insights and Forecast - by Product Type
- 8. South America Ceramic Solutions Analysis, Insights and Forecast, 2020-2032
- 8.1. Market Analysis, Insights and Forecast - by Product Type
- 8.1.1. Monolithic Ceramics
- 8.1.2. Ceramic Coatings
- 8.1.3. Ceramic Matrix Composites
- 8.1.4. Ceramic Powders
- 8.2. Market Analysis, Insights and Forecast - by Material Type
- 8.2.1. Alumina
- 8.2.2. Silicon Carbide
- 8.2.3. Zirconia
- 8.3. Market Analysis, Insights and Forecast - by Application
- 8.3.1. Electrical Insulation
- 8.3.2. Thermal Barrier
- 8.3.3. Wear Resistance
- 8.3.4. Corrosion Resistance
- 8.3.5. Others
- 8.4. Market Analysis, Insights and Forecast - by End User Industry
- 8.4.1. Electronics & Semiconductors
- 8.4.2. Automotive
- 8.4.3. Healthcare & Medical
- 8.4.4. Industrial & Machinery
- 8.4.5. Aerospace & Defense
- 8.4.6. Chemical & Petrochemical
- 8.4.7. Others
- 8.5. Market Analysis, Insights and Forecast - by Sales Channel
- 8.5.1. Direct Sales
- 8.5.2. Distributors & Wholesalers
- 8.5.3. Online
- 8.1. Market Analysis, Insights and Forecast - by Product Type
- 9. Europe Ceramic Solutions Analysis, Insights and Forecast, 2020-2032
- 9.1. Market Analysis, Insights and Forecast - by Product Type
- 9.1.1. Monolithic Ceramics
- 9.1.2. Ceramic Coatings
- 9.1.3. Ceramic Matrix Composites
- 9.1.4. Ceramic Powders
- 9.2. Market Analysis, Insights and Forecast - by Material Type
- 9.2.1. Alumina
- 9.2.2. Silicon Carbide
- 9.2.3. Zirconia
- 9.3. Market Analysis, Insights and Forecast - by Application
- 9.3.1. Electrical Insulation
- 9.3.2. Thermal Barrier
- 9.3.3. Wear Resistance
- 9.3.4. Corrosion Resistance
- 9.3.5. Others
- 9.4. Market Analysis, Insights and Forecast - by End User Industry
- 9.4.1. Electronics & Semiconductors
- 9.4.2. Automotive
- 9.4.3. Healthcare & Medical
- 9.4.4. Industrial & Machinery
- 9.4.5. Aerospace & Defense
- 9.4.6. Chemical & Petrochemical
- 9.4.7. Others
- 9.5. Market Analysis, Insights and Forecast - by Sales Channel
- 9.5.1. Direct Sales
- 9.5.2. Distributors & Wholesalers
- 9.5.3. Online
- 9.1. Market Analysis, Insights and Forecast - by Product Type
- 10. Middle East & Africa Ceramic Solutions Analysis, Insights and Forecast, 2020-2032
- 10.1. Market Analysis, Insights and Forecast - by Product Type
- 10.1.1. Monolithic Ceramics
- 10.1.2. Ceramic Coatings
- 10.1.3. Ceramic Matrix Composites
- 10.1.4. Ceramic Powders
- 10.2. Market Analysis, Insights and Forecast - by Material Type
- 10.2.1. Alumina
- 10.2.2. Silicon Carbide
- 10.2.3. Zirconia
- 10.3. Market Analysis, Insights and Forecast - by Application
- 10.3.1. Electrical Insulation
- 10.3.2. Thermal Barrier
- 10.3.3. Wear Resistance
- 10.3.4. Corrosion Resistance
- 10.3.5. Others
- 10.4. Market Analysis, Insights and Forecast - by End User Industry
- 10.4.1. Electronics & Semiconductors
- 10.4.2. Automotive
- 10.4.3. Healthcare & Medical
- 10.4.4. Industrial & Machinery
- 10.4.5. Aerospace & Defense
- 10.4.6. Chemical & Petrochemical
- 10.4.7. Others
- 10.5. Market Analysis, Insights and Forecast - by Sales Channel
- 10.5.1. Direct Sales
- 10.5.2. Distributors & Wholesalers
- 10.5.3. Online
- 10.1. Market Analysis, Insights and Forecast - by Product Type
- 11. Asia Pacific Ceramic Solutions Analysis, Insights and Forecast, 2020-2032
- 11.1. Market Analysis, Insights and Forecast - by Product Type
- 11.1.1. Monolithic Ceramics
- 11.1.2. Ceramic Coatings
- 11.1.3. Ceramic Matrix Composites
- 11.1.4. Ceramic Powders
- 11.2. Market Analysis, Insights and Forecast - by Material Type
- 11.2.1. Alumina
- 11.2.2. Silicon Carbide
- 11.2.3. Zirconia
- 11.3. Market Analysis, Insights and Forecast - by Application
- 11.3.1. Electrical Insulation
- 11.3.2. Thermal Barrier
- 11.3.3. Wear Resistance
- 11.3.4. Corrosion Resistance
- 11.3.5. Others
- 11.4. Market Analysis, Insights and Forecast - by End User Industry
- 11.4.1. Electronics & Semiconductors
- 11.4.2. Automotive
- 11.4.3. Healthcare & Medical
- 11.4.4. Industrial & Machinery
- 11.4.5. Aerospace & Defense
- 11.4.6. Chemical & Petrochemical
- 11.4.7. Others
- 11.5. Market Analysis, Insights and Forecast - by Sales Channel
- 11.5.1. Direct Sales
- 11.5.2. Distributors & Wholesalers
- 11.5.3. Online
- 11.1. Market Analysis, Insights and Forecast - by Product Type
- 12. Competitive Analysis
- 12.1. Company Profiles
- 12.1.1 CoorsTek LLC
- 12.1.1.1. Company Overview
- 12.1.1.2. Products
- 12.1.1.3. Company Financials
- 12.1.1.4. SWOT Analysis
- 12.1.2 Ortech Inc.
- 12.1.2.1. Company Overview
- 12.1.2.2. Products
- 12.1.2.3. Company Financials
- 12.1.2.4. SWOT Analysis
- 12.1.3 Kyocera Corporation
- 12.1.3.1. Company Overview
- 12.1.3.2. Products
- 12.1.3.3. Company Financials
- 12.1.3.4. SWOT Analysis
- 12.1.4 Morgan Advanced Materials PLC
- 12.1.4.1. Company Overview
- 12.1.4.2. Products
- 12.1.4.3. Company Financials
- 12.1.4.4. SWOT Analysis
- 12.1.5 CeramTec GmbH
- 12.1.5.1. Company Overview
- 12.1.5.2. Products
- 12.1.5.3. Company Financials
- 12.1.5.4. SWOT Analysis
- 12.1.6 Saint-Gobain S.A.
- 12.1.6.1. Company Overview
- 12.1.6.2. Products
- 12.1.6.3. Company Financials
- 12.1.6.4. SWOT Analysis
- 12.1.7 3M Company
- 12.1.7.1. Company Overview
- 12.1.7.2. Products
- 12.1.7.3. Company Financials
- 12.1.7.4. SWOT Analysis
- 12.1.8 NGK Insulators Ltd.
- 12.1.8.1. Company Overview
- 12.1.8.2. Products
- 12.1.8.3. Company Financials
- 12.1.8.4. SWOT Analysis
- 12.1.9 SCHOTT AG
- 12.1.9.1. Company Overview
- 12.1.9.2. Products
- 12.1.9.3. Company Financials
- 12.1.9.4. SWOT Analysis
- 12.1.10 Rauschert GmbH & Co. KG
- 12.1.10.1. Company Overview
- 12.1.10.2. Products
- 12.1.10.3. Company Financials
- 12.1.10.4. SWOT Analysis
- 12.1.11 Ibiden Co. Ltd.
- 12.1.11.1. Company Overview
- 12.1.11.2. Products
- 12.1.11.3. Company Financials
- 12.1.11.4. SWOT Analysis
- 12.1.12 Refractron Technologies Corp.
- 12.1.12.1. Company Overview
- 12.1.12.2. Products
- 12.1.12.3. Company Financials
- 12.1.12.4. SWOT Analysis
- 12.1.13 Filtros Ltd.
- 12.1.13.1. Company Overview
- 12.1.13.2. Products
- 12.1.13.3. Company Financials
- 12.1.13.4. SWOT Analysis
- 12.1.14 Elan Technology
- 12.1.14.1. Company Overview
- 12.1.14.2. Products
- 12.1.14.3. Company Financials
- 12.1.14.4. SWOT Analysis
- 12.1.15 CoorsTek Inc.
- 12.1.15.1. Company Overview
- 12.1.15.2. Products
- 12.1.15.3. Company Financials
- 12.1.15.4. SWOT Analysis
- 12.1.16 Blasch Precision Ceramics
- 12.1.16.1. Company Overview
- 12.1.16.2. Products
- 12.1.16.3. Company Financials
- 12.1.16.4. SWOT Analysis
- 12.1.17 AdTech Ceramics Company
- 12.1.17.1. Company Overview
- 12.1.17.2. Products
- 12.1.17.3. Company Financials
- 12.1.17.4. SWOT Analysis
- 12.1.18 Others
- 12.1.18.1. Company Overview
- 12.1.18.2. Products
- 12.1.18.3. Company Financials
- 12.1.18.4. SWOT Analysis
- 12.1.1 CoorsTek LLC
- 12.2. Market Entropy
- 12.2.1 Company's Key Areas Served
- 12.2.2 Recent Developments
- 12.3. Company Market Share Analysis 2025
- 12.3.1 Top 5 Companies Market Share Analysis
- 12.3.2 Top 3 Companies Market Share Analysis
- 12.4. List of Potential Customers
- 13. Research Methodology
List of Figures
- Figure 1: Global Ceramic Solutions Revenue Breakdown (billion, %) by Region 2025 & 2033
- Figure 2: North America Ceramic Solutions Revenue (billion), by Product Type 2025 & 2033
- Figure 3: North America Ceramic Solutions Revenue Share (%), by Product Type 2025 & 2033
- Figure 4: North America Ceramic Solutions Revenue (billion), by Material Type 2025 & 2033
- Figure 5: North America Ceramic Solutions Revenue Share (%), by Material Type 2025 & 2033
- Figure 6: North America Ceramic Solutions Revenue (billion), by Application 2025 & 2033
- Figure 7: North America Ceramic Solutions Revenue Share (%), by Application 2025 & 2033
- Figure 8: North America Ceramic Solutions Revenue (billion), by End User Industry 2025 & 2033
- Figure 9: North America Ceramic Solutions Revenue Share (%), by End User Industry 2025 & 2033
- Figure 10: North America Ceramic Solutions Revenue (billion), by Sales Channel 2025 & 2033
- Figure 11: North America Ceramic Solutions Revenue Share (%), by Sales Channel 2025 & 2033
- Figure 12: North America Ceramic Solutions Revenue (billion), by Country 2025 & 2033
- Figure 13: North America Ceramic Solutions Revenue Share (%), by Country 2025 & 2033
- Figure 14: South America Ceramic Solutions Revenue (billion), by Product Type 2025 & 2033
- Figure 15: South America Ceramic Solutions Revenue Share (%), by Product Type 2025 & 2033
- Figure 16: South America Ceramic Solutions Revenue (billion), by Material Type 2025 & 2033
- Figure 17: South America Ceramic Solutions Revenue Share (%), by Material Type 2025 & 2033
- Figure 18: South America Ceramic Solutions Revenue (billion), by Application 2025 & 2033
- Figure 19: South America Ceramic Solutions Revenue Share (%), by Application 2025 & 2033
- Figure 20: South America Ceramic Solutions Revenue (billion), by End User Industry 2025 & 2033
- Figure 21: South America Ceramic Solutions Revenue Share (%), by End User Industry 2025 & 2033
- Figure 22: South America Ceramic Solutions Revenue (billion), by Sales Channel 2025 & 2033
- Figure 23: South America Ceramic Solutions Revenue Share (%), by Sales Channel 2025 & 2033
- Figure 24: South America Ceramic Solutions Revenue (billion), by Country 2025 & 2033
- Figure 25: South America Ceramic Solutions Revenue Share (%), by Country 2025 & 2033
- Figure 26: Europe Ceramic Solutions Revenue (billion), by Product Type 2025 & 2033
- Figure 27: Europe Ceramic Solutions Revenue Share (%), by Product Type 2025 & 2033
- Figure 28: Europe Ceramic Solutions Revenue (billion), by Material Type 2025 & 2033
- Figure 29: Europe Ceramic Solutions Revenue Share (%), by Material Type 2025 & 2033
- Figure 30: Europe Ceramic Solutions Revenue (billion), by Application 2025 & 2033
- Figure 31: Europe Ceramic Solutions Revenue Share (%), by Application 2025 & 2033
- Figure 32: Europe Ceramic Solutions Revenue (billion), by End User Industry 2025 & 2033
- Figure 33: Europe Ceramic Solutions Revenue Share (%), by End User Industry 2025 & 2033
- Figure 34: Europe Ceramic Solutions Revenue (billion), by Sales Channel 2025 & 2033
- Figure 35: Europe Ceramic Solutions Revenue Share (%), by Sales Channel 2025 & 2033
- Figure 36: Europe Ceramic Solutions Revenue (billion), by Country 2025 & 2033
- Figure 37: Europe Ceramic Solutions Revenue Share (%), by Country 2025 & 2033
- Figure 38: Middle East & Africa Ceramic Solutions Revenue (billion), by Product Type 2025 & 2033
- Figure 39: Middle East & Africa Ceramic Solutions Revenue Share (%), by Product Type 2025 & 2033
- Figure 40: Middle East & Africa Ceramic Solutions Revenue (billion), by Material Type 2025 & 2033
- Figure 41: Middle East & Africa Ceramic Solutions Revenue Share (%), by Material Type 2025 & 2033
- Figure 42: Middle East & Africa Ceramic Solutions Revenue (billion), by Application 2025 & 2033
- Figure 43: Middle East & Africa Ceramic Solutions Revenue Share (%), by Application 2025 & 2033
- Figure 44: Middle East & Africa Ceramic Solutions Revenue (billion), by End User Industry 2025 & 2033
- Figure 45: Middle East & Africa Ceramic Solutions Revenue Share (%), by End User Industry 2025 & 2033
- Figure 46: Middle East & Africa Ceramic Solutions Revenue (billion), by Sales Channel 2025 & 2033
- Figure 47: Middle East & Africa Ceramic Solutions Revenue Share (%), by Sales Channel 2025 & 2033
- Figure 48: Middle East & Africa Ceramic Solutions Revenue (billion), by Country 2025 & 2033
- Figure 49: Middle East & Africa Ceramic Solutions Revenue Share (%), by Country 2025 & 2033
- Figure 50: Asia Pacific Ceramic Solutions Revenue (billion), by Product Type 2025 & 2033
- Figure 51: Asia Pacific Ceramic Solutions Revenue Share (%), by Product Type 2025 & 2033
- Figure 52: Asia Pacific Ceramic Solutions Revenue (billion), by Material Type 2025 & 2033
- Figure 53: Asia Pacific Ceramic Solutions Revenue Share (%), by Material Type 2025 & 2033
- Figure 54: Asia Pacific Ceramic Solutions Revenue (billion), by Application 2025 & 2033
- Figure 55: Asia Pacific Ceramic Solutions Revenue Share (%), by Application 2025 & 2033
- Figure 56: Asia Pacific Ceramic Solutions Revenue (billion), by End User Industry 2025 & 2033
- Figure 57: Asia Pacific Ceramic Solutions Revenue Share (%), by End User Industry 2025 & 2033
- Figure 58: Asia Pacific Ceramic Solutions Revenue (billion), by Sales Channel 2025 & 2033
- Figure 59: Asia Pacific Ceramic Solutions Revenue Share (%), by Sales Channel 2025 & 2033
- Figure 60: Asia Pacific Ceramic Solutions Revenue (billion), by Country 2025 & 2033
- Figure 61: Asia Pacific Ceramic Solutions Revenue Share (%), by Country 2025 & 2033
List of Tables
- Table 1: Global Ceramic Solutions Revenue billion Forecast, by Product Type 2020 & 2033
- Table 2: Global Ceramic Solutions Revenue billion Forecast, by Material Type 2020 & 2033
- Table 3: Global Ceramic Solutions Revenue billion Forecast, by Application 2020 & 2033
- Table 4: Global Ceramic Solutions Revenue billion Forecast, by End User Industry 2020 & 2033
- Table 5: Global Ceramic Solutions Revenue billion Forecast, by Sales Channel 2020 & 2033
- Table 6: Global Ceramic Solutions Revenue billion Forecast, by Region 2020 & 2033
- Table 7: Global Ceramic Solutions Revenue billion Forecast, by Product Type 2020 & 2033
- Table 8: Global Ceramic Solutions Revenue billion Forecast, by Material Type 2020 & 2033
- Table 9: Global Ceramic Solutions Revenue billion Forecast, by Application 2020 & 2033
- Table 10: Global Ceramic Solutions Revenue billion Forecast, by End User Industry 2020 & 2033
- Table 11: Global Ceramic Solutions Revenue billion Forecast, by Sales Channel 2020 & 2033
- Table 12: Global Ceramic Solutions Revenue billion Forecast, by Country 2020 & 2033
- Table 13: United States Ceramic Solutions Revenue (billion) Forecast, by Application 2020 & 2033
- Table 14: Canada Ceramic Solutions Revenue (billion) Forecast, by Application 2020 & 2033
- Table 15: Mexico Ceramic Solutions Revenue (billion) Forecast, by Application 2020 & 2033
- Table 16: Global Ceramic Solutions Revenue billion Forecast, by Product Type 2020 & 2033
- Table 17: Global Ceramic Solutions Revenue billion Forecast, by Material Type 2020 & 2033
- Table 18: Global Ceramic Solutions Revenue billion Forecast, by Application 2020 & 2033
- Table 19: Global Ceramic Solutions Revenue billion Forecast, by End User Industry 2020 & 2033
- Table 20: Global Ceramic Solutions Revenue billion Forecast, by Sales Channel 2020 & 2033
- Table 21: Global Ceramic Solutions Revenue billion Forecast, by Country 2020 & 2033
- Table 22: Brazil Ceramic Solutions Revenue (billion) Forecast, by Application 2020 & 2033
- Table 23: Argentina Ceramic Solutions Revenue (billion) Forecast, by Application 2020 & 2033
- Table 24: Rest of South America Ceramic Solutions Revenue (billion) Forecast, by Application 2020 & 2033
- Table 25: Global Ceramic Solutions Revenue billion Forecast, by Product Type 2020 & 2033
- Table 26: Global Ceramic Solutions Revenue billion Forecast, by Material Type 2020 & 2033
- Table 27: Global Ceramic Solutions Revenue billion Forecast, by Application 2020 & 2033
- Table 28: Global Ceramic Solutions Revenue billion Forecast, by End User Industry 2020 & 2033
- Table 29: Global Ceramic Solutions Revenue billion Forecast, by Sales Channel 2020 & 2033
- Table 30: Global Ceramic Solutions Revenue billion Forecast, by Country 2020 & 2033
- Table 31: United Kingdom Ceramic Solutions Revenue (billion) Forecast, by Application 2020 & 2033
- Table 32: Germany Ceramic Solutions Revenue (billion) Forecast, by Application 2020 & 2033
- Table 33: France Ceramic Solutions Revenue (billion) Forecast, by Application 2020 & 2033
- Table 34: Italy Ceramic Solutions Revenue (billion) Forecast, by Application 2020 & 2033
- Table 35: Spain Ceramic Solutions Revenue (billion) Forecast, by Application 2020 & 2033
- Table 36: Russia Ceramic Solutions Revenue (billion) Forecast, by Application 2020 & 2033
- Table 37: Benelux Ceramic Solutions Revenue (billion) Forecast, by Application 2020 & 2033
- Table 38: Nordics Ceramic Solutions Revenue (billion) Forecast, by Application 2020 & 2033
- Table 39: Rest of Europe Ceramic Solutions Revenue (billion) Forecast, by Application 2020 & 2033
- Table 40: Global Ceramic Solutions Revenue billion Forecast, by Product Type 2020 & 2033
- Table 41: Global Ceramic Solutions Revenue billion Forecast, by Material Type 2020 & 2033
- Table 42: Global Ceramic Solutions Revenue billion Forecast, by Application 2020 & 2033
- Table 43: Global Ceramic Solutions Revenue billion Forecast, by End User Industry 2020 & 2033
- Table 44: Global Ceramic Solutions Revenue billion Forecast, by Sales Channel 2020 & 2033
- Table 45: Global Ceramic Solutions Revenue billion Forecast, by Country 2020 & 2033
- Table 46: Turkey Ceramic Solutions Revenue (billion) Forecast, by Application 2020 & 2033
- Table 47: Israel Ceramic Solutions Revenue (billion) Forecast, by Application 2020 & 2033
- Table 48: GCC Ceramic Solutions Revenue (billion) Forecast, by Application 2020 & 2033
- Table 49: North Africa Ceramic Solutions Revenue (billion) Forecast, by Application 2020 & 2033
- Table 50: South Africa Ceramic Solutions Revenue (billion) Forecast, by Application 2020 & 2033
- Table 51: Rest of Middle East & Africa Ceramic Solutions Revenue (billion) Forecast, by Application 2020 & 2033
- Table 52: Global Ceramic Solutions Revenue billion Forecast, by Product Type 2020 & 2033
- Table 53: Global Ceramic Solutions Revenue billion Forecast, by Material Type 2020 & 2033
- Table 54: Global Ceramic Solutions Revenue billion Forecast, by Application 2020 & 2033
- Table 55: Global Ceramic Solutions Revenue billion Forecast, by End User Industry 2020 & 2033
- Table 56: Global Ceramic Solutions Revenue billion Forecast, by Sales Channel 2020 & 2033
- Table 57: Global Ceramic Solutions Revenue billion Forecast, by Country 2020 & 2033
- Table 58: China Ceramic Solutions Revenue (billion) Forecast, by Application 2020 & 2033
- Table 59: India Ceramic Solutions Revenue (billion) Forecast, by Application 2020 & 2033
- Table 60: Japan Ceramic Solutions Revenue (billion) Forecast, by Application 2020 & 2033
- Table 61: South Korea Ceramic Solutions Revenue (billion) Forecast, by Application 2020 & 2033
- Table 62: ASEAN Ceramic Solutions Revenue (billion) Forecast, by Application 2020 & 2033
- Table 63: Oceania Ceramic Solutions Revenue (billion) Forecast, by Application 2020 & 2033
- Table 64: Rest of Asia Pacific Ceramic Solutions Revenue (billion) Forecast, by Application 2020 & 2033
Frequently Asked Questions
1. What is the projected Compound Annual Growth Rate (CAGR) of the Ceramic Solutions?
The projected CAGR is approximately 3.6%.
2. Which companies are prominent players in the Ceramic Solutions?
Key companies in the market include CoorsTek, LLC, Ortech, Inc., Kyocera Corporation, Morgan Advanced Materials PLC, CeramTec GmbH, Saint-Gobain S.A., 3M Company, NGK Insulators, Ltd., SCHOTT AG, Rauschert GmbH & Co. KG, Ibiden Co., Ltd., Refractron Technologies Corp., Filtros, Ltd., Elan Technology, CoorsTek, Inc., Blasch Precision Ceramics, AdTech Ceramics Company, Others.
3. What are the main segments of the Ceramic Solutions?
The market segments include Product Type, Material Type, Application, End User Industry, Sales Channel.
4. Can you provide details about the market size?
The market size is estimated to be USD 119.44 billion as of 2022.
5. What are some drivers contributing to market growth?
N/A
6. What are the notable trends driving market growth?
N/A
7. Are there any restraints impacting market growth?
N/A
8. Can you provide examples of recent developments in the market?
N/A
9. What pricing options are available for accessing the report?
Pricing options include single-user, multi-user, and enterprise licenses priced at USD 4350.00, USD 6525.00, and USD 8700.00 respectively.
10. Is the market size provided in terms of value or volume?
The market size is provided in terms of value, measured in billion.
11. Are there any specific market keywords associated with the report?
Yes, the market keyword associated with the report is "Ceramic Solutions," which aids in identifying and referencing the specific market segment covered.
12. How do I determine which pricing option suits my needs best?
The pricing options vary based on user requirements and access needs. Individual users may opt for single-user licenses, while businesses requiring broader access may choose multi-user or enterprise licenses for cost-effective access to the report.
13. Are there any additional resources or data provided in the Ceramic Solutions report?
While the report offers comprehensive insights, it's advisable to review the specific contents or supplementary materials provided to ascertain if additional resources or data are available.
14. How can I stay updated on further developments or reports in the Ceramic Solutions?
To stay informed about further developments, trends, and reports in the Ceramic Solutions, consider subscribing to industry newsletters, following relevant companies and organizations, or regularly checking reputable industry news sources and publications.
Methodology
Step 1 - Identification of Relevant Samples Size from Population Database


Step 2 - Approaches for Defining Global Market Size (Value, Volume* & Price*)

Note*: In applicable scenarios
Step 3 - Data Sources
Primary Research
- Web Analytics
- Survey Reports
- Research Institute
- Latest Research Reports
- Opinion Leaders
Secondary Research
- Annual Reports
- White Paper
- Latest Press Release
- Industry Association
- Paid Database
- Investor Presentations

Step 4 - Data Triangulation
Involves using different sources of information in order to increase the validity of a study
These sources are likely to be stakeholders in a program - participants, other researchers, program staff, other community members, and so on.
Then we put all data in single framework & apply various statistical tools to find out the dynamic on the market.
During the analysis stage, feedback from the stakeholder groups would be compared to determine areas of agreement as well as areas of divergence