

Key Insights
The confined space monitoring system market is experiencing robust growth, driven by increasing awareness of workplace safety regulations and a rising number of industrial accidents in confined spaces. The market's expansion is fueled by several key factors, including the escalating demand for advanced monitoring technologies across various sectors like oil and gas, construction, and manufacturing. These sectors are increasingly adopting sophisticated systems to mitigate risks associated with hazardous environments. Furthermore, technological advancements in sensor technology, wireless communication, and data analytics are contributing to the development of more efficient and reliable monitoring systems, attracting significant investment and driving innovation. The market is segmented by technology type (gas detection, temperature monitoring, etc.), application (oil & gas, construction, etc.), and region. Competitive pressures are evident, with established players like Total Safety, Dräger, and RAE Systems vying for market share alongside emerging innovative companies. However, high initial investment costs and the need for skilled personnel to operate and maintain the systems pose challenges to market penetration, particularly in smaller companies. Despite these restraints, the long-term outlook for the confined space monitoring system market remains positive, with a projected Compound Annual Growth Rate (CAGR) likely exceeding 5% over the next decade.
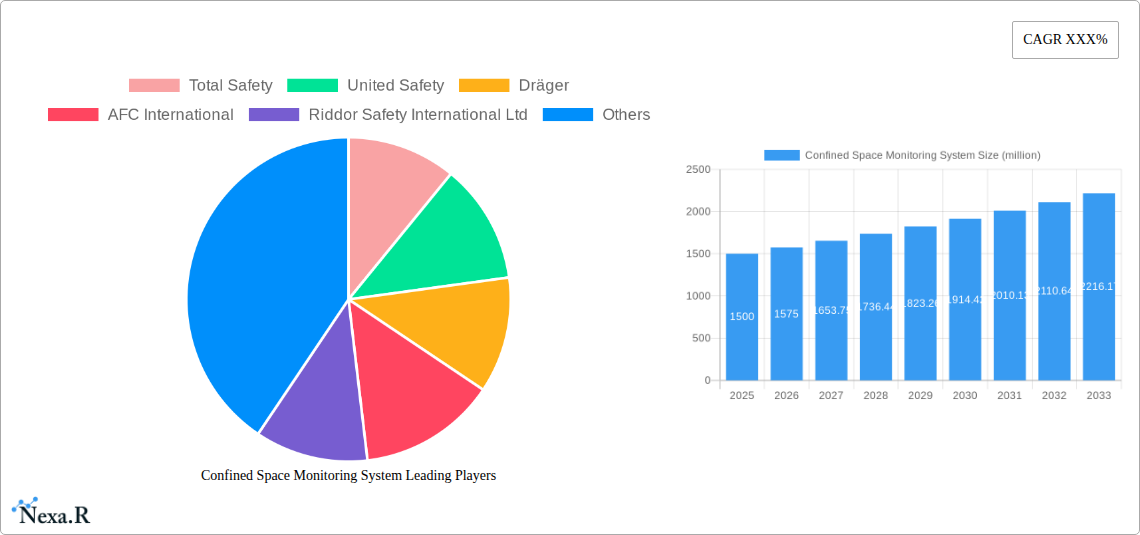
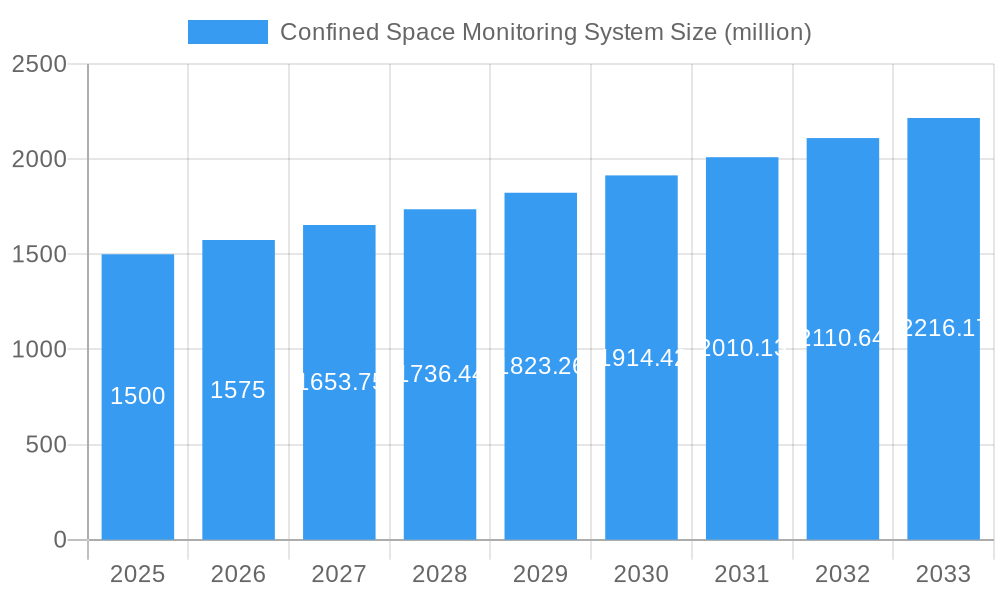
Confined Space Monitoring System Market Size (In Billion)
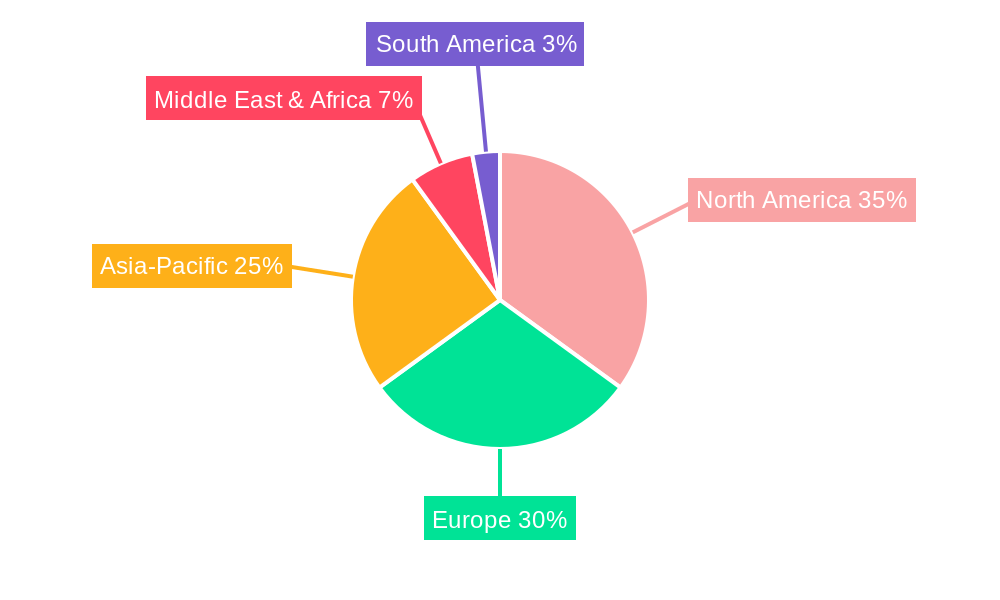
The market's growth is geographically diverse, with North America and Europe currently dominating, owing to stringent safety regulations and a higher adoption rate of advanced technologies. However, rapidly developing economies in Asia-Pacific and the Middle East are expected to witness significant growth in the coming years, driven by infrastructure development and industrialization. This presents lucrative opportunities for market participants to expand their operations and cater to the increasing demand. Future growth will depend on factors such as the continuous development of improved sensor technologies, the integration of artificial intelligence (AI) and machine learning (ML) for predictive maintenance and enhanced risk assessment, and the increasing availability of affordable and user-friendly systems suitable for smaller businesses. The focus will remain on enhancing safety standards and reducing fatalities within confined spaces, fueling sustained market expansion.
Confined Space Monitoring System Company Market Share
Confined Space Monitoring System Market Report: 2019-2033
This comprehensive report provides a detailed analysis of the Confined Space Monitoring System market, encompassing market dynamics, growth trends, regional dominance, product landscape, challenges, opportunities, and key players. The study period spans from 2019 to 2033, with a base year of 2025 and a forecast period of 2025-2033. The report leverages extensive primary and secondary research to deliver actionable insights for industry professionals, investors, and stakeholders. The total market size is projected to reach xx million by 2033.
Confined Space Monitoring System Market Dynamics & Structure
The Confined Space Monitoring System market is characterized by a moderately concentrated landscape, with key players like Total Safety, United Safety, Dräger, and RAE Systems holding significant market share. Technological innovation, driven by advancements in sensor technology, wireless communication, and data analytics, is a major growth driver. Stringent safety regulations across various industries (oil & gas, construction, manufacturing) are further propelling market expansion. The market faces competition from alternative safety solutions, but the increasing awareness of confined space hazards fuels demand for sophisticated monitoring systems. Mergers and acquisitions (M&A) activity is moderate, with companies strategically expanding their product portfolios and geographical reach. The parent market is industrial safety equipment, while the child market is gas detection and monitoring.
- Market Concentration: Moderately concentrated, with top 5 players holding approximately xx% market share in 2025.
- Technological Innovation: Advancements in sensor technology (e.g., multi-gas detection, IoT integration) are key drivers.
- Regulatory Landscape: Stringent safety regulations across industries mandate the use of confined space monitoring systems.
- Competitive Substitutes: Alternative safety measures, such as manual monitoring, exist but are less efficient and pose higher risks.
- End-User Demographics: Primarily industrial sectors (oil & gas, construction, manufacturing) are the key end-users.
- M&A Activity: Moderate M&A activity, primarily focused on expanding product portfolios and market penetration. Estimated xx deals between 2019-2024.
Confined Space Monitoring System Growth Trends & Insights
The Confined Space Monitoring System market experienced robust growth during the historical period (2019-2024), driven by increasing awareness of occupational safety and rising industrial activity. The market size is estimated at xx million in 2025 and is projected to grow at a CAGR of xx% during the forecast period (2025-2033), reaching xx million by 2033. Technological disruptions, such as the integration of IoT and AI, are enhancing system capabilities and driving adoption rates. Consumer behavior shifts towards enhanced safety protocols are further fueling market demand. Market penetration is expected to increase significantly across various industries in developing economies.
Dominant Regions, Countries, or Segments in Confined Space Monitoring System
North America currently holds the largest market share due to stringent safety regulations and a well-established industrial base. Europe follows closely, driven by robust industrial activity and a focus on worker safety. The Asia-Pacific region is expected to witness significant growth in the forecast period, fueled by rapid industrialization and increasing infrastructure development. Within segments, the demand for multi-gas detection systems is highest, owing to their versatility and comprehensive monitoring capabilities.
- Key Drivers: Stringent safety regulations, robust industrial activity, rising infrastructure spending, and increasing worker safety awareness.
- North America Dominance: High regulatory compliance and established industrial sectors drive strong demand.
- Asia-Pacific Growth Potential: Rapid industrialization and economic growth in countries like China and India are fueling market expansion.
- Europe Market Maturity: Established industrial base and strong focus on worker safety contribute to sustained market growth.
Confined Space Monitoring System Product Landscape
The market offers a range of products, including single-gas detectors, multi-gas detectors, fixed monitoring systems, and portable monitoring systems. Recent innovations focus on improved sensor accuracy, wireless connectivity, real-time data analysis, and user-friendly interfaces. Key selling propositions include enhanced safety features, remote monitoring capabilities, and data logging for compliance reporting. Advancements in IoT and AI integration are transforming monitoring systems into smart solutions that provide predictive maintenance and hazard alerts.
Key Drivers, Barriers & Challenges in Confined Space Monitoring System
Key Drivers:
- Increasing awareness of confined space hazards and their associated risks.
- Stringent government regulations mandating the use of monitoring systems.
- Technological advancements in sensor technology and data analytics.
- Rising industrial activity across various sectors.
Key Barriers & Challenges:
- High initial investment costs associated with sophisticated monitoring systems.
- Complexity of installation and maintenance for certain systems.
- Potential for false alarms and system malfunctions.
- Supply chain disruptions impacting the availability of components. This led to a xx% decrease in production in Q3 2022.
Emerging Opportunities in Confined Space Monitoring System
- Expansion into untapped markets, particularly in developing economies.
- Development of integrated safety solutions combining monitoring with other safety equipment.
- Growing demand for cloud-based data management and analysis platforms.
- Increased focus on worker training and education programs.
Growth Accelerators in the Confined Space Monitoring System Industry
Technological breakthroughs in sensor technology, AI, and IoT will drive market expansion. Strategic partnerships between equipment manufacturers and software providers will create integrated solutions. Market expansion into emerging economies, driven by industrial growth and regulatory changes, offers substantial growth potential.
Key Players Shaping the Confined Space Monitoring System Market
- Total Safety
- United Safety
- Dräger
- AFC International
- Riddor Safety International Ltd
- TES
- RAE Systems
- Gastech
- Innova
Notable Milestones in Confined Space Monitoring System Sector
- 2020: Introduction of several IoT-enabled monitoring systems by key players.
- 2021: Increased focus on integrating AI for predictive maintenance and hazard detection.
- 2022: Several mergers and acquisitions to strengthen market positions.
- 2023: Launch of advanced multi-gas detection systems with improved accuracy and functionality.
In-Depth Confined Space Monitoring System Market Outlook
The Confined Space Monitoring System market is poised for continued robust growth, driven by technological innovation, regulatory compliance, and rising industrial activity. Strategic investments in R&D, strategic partnerships, and expansion into emerging markets will be crucial for companies to capitalize on the significant growth potential in the coming years. The market's future is bright, with a projected value of xx million by 2033.
Confined Space Monitoring System Segmentation
-
1. Application
- 1.1. Mining
- 1.2. Petroleum and Natural Gas
- 1.3. Industrial Maintenance
- 1.4. Others
-
2. Type
- 2.1. Centralized Monitoring System
- 2.2. Distributed Monitoring System
Confined Space Monitoring System Segmentation By Geography
-
1. North America
- 1.1. United States
- 1.2. Canada
- 1.3. Mexico
-
2. South America
- 2.1. Brazil
- 2.2. Argentina
- 2.3. Rest of South America
-
3. Europe
- 3.1. United Kingdom
- 3.2. Germany
- 3.3. France
- 3.4. Italy
- 3.5. Spain
- 3.6. Russia
- 3.7. Benelux
- 3.8. Nordics
- 3.9. Rest of Europe
-
4. Middle East & Africa
- 4.1. Turkey
- 4.2. Israel
- 4.3. GCC
- 4.4. North Africa
- 4.5. South Africa
- 4.6. Rest of Middle East & Africa
-
5. Asia Pacific
- 5.1. China
- 5.2. India
- 5.3. Japan
- 5.4. South Korea
- 5.5. ASEAN
- 5.6. Oceania
- 5.7. Rest of Asia Pacific
Confined Space Monitoring System Regional Market Share
Geographic Coverage of Confined Space Monitoring System
Confined Space Monitoring System REPORT HIGHLIGHTS
| Aspects | Details |
|---|---|
| Study Period | 2020-2034 |
| Base Year | 2025 |
| Estimated Year | 2026 |
| Forecast Period | 2026-2034 |
| Historical Period | 2020-2025 |
| Growth Rate | CAGR of 7.6% from 2020-2034 |
| Segmentation |
|
Table of Contents
- 1. Introduction
- 1.1. Research Scope
- 1.2. Market Segmentation
- 1.3. Research Objective
- 1.4. Definitions and Assumptions
- 2. Executive Summary
- 2.1. Market Snapshot
- 3. Market Dynamics
- 3.1. Market Drivers
- 3.2. Market Restrains
- 3.3. Market Trends
- 3.4. Market Opportunities
- 4. Market Factor Analysis
- 4.1. Porters Five Forces
- 4.1.1. Bargaining Power of Suppliers
- 4.1.2. Bargaining Power of Buyers
- 4.1.3. Threat of New Entrants
- 4.1.4. Threat of Substitutes
- 4.1.5. Competitive Rivalry
- 4.2. PESTEL analysis
- 4.3. BCG Analysis
- 4.3.1. Stars (High Growth, High Market Share)
- 4.3.2. Cash Cows (Low Growth, High Market Share)
- 4.3.3. Question Mark (High Growth, Low Market Share)
- 4.3.4. Dogs (Low Growth, Low Market Share)
- 4.4. Ansoff Matrix Analysis
- 4.5. Supply Chain Analysis
- 4.6. Regulatory Landscape
- 4.7. Current Market Potential and Opportunity Assessment (TAM–SAM–SOM Framework)
- 4.8. NRP Analyst Note
- 4.1. Porters Five Forces
- 5. Market Analysis, Insights and Forecast 2021-2033
- 5.1. Market Analysis, Insights and Forecast - by Application
- 5.1.1. Mining
- 5.1.2. Petroleum and Natural Gas
- 5.1.3. Industrial Maintenance
- 5.1.4. Others
- 5.2. Market Analysis, Insights and Forecast - by Type
- 5.2.1. Centralized Monitoring System
- 5.2.2. Distributed Monitoring System
- 5.3. Market Analysis, Insights and Forecast - by Region
- 5.3.1. North America
- 5.3.2. South America
- 5.3.3. Europe
- 5.3.4. Middle East & Africa
- 5.3.5. Asia Pacific
- 5.1. Market Analysis, Insights and Forecast - by Application
- 6. Global Confined Space Monitoring System Analysis, Insights and Forecast, 2021-2033
- 6.1. Market Analysis, Insights and Forecast - by Application
- 6.1.1. Mining
- 6.1.2. Petroleum and Natural Gas
- 6.1.3. Industrial Maintenance
- 6.1.4. Others
- 6.2. Market Analysis, Insights and Forecast - by Type
- 6.2.1. Centralized Monitoring System
- 6.2.2. Distributed Monitoring System
- 6.1. Market Analysis, Insights and Forecast - by Application
- 7. North America Confined Space Monitoring System Analysis, Insights and Forecast, 2020-2032
- 7.1. Market Analysis, Insights and Forecast - by Application
- 7.1.1. Mining
- 7.1.2. Petroleum and Natural Gas
- 7.1.3. Industrial Maintenance
- 7.1.4. Others
- 7.2. Market Analysis, Insights and Forecast - by Type
- 7.2.1. Centralized Monitoring System
- 7.2.2. Distributed Monitoring System
- 7.1. Market Analysis, Insights and Forecast - by Application
- 8. South America Confined Space Monitoring System Analysis, Insights and Forecast, 2020-2032
- 8.1. Market Analysis, Insights and Forecast - by Application
- 8.1.1. Mining
- 8.1.2. Petroleum and Natural Gas
- 8.1.3. Industrial Maintenance
- 8.1.4. Others
- 8.2. Market Analysis, Insights and Forecast - by Type
- 8.2.1. Centralized Monitoring System
- 8.2.2. Distributed Monitoring System
- 8.1. Market Analysis, Insights and Forecast - by Application
- 9. Europe Confined Space Monitoring System Analysis, Insights and Forecast, 2020-2032
- 9.1. Market Analysis, Insights and Forecast - by Application
- 9.1.1. Mining
- 9.1.2. Petroleum and Natural Gas
- 9.1.3. Industrial Maintenance
- 9.1.4. Others
- 9.2. Market Analysis, Insights and Forecast - by Type
- 9.2.1. Centralized Monitoring System
- 9.2.2. Distributed Monitoring System
- 9.1. Market Analysis, Insights and Forecast - by Application
- 10. Middle East & Africa Confined Space Monitoring System Analysis, Insights and Forecast, 2020-2032
- 10.1. Market Analysis, Insights and Forecast - by Application
- 10.1.1. Mining
- 10.1.2. Petroleum and Natural Gas
- 10.1.3. Industrial Maintenance
- 10.1.4. Others
- 10.2. Market Analysis, Insights and Forecast - by Type
- 10.2.1. Centralized Monitoring System
- 10.2.2. Distributed Monitoring System
- 10.1. Market Analysis, Insights and Forecast - by Application
- 11. Asia Pacific Confined Space Monitoring System Analysis, Insights and Forecast, 2020-2032
- 11.1. Market Analysis, Insights and Forecast - by Application
- 11.1.1. Mining
- 11.1.2. Petroleum and Natural Gas
- 11.1.3. Industrial Maintenance
- 11.1.4. Others
- 11.2. Market Analysis, Insights and Forecast - by Type
- 11.2.1. Centralized Monitoring System
- 11.2.2. Distributed Monitoring System
- 11.1. Market Analysis, Insights and Forecast - by Application
- 12. Competitive Analysis
- 12.1. Company Profiles
- 12.1.1 Total Safety
- 12.1.1.1. Company Overview
- 12.1.1.2. Products
- 12.1.1.3. Company Financials
- 12.1.1.4. SWOT Analysis
- 12.1.2 United Safety
- 12.1.2.1. Company Overview
- 12.1.2.2. Products
- 12.1.2.3. Company Financials
- 12.1.2.4. SWOT Analysis
- 12.1.3 Dräger
- 12.1.3.1. Company Overview
- 12.1.3.2. Products
- 12.1.3.3. Company Financials
- 12.1.3.4. SWOT Analysis
- 12.1.4 AFC International
- 12.1.4.1. Company Overview
- 12.1.4.2. Products
- 12.1.4.3. Company Financials
- 12.1.4.4. SWOT Analysis
- 12.1.5 Riddor Safety International Ltd
- 12.1.5.1. Company Overview
- 12.1.5.2. Products
- 12.1.5.3. Company Financials
- 12.1.5.4. SWOT Analysis
- 12.1.6 TES
- 12.1.6.1. Company Overview
- 12.1.6.2. Products
- 12.1.6.3. Company Financials
- 12.1.6.4. SWOT Analysis
- 12.1.7 RAE Systems
- 12.1.7.1. Company Overview
- 12.1.7.2. Products
- 12.1.7.3. Company Financials
- 12.1.7.4. SWOT Analysis
- 12.1.8 Gastech
- 12.1.8.1. Company Overview
- 12.1.8.2. Products
- 12.1.8.3. Company Financials
- 12.1.8.4. SWOT Analysis
- 12.1.9 Innova
- 12.1.9.1. Company Overview
- 12.1.9.2. Products
- 12.1.9.3. Company Financials
- 12.1.9.4. SWOT Analysis
- 12.1.1 Total Safety
- 12.2. Market Entropy
- 12.2.1 Company's Key Areas Served
- 12.2.2 Recent Developments
- 12.3. Company Market Share Analysis 2025
- 12.3.1 Top 5 Companies Market Share Analysis
- 12.3.2 Top 3 Companies Market Share Analysis
- 12.4. List of Potential Customers
- 13. Research Methodology
List of Figures
- Figure 1: Global Confined Space Monitoring System Revenue Breakdown (billion, %) by Region 2025 & 2033
- Figure 2: Global Confined Space Monitoring System Volume Breakdown (K, %) by Region 2025 & 2033
- Figure 3: North America Confined Space Monitoring System Revenue (billion), by Application 2025 & 2033
- Figure 4: North America Confined Space Monitoring System Volume (K), by Application 2025 & 2033
- Figure 5: North America Confined Space Monitoring System Revenue Share (%), by Application 2025 & 2033
- Figure 6: North America Confined Space Monitoring System Volume Share (%), by Application 2025 & 2033
- Figure 7: North America Confined Space Monitoring System Revenue (billion), by Type 2025 & 2033
- Figure 8: North America Confined Space Monitoring System Volume (K), by Type 2025 & 2033
- Figure 9: North America Confined Space Monitoring System Revenue Share (%), by Type 2025 & 2033
- Figure 10: North America Confined Space Monitoring System Volume Share (%), by Type 2025 & 2033
- Figure 11: North America Confined Space Monitoring System Revenue (billion), by Country 2025 & 2033
- Figure 12: North America Confined Space Monitoring System Volume (K), by Country 2025 & 2033
- Figure 13: North America Confined Space Monitoring System Revenue Share (%), by Country 2025 & 2033
- Figure 14: North America Confined Space Monitoring System Volume Share (%), by Country 2025 & 2033
- Figure 15: South America Confined Space Monitoring System Revenue (billion), by Application 2025 & 2033
- Figure 16: South America Confined Space Monitoring System Volume (K), by Application 2025 & 2033
- Figure 17: South America Confined Space Monitoring System Revenue Share (%), by Application 2025 & 2033
- Figure 18: South America Confined Space Monitoring System Volume Share (%), by Application 2025 & 2033
- Figure 19: South America Confined Space Monitoring System Revenue (billion), by Type 2025 & 2033
- Figure 20: South America Confined Space Monitoring System Volume (K), by Type 2025 & 2033
- Figure 21: South America Confined Space Monitoring System Revenue Share (%), by Type 2025 & 2033
- Figure 22: South America Confined Space Monitoring System Volume Share (%), by Type 2025 & 2033
- Figure 23: South America Confined Space Monitoring System Revenue (billion), by Country 2025 & 2033
- Figure 24: South America Confined Space Monitoring System Volume (K), by Country 2025 & 2033
- Figure 25: South America Confined Space Monitoring System Revenue Share (%), by Country 2025 & 2033
- Figure 26: South America Confined Space Monitoring System Volume Share (%), by Country 2025 & 2033
- Figure 27: Europe Confined Space Monitoring System Revenue (billion), by Application 2025 & 2033
- Figure 28: Europe Confined Space Monitoring System Volume (K), by Application 2025 & 2033
- Figure 29: Europe Confined Space Monitoring System Revenue Share (%), by Application 2025 & 2033
- Figure 30: Europe Confined Space Monitoring System Volume Share (%), by Application 2025 & 2033
- Figure 31: Europe Confined Space Monitoring System Revenue (billion), by Type 2025 & 2033
- Figure 32: Europe Confined Space Monitoring System Volume (K), by Type 2025 & 2033
- Figure 33: Europe Confined Space Monitoring System Revenue Share (%), by Type 2025 & 2033
- Figure 34: Europe Confined Space Monitoring System Volume Share (%), by Type 2025 & 2033
- Figure 35: Europe Confined Space Monitoring System Revenue (billion), by Country 2025 & 2033
- Figure 36: Europe Confined Space Monitoring System Volume (K), by Country 2025 & 2033
- Figure 37: Europe Confined Space Monitoring System Revenue Share (%), by Country 2025 & 2033
- Figure 38: Europe Confined Space Monitoring System Volume Share (%), by Country 2025 & 2033
- Figure 39: Middle East & Africa Confined Space Monitoring System Revenue (billion), by Application 2025 & 2033
- Figure 40: Middle East & Africa Confined Space Monitoring System Volume (K), by Application 2025 & 2033
- Figure 41: Middle East & Africa Confined Space Monitoring System Revenue Share (%), by Application 2025 & 2033
- Figure 42: Middle East & Africa Confined Space Monitoring System Volume Share (%), by Application 2025 & 2033
- Figure 43: Middle East & Africa Confined Space Monitoring System Revenue (billion), by Type 2025 & 2033
- Figure 44: Middle East & Africa Confined Space Monitoring System Volume (K), by Type 2025 & 2033
- Figure 45: Middle East & Africa Confined Space Monitoring System Revenue Share (%), by Type 2025 & 2033
- Figure 46: Middle East & Africa Confined Space Monitoring System Volume Share (%), by Type 2025 & 2033
- Figure 47: Middle East & Africa Confined Space Monitoring System Revenue (billion), by Country 2025 & 2033
- Figure 48: Middle East & Africa Confined Space Monitoring System Volume (K), by Country 2025 & 2033
- Figure 49: Middle East & Africa Confined Space Monitoring System Revenue Share (%), by Country 2025 & 2033
- Figure 50: Middle East & Africa Confined Space Monitoring System Volume Share (%), by Country 2025 & 2033
- Figure 51: Asia Pacific Confined Space Monitoring System Revenue (billion), by Application 2025 & 2033
- Figure 52: Asia Pacific Confined Space Monitoring System Volume (K), by Application 2025 & 2033
- Figure 53: Asia Pacific Confined Space Monitoring System Revenue Share (%), by Application 2025 & 2033
- Figure 54: Asia Pacific Confined Space Monitoring System Volume Share (%), by Application 2025 & 2033
- Figure 55: Asia Pacific Confined Space Monitoring System Revenue (billion), by Type 2025 & 2033
- Figure 56: Asia Pacific Confined Space Monitoring System Volume (K), by Type 2025 & 2033
- Figure 57: Asia Pacific Confined Space Monitoring System Revenue Share (%), by Type 2025 & 2033
- Figure 58: Asia Pacific Confined Space Monitoring System Volume Share (%), by Type 2025 & 2033
- Figure 59: Asia Pacific Confined Space Monitoring System Revenue (billion), by Country 2025 & 2033
- Figure 60: Asia Pacific Confined Space Monitoring System Volume (K), by Country 2025 & 2033
- Figure 61: Asia Pacific Confined Space Monitoring System Revenue Share (%), by Country 2025 & 2033
- Figure 62: Asia Pacific Confined Space Monitoring System Volume Share (%), by Country 2025 & 2033
List of Tables
- Table 1: Global Confined Space Monitoring System Revenue billion Forecast, by Application 2020 & 2033
- Table 2: Global Confined Space Monitoring System Volume K Forecast, by Application 2020 & 2033
- Table 3: Global Confined Space Monitoring System Revenue billion Forecast, by Type 2020 & 2033
- Table 4: Global Confined Space Monitoring System Volume K Forecast, by Type 2020 & 2033
- Table 5: Global Confined Space Monitoring System Revenue billion Forecast, by Region 2020 & 2033
- Table 6: Global Confined Space Monitoring System Volume K Forecast, by Region 2020 & 2033
- Table 7: Global Confined Space Monitoring System Revenue billion Forecast, by Application 2020 & 2033
- Table 8: Global Confined Space Monitoring System Volume K Forecast, by Application 2020 & 2033
- Table 9: Global Confined Space Monitoring System Revenue billion Forecast, by Type 2020 & 2033
- Table 10: Global Confined Space Monitoring System Volume K Forecast, by Type 2020 & 2033
- Table 11: Global Confined Space Monitoring System Revenue billion Forecast, by Country 2020 & 2033
- Table 12: Global Confined Space Monitoring System Volume K Forecast, by Country 2020 & 2033
- Table 13: United States Confined Space Monitoring System Revenue (billion) Forecast, by Application 2020 & 2033
- Table 14: United States Confined Space Monitoring System Volume (K) Forecast, by Application 2020 & 2033
- Table 15: Canada Confined Space Monitoring System Revenue (billion) Forecast, by Application 2020 & 2033
- Table 16: Canada Confined Space Monitoring System Volume (K) Forecast, by Application 2020 & 2033
- Table 17: Mexico Confined Space Monitoring System Revenue (billion) Forecast, by Application 2020 & 2033
- Table 18: Mexico Confined Space Monitoring System Volume (K) Forecast, by Application 2020 & 2033
- Table 19: Global Confined Space Monitoring System Revenue billion Forecast, by Application 2020 & 2033
- Table 20: Global Confined Space Monitoring System Volume K Forecast, by Application 2020 & 2033
- Table 21: Global Confined Space Monitoring System Revenue billion Forecast, by Type 2020 & 2033
- Table 22: Global Confined Space Monitoring System Volume K Forecast, by Type 2020 & 2033
- Table 23: Global Confined Space Monitoring System Revenue billion Forecast, by Country 2020 & 2033
- Table 24: Global Confined Space Monitoring System Volume K Forecast, by Country 2020 & 2033
- Table 25: Brazil Confined Space Monitoring System Revenue (billion) Forecast, by Application 2020 & 2033
- Table 26: Brazil Confined Space Monitoring System Volume (K) Forecast, by Application 2020 & 2033
- Table 27: Argentina Confined Space Monitoring System Revenue (billion) Forecast, by Application 2020 & 2033
- Table 28: Argentina Confined Space Monitoring System Volume (K) Forecast, by Application 2020 & 2033
- Table 29: Rest of South America Confined Space Monitoring System Revenue (billion) Forecast, by Application 2020 & 2033
- Table 30: Rest of South America Confined Space Monitoring System Volume (K) Forecast, by Application 2020 & 2033
- Table 31: Global Confined Space Monitoring System Revenue billion Forecast, by Application 2020 & 2033
- Table 32: Global Confined Space Monitoring System Volume K Forecast, by Application 2020 & 2033
- Table 33: Global Confined Space Monitoring System Revenue billion Forecast, by Type 2020 & 2033
- Table 34: Global Confined Space Monitoring System Volume K Forecast, by Type 2020 & 2033
- Table 35: Global Confined Space Monitoring System Revenue billion Forecast, by Country 2020 & 2033
- Table 36: Global Confined Space Monitoring System Volume K Forecast, by Country 2020 & 2033
- Table 37: United Kingdom Confined Space Monitoring System Revenue (billion) Forecast, by Application 2020 & 2033
- Table 38: United Kingdom Confined Space Monitoring System Volume (K) Forecast, by Application 2020 & 2033
- Table 39: Germany Confined Space Monitoring System Revenue (billion) Forecast, by Application 2020 & 2033
- Table 40: Germany Confined Space Monitoring System Volume (K) Forecast, by Application 2020 & 2033
- Table 41: France Confined Space Monitoring System Revenue (billion) Forecast, by Application 2020 & 2033
- Table 42: France Confined Space Monitoring System Volume (K) Forecast, by Application 2020 & 2033
- Table 43: Italy Confined Space Monitoring System Revenue (billion) Forecast, by Application 2020 & 2033
- Table 44: Italy Confined Space Monitoring System Volume (K) Forecast, by Application 2020 & 2033
- Table 45: Spain Confined Space Monitoring System Revenue (billion) Forecast, by Application 2020 & 2033
- Table 46: Spain Confined Space Monitoring System Volume (K) Forecast, by Application 2020 & 2033
- Table 47: Russia Confined Space Monitoring System Revenue (billion) Forecast, by Application 2020 & 2033
- Table 48: Russia Confined Space Monitoring System Volume (K) Forecast, by Application 2020 & 2033
- Table 49: Benelux Confined Space Monitoring System Revenue (billion) Forecast, by Application 2020 & 2033
- Table 50: Benelux Confined Space Monitoring System Volume (K) Forecast, by Application 2020 & 2033
- Table 51: Nordics Confined Space Monitoring System Revenue (billion) Forecast, by Application 2020 & 2033
- Table 52: Nordics Confined Space Monitoring System Volume (K) Forecast, by Application 2020 & 2033
- Table 53: Rest of Europe Confined Space Monitoring System Revenue (billion) Forecast, by Application 2020 & 2033
- Table 54: Rest of Europe Confined Space Monitoring System Volume (K) Forecast, by Application 2020 & 2033
- Table 55: Global Confined Space Monitoring System Revenue billion Forecast, by Application 2020 & 2033
- Table 56: Global Confined Space Monitoring System Volume K Forecast, by Application 2020 & 2033
- Table 57: Global Confined Space Monitoring System Revenue billion Forecast, by Type 2020 & 2033
- Table 58: Global Confined Space Monitoring System Volume K Forecast, by Type 2020 & 2033
- Table 59: Global Confined Space Monitoring System Revenue billion Forecast, by Country 2020 & 2033
- Table 60: Global Confined Space Monitoring System Volume K Forecast, by Country 2020 & 2033
- Table 61: Turkey Confined Space Monitoring System Revenue (billion) Forecast, by Application 2020 & 2033
- Table 62: Turkey Confined Space Monitoring System Volume (K) Forecast, by Application 2020 & 2033
- Table 63: Israel Confined Space Monitoring System Revenue (billion) Forecast, by Application 2020 & 2033
- Table 64: Israel Confined Space Monitoring System Volume (K) Forecast, by Application 2020 & 2033
- Table 65: GCC Confined Space Monitoring System Revenue (billion) Forecast, by Application 2020 & 2033
- Table 66: GCC Confined Space Monitoring System Volume (K) Forecast, by Application 2020 & 2033
- Table 67: North Africa Confined Space Monitoring System Revenue (billion) Forecast, by Application 2020 & 2033
- Table 68: North Africa Confined Space Monitoring System Volume (K) Forecast, by Application 2020 & 2033
- Table 69: South Africa Confined Space Monitoring System Revenue (billion) Forecast, by Application 2020 & 2033
- Table 70: South Africa Confined Space Monitoring System Volume (K) Forecast, by Application 2020 & 2033
- Table 71: Rest of Middle East & Africa Confined Space Monitoring System Revenue (billion) Forecast, by Application 2020 & 2033
- Table 72: Rest of Middle East & Africa Confined Space Monitoring System Volume (K) Forecast, by Application 2020 & 2033
- Table 73: Global Confined Space Monitoring System Revenue billion Forecast, by Application 2020 & 2033
- Table 74: Global Confined Space Monitoring System Volume K Forecast, by Application 2020 & 2033
- Table 75: Global Confined Space Monitoring System Revenue billion Forecast, by Type 2020 & 2033
- Table 76: Global Confined Space Monitoring System Volume K Forecast, by Type 2020 & 2033
- Table 77: Global Confined Space Monitoring System Revenue billion Forecast, by Country 2020 & 2033
- Table 78: Global Confined Space Monitoring System Volume K Forecast, by Country 2020 & 2033
- Table 79: China Confined Space Monitoring System Revenue (billion) Forecast, by Application 2020 & 2033
- Table 80: China Confined Space Monitoring System Volume (K) Forecast, by Application 2020 & 2033
- Table 81: India Confined Space Monitoring System Revenue (billion) Forecast, by Application 2020 & 2033
- Table 82: India Confined Space Monitoring System Volume (K) Forecast, by Application 2020 & 2033
- Table 83: Japan Confined Space Monitoring System Revenue (billion) Forecast, by Application 2020 & 2033
- Table 84: Japan Confined Space Monitoring System Volume (K) Forecast, by Application 2020 & 2033
- Table 85: South Korea Confined Space Monitoring System Revenue (billion) Forecast, by Application 2020 & 2033
- Table 86: South Korea Confined Space Monitoring System Volume (K) Forecast, by Application 2020 & 2033
- Table 87: ASEAN Confined Space Monitoring System Revenue (billion) Forecast, by Application 2020 & 2033
- Table 88: ASEAN Confined Space Monitoring System Volume (K) Forecast, by Application 2020 & 2033
- Table 89: Oceania Confined Space Monitoring System Revenue (billion) Forecast, by Application 2020 & 2033
- Table 90: Oceania Confined Space Monitoring System Volume (K) Forecast, by Application 2020 & 2033
- Table 91: Rest of Asia Pacific Confined Space Monitoring System Revenue (billion) Forecast, by Application 2020 & 2033
- Table 92: Rest of Asia Pacific Confined Space Monitoring System Volume (K) Forecast, by Application 2020 & 2033
Frequently Asked Questions
1. What is the projected Compound Annual Growth Rate (CAGR) of the Confined Space Monitoring System?
The projected CAGR is approximately 7.6%.
2. Which companies are prominent players in the Confined Space Monitoring System?
Key companies in the market include Total Safety, United Safety, Dräger, AFC International, Riddor Safety International Ltd, TES, RAE Systems, Gastech, Innova.
3. What are the main segments of the Confined Space Monitoring System?
The market segments include Application, Type.
4. Can you provide details about the market size?
The market size is estimated to be USD 6.8 billion as of 2022.
5. What are some drivers contributing to market growth?
N/A
6. What are the notable trends driving market growth?
N/A
7. Are there any restraints impacting market growth?
N/A
8. Can you provide examples of recent developments in the market?
N/A
9. What pricing options are available for accessing the report?
Pricing options include single-user, multi-user, and enterprise licenses priced at USD 3950.00, USD 5925.00, and USD 7900.00 respectively.
10. Is the market size provided in terms of value or volume?
The market size is provided in terms of value, measured in billion and volume, measured in K.
11. Are there any specific market keywords associated with the report?
Yes, the market keyword associated with the report is "Confined Space Monitoring System," which aids in identifying and referencing the specific market segment covered.
12. How do I determine which pricing option suits my needs best?
The pricing options vary based on user requirements and access needs. Individual users may opt for single-user licenses, while businesses requiring broader access may choose multi-user or enterprise licenses for cost-effective access to the report.
13. Are there any additional resources or data provided in the Confined Space Monitoring System report?
While the report offers comprehensive insights, it's advisable to review the specific contents or supplementary materials provided to ascertain if additional resources or data are available.
14. How can I stay updated on further developments or reports in the Confined Space Monitoring System?
To stay informed about further developments, trends, and reports in the Confined Space Monitoring System, consider subscribing to industry newsletters, following relevant companies and organizations, or regularly checking reputable industry news sources and publications.
Methodology
Step 1 - Identification of Relevant Samples Size from Population Database


Step 2 - Approaches for Defining Global Market Size (Value, Volume* & Price*)

Note*: In applicable scenarios
Step 3 - Data Sources
Primary Research
- Web Analytics
- Survey Reports
- Research Institute
- Latest Research Reports
- Opinion Leaders
Secondary Research
- Annual Reports
- White Paper
- Latest Press Release
- Industry Association
- Paid Database
- Investor Presentations

Step 4 - Data Triangulation
Involves using different sources of information in order to increase the validity of a study
These sources are likely to be stakeholders in a program - participants, other researchers, program staff, other community members, and so on.
Then we put all data in single framework & apply various statistical tools to find out the dynamic on the market.
During the analysis stage, feedback from the stakeholder groups would be compared to determine areas of agreement as well as areas of divergence