

Key Insights
The global cruise tourism market, valued at $9.44 billion in 2025, is projected to experience robust growth, exhibiting a compound annual growth rate (CAGR) of 8.67% from 2025 to 2033. This expansion is fueled by several key factors. Rising disposable incomes, particularly in emerging economies, are enabling more people to afford luxury travel experiences like cruises. The increasing popularity of experiential travel, coupled with the convenience and all-inclusive nature of cruise packages, further contributes to market growth. Furthermore, cruise lines are constantly innovating, introducing new itineraries, themed cruises catering to specific interests (e.g., adventure cruises, family cruises), and enhanced onboard amenities to attract a broader customer base. The diverse range of cruise options, from short river cruises to extended ocean voyages, caters to varied preferences and budgets, broadening market appeal. However, potential restraints include environmental concerns surrounding cruise ship emissions, the impact of global economic fluctuations on consumer spending, and the vulnerability of the industry to unforeseen events such as pandemics. Market segmentation by passenger age, cruise type, and duration provides valuable insights for targeted marketing strategies and future growth projections. For instance, the 20-39 age group is likely to represent a significant growth segment, while longer durations (15-20 days and above) might see higher revenue generation per passenger.
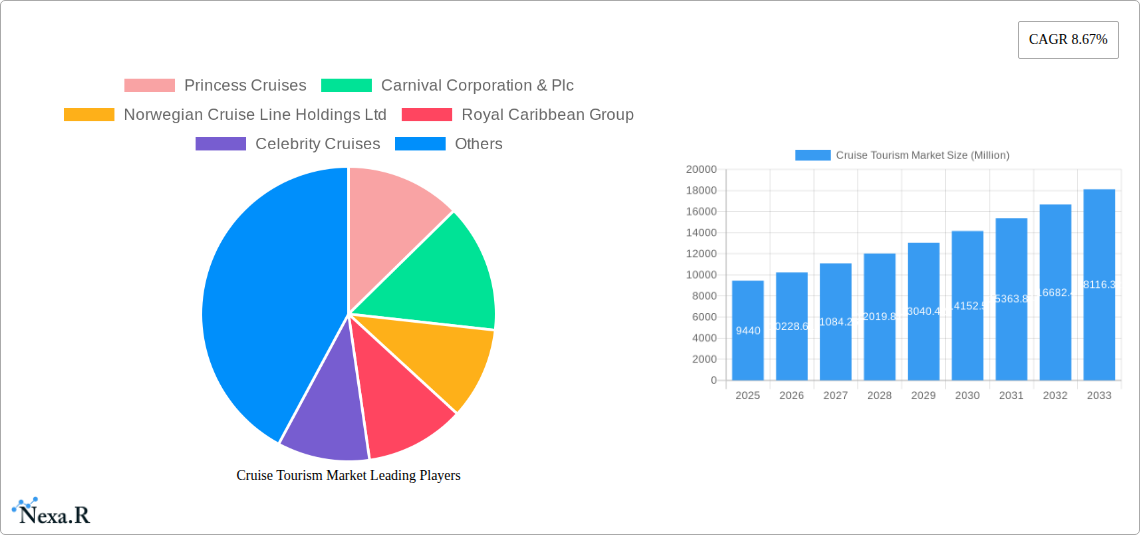
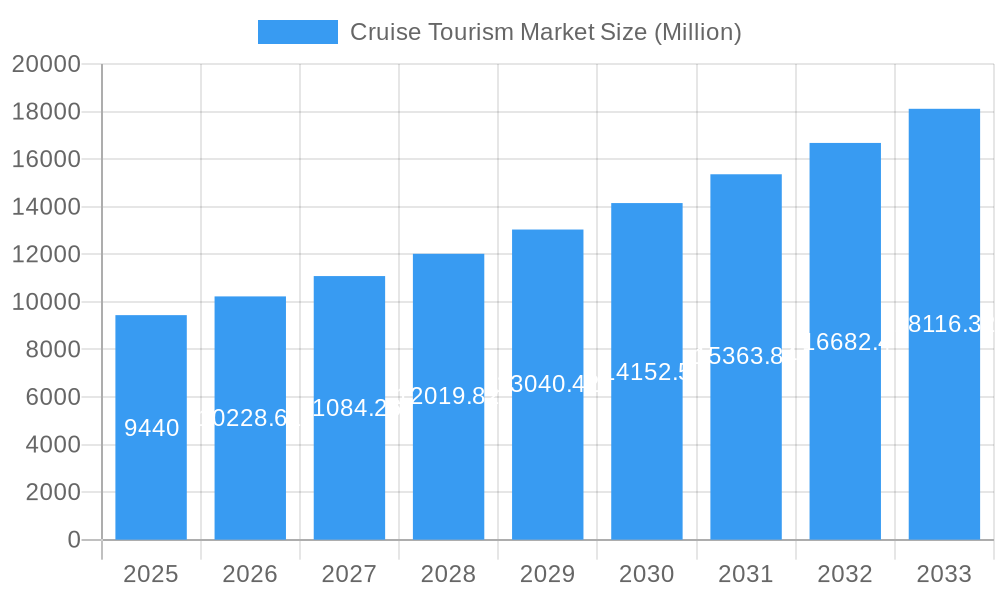
Cruise Tourism Market Market Size (In Billion)
Geographical diversification is another key driver. North America currently holds a significant market share, but regions like Asia-Pacific show considerable growth potential, reflecting the expanding middle class and increased interest in international travel within this region. The competitive landscape is marked by major players like Carnival Corporation, Royal Caribbean Group, and MSC Cruises, who continually strive for market leadership through strategic alliances, expansion into new markets, and investments in fleet modernization. While the industry has demonstrated resilience in overcoming past challenges, sustained growth hinges on addressing environmental concerns responsibly and adapting to evolving traveler expectations for sustainable and immersive travel experiences. Understanding these dynamics is crucial for stakeholders to capitalize on emerging opportunities and navigate potential market risks effectively. Future growth will depend on the cruise industry’s ability to balance profitability with responsible environmental practices, while continuously adapting its offerings to meet the evolving desires of a diverse global clientele.
Cruise Tourism Market Company Market Share
Cruise Tourism Market Report: 2019-2033
This comprehensive report provides an in-depth analysis of the global cruise tourism market, covering the historical period (2019-2024), base year (2025), and forecast period (2025-2033). It delves into market dynamics, growth trends, dominant segments, and key players, offering invaluable insights for industry professionals and investors. The report segments the market by passenger age, cruise type, and duration, providing a granular view of the current landscape and future trajectory. The total market size in 2025 is estimated at xx Million.
Cruise Tourism Market Dynamics & Structure
The cruise tourism market is characterized by moderate concentration, with a few major players holding significant market share. Technological innovation, primarily in areas like digital booking platforms and onboard entertainment, is a key driver. Regulatory frameworks, including safety and environmental regulations, significantly impact operations. Competitive substitutes include other forms of travel, such as land-based vacations and all-inclusive resorts. The end-user demographic is diverse, ranging from families to couples and retirees, with distinct preferences influencing market segmentation. M&A activity has been relatively consistent, with strategic partnerships and acquisitions shaping the market landscape.
- Market Concentration: High, with the top 5 players holding approximately xx% of the market share in 2025.
- Technological Innovation: Focus on enhanced digital experiences, personalized services, and sustainable practices.
- Regulatory Framework: Stringent safety and environmental regulations impacting operational costs and expansion.
- Competitive Substitutes: Land-based tourism, all-inclusive resorts, and other leisure activities.
- End-User Demographics: Diverse age groups and travel preferences driving segment-specific offerings.
- M&A Trends: xx major M&A deals recorded between 2019 and 2024, with a focus on expanding geographic reach and service offerings.
Cruise Tourism Market Growth Trends & Insights
The global cruise tourism market has experienced robust growth over the past few years, fueled by increasing disposable incomes, rising tourism, and a growing preference for experiential travel. The adoption rate of cruise tourism is high in developed economies and is steadily increasing in emerging markets. Technological disruptions, such as the rise of online booking platforms and mobile applications, have streamlined the booking process and enhanced customer experience. Consumer behavior is shifting towards more personalized and sustainable travel options, driving demand for customized itineraries and eco-friendly cruises. The CAGR from 2025 to 2033 is projected to be xx%, with market penetration expected to reach xx% by 2033. The market size is projected to reach xx Million by 2033.
Dominant Regions, Countries, or Segments in Cruise Tourism Market
North America currently holds the largest market share in the cruise tourism market, followed by Europe. Within passenger age segments, the 20-39 and 40-59 year-old demographics drive significant demand. Ocean cruises constitute the largest segment by type, followed by river cruises. Cruises lasting 8-14 days are the most popular in terms of duration. The growth in Asia-Pacific is substantial, driven by rising disposable income and growing tourism interest.
- Key Drivers (North America): Strong domestic tourism, established cruise infrastructure, and high disposable incomes.
- Key Drivers (Europe): Diverse cruise itineraries, rich historical sites, and convenient access to ports.
- Key Drivers (Asia-Pacific): Rapid economic growth, emerging middle class, and increasing interest in cruise tourism.
- Dominant Segments: Ocean cruises (xx% market share in 2025), 20-39 years age group, and 8-14 day cruises.
Cruise Tourism Market Product Landscape
The cruise tourism market offers a diverse range of products, from luxury liners with extensive amenities to budget-friendly options focusing on essential services. Innovations are centered on enhanced onboard experiences, including immersive technology, improved dining options, and unique excursions. Performance metrics focus on customer satisfaction, occupancy rates, and return on investment. Unique selling propositions include personalized itineraries, themed cruises, and sustainable tourism initiatives.
Key Drivers, Barriers & Challenges in Cruise Tourism Market
Key Drivers: Rising disposable incomes, increasing demand for experiential travel, and technological advancements enhancing customer experience. Government support for tourism infrastructure and relaxation of travel visa policies also drive the market forward.
Challenges: Fluctuations in global fuel prices significantly impact operating costs. Stringent environmental regulations increase operational complexities. Geopolitical instability and health crises (like the COVID-19 pandemic) can severely disrupt travel patterns and market stability. Supply chain disruptions can impact the availability of resources and services.
Emerging Opportunities in Cruise Tourism Market
Untapped markets in emerging economies present significant growth potential. The rise of niche tourism, such as adventure cruises and eco-tourism, offers exciting opportunities for specialized service providers. Personalized itineraries and technology-driven experiences are key to enhancing customer satisfaction.
Growth Accelerators in the Cruise Tourism Market Industry
Technological advancements in cruise ship design, navigational systems, and onboard entertainment are driving efficiency and enhancing the overall passenger experience. Strategic partnerships between cruise lines and travel agencies expand market reach and improve distribution channels. Expansion into new markets and the development of sustainable practices enhance profitability and long-term growth.
Key Players Shaping the Cruise Tourism Market Market
- Princess Cruises
- Carnival Corporation & Plc
- Norwegian Cruise Line Holdings Ltd
- Royal Caribbean Group
- Celebrity Cruises
- Costa Cruises
- Holland America Line
- MSC Cruises
- Disney Cruise Line
- Cunard Line (List Not Exhaustive)
Notable Milestones in Cruise Tourism Market Sector
- November 2023: TravClan and Resorts World Cruises partnered to revolutionize cruise tourism in India, focusing on accessibility and affordability.
- October 2023: Traveltek and Cruise Planners formed a strategic alliance, enhancing cruise booking technology for agents nationally.
In-Depth Cruise Tourism Market Market Outlook
The cruise tourism market is poised for continued growth, driven by technological innovation, strategic partnerships, and expansion into new markets. Opportunities lie in personalization, sustainability, and niche tourism. Addressing challenges like fuel costs and environmental regulations is crucial for long-term sustainability and profitability. The market shows strong potential for expansion, particularly in emerging economies with a growing middle class and increasing interest in leisure travel.
Cruise Tourism Market Segmentation
-
1. Type
- 1.1. River Cruise
- 1.2. Ocean Cruise
- 1.3. Expedition Cruise
- 1.4. Theme Cruise
- 1.5. Adventure Cruise
- 1.6. Others
-
2. Duration
- 2.1. 1-7Days
- 2.2. 8-14 Days
- 2.3. 15-20 Days
- 2.4. More than 21 Days
-
3. Passenger Age
- 3.1. Less than 12 years
- 3.2. 13-19 Years
- 3.3. 20-39 Years
- 3.4. 40-59 Years
- 3.5. Above 60 Years
Cruise Tourism Market Segmentation By Geography
-
1. North America
- 1.1. US
- 1.2. Canada
- 1.3. Mexico
- 1.4. Rest of North America
-
2. Europe
- 2.1. Germany
- 2.2. UK
- 2.3. France
- 2.4. Russia
- 2.5. Spain
- 2.6. Rest of Europe
-
3. Asia Pacific
- 3.1. India
- 3.2. China
- 3.3. Japan
- 3.4. Rest of Asia Pacific
-
4. South America
- 4.1. Brazil
- 4.2. Argentina
- 4.3. Rest of South America
-
5. Middle East
- 5.1. UAE
- 5.2. Saudi Arabia
- 5.3. Rest of Middle East
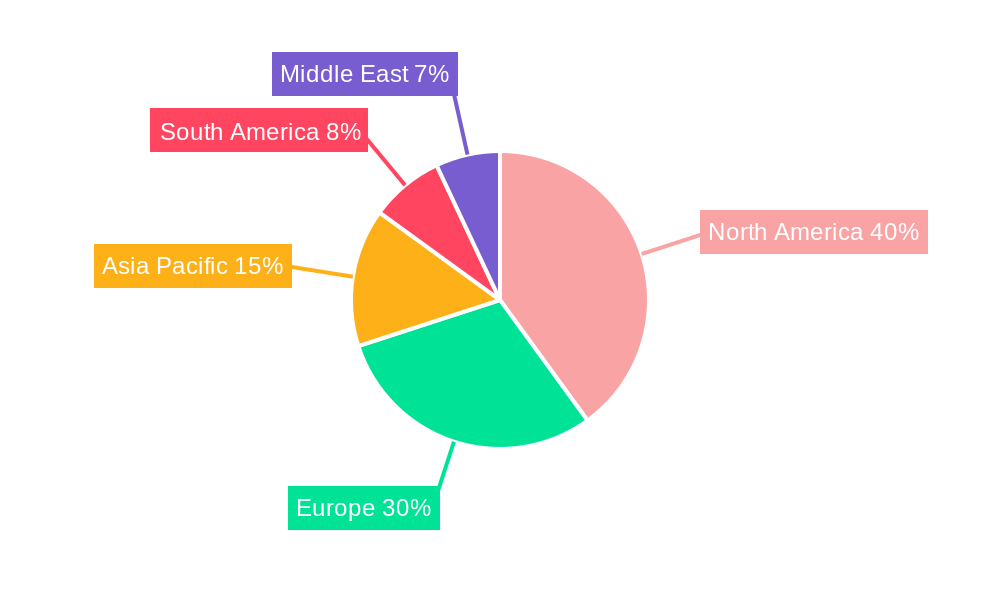
Cruise Tourism Market Regional Market Share
Geographic Coverage of Cruise Tourism Market
Cruise Tourism Market REPORT HIGHLIGHTS
| Aspects | Details |
|---|---|
| Study Period | 2020-2034 |
| Base Year | 2025 |
| Estimated Year | 2026 |
| Forecast Period | 2026-2034 |
| Historical Period | 2020-2025 |
| Growth Rate | CAGR of 8.67% from 2020-2034 |
| Segmentation |
|
Table of Contents
- 1. Introduction
- 1.1. Research Scope
- 1.2. Market Segmentation
- 1.3. Research Objective
- 1.4. Definitions and Assumptions
- 2. Executive Summary
- 2.1. Market Snapshot
- 3. Market Dynamics
- 3.1. Market Drivers
- 3.2. Market Restrains
- 3.3. Market Trends
- 3.4. Market Opportunities
- 4. Market Factor Analysis
- 4.1. Porters Five Forces
- 4.1.1. Bargaining Power of Suppliers
- 4.1.2. Bargaining Power of Buyers
- 4.1.3. Threat of New Entrants
- 4.1.4. Threat of Substitutes
- 4.1.5. Competitive Rivalry
- 4.2. PESTEL analysis
- 4.3. BCG Analysis
- 4.3.1. Stars (High Growth, High Market Share)
- 4.3.2. Cash Cows (Low Growth, High Market Share)
- 4.3.3. Question Mark (High Growth, Low Market Share)
- 4.3.4. Dogs (Low Growth, Low Market Share)
- 4.4. Ansoff Matrix Analysis
- 4.5. Supply Chain Analysis
- 4.6. Regulatory Landscape
- 4.7. Current Market Potential and Opportunity Assessment (TAM–SAM–SOM Framework)
- 4.8. NRP Analyst Note
- 4.1. Porters Five Forces
- 5. Market Analysis, Insights and Forecast 2021-2033
- 5.1. Market Analysis, Insights and Forecast - by Type
- 5.1.1. River Cruise
- 5.1.2. Ocean Cruise
- 5.1.3. Expedition Cruise
- 5.1.4. Theme Cruise
- 5.1.5. Adventure Cruise
- 5.1.6. Others
- 5.2. Market Analysis, Insights and Forecast - by Duration
- 5.2.1. 1-7Days
- 5.2.2. 8-14 Days
- 5.2.3. 15-20 Days
- 5.2.4. More than 21 Days
- 5.3. Market Analysis, Insights and Forecast - by Passenger Age
- 5.3.1. Less than 12 years
- 5.3.2. 13-19 Years
- 5.3.3. 20-39 Years
- 5.3.4. 40-59 Years
- 5.3.5. Above 60 Years
- 5.4. Market Analysis, Insights and Forecast - by Region
- 5.4.1. North America
- 5.4.2. Europe
- 5.4.3. Asia Pacific
- 5.4.4. South America
- 5.4.5. Middle East
- 5.1. Market Analysis, Insights and Forecast - by Type
- 6. Global Cruise Tourism Market Analysis, Insights and Forecast, 2021-2033
- 6.1. Market Analysis, Insights and Forecast - by Type
- 6.1.1. River Cruise
- 6.1.2. Ocean Cruise
- 6.1.3. Expedition Cruise
- 6.1.4. Theme Cruise
- 6.1.5. Adventure Cruise
- 6.1.6. Others
- 6.2. Market Analysis, Insights and Forecast - by Duration
- 6.2.1. 1-7Days
- 6.2.2. 8-14 Days
- 6.2.3. 15-20 Days
- 6.2.4. More than 21 Days
- 6.3. Market Analysis, Insights and Forecast - by Passenger Age
- 6.3.1. Less than 12 years
- 6.3.2. 13-19 Years
- 6.3.3. 20-39 Years
- 6.3.4. 40-59 Years
- 6.3.5. Above 60 Years
- 6.1. Market Analysis, Insights and Forecast - by Type
- 7. North America Cruise Tourism Market Analysis, Insights and Forecast, 2020-2032
- 7.1. Market Analysis, Insights and Forecast - by Type
- 7.1.1. River Cruise
- 7.1.2. Ocean Cruise
- 7.1.3. Expedition Cruise
- 7.1.4. Theme Cruise
- 7.1.5. Adventure Cruise
- 7.1.6. Others
- 7.2. Market Analysis, Insights and Forecast - by Duration
- 7.2.1. 1-7Days
- 7.2.2. 8-14 Days
- 7.2.3. 15-20 Days
- 7.2.4. More than 21 Days
- 7.3. Market Analysis, Insights and Forecast - by Passenger Age
- 7.3.1. Less than 12 years
- 7.3.2. 13-19 Years
- 7.3.3. 20-39 Years
- 7.3.4. 40-59 Years
- 7.3.5. Above 60 Years
- 7.1. Market Analysis, Insights and Forecast - by Type
- 8. Europe Cruise Tourism Market Analysis, Insights and Forecast, 2020-2032
- 8.1. Market Analysis, Insights and Forecast - by Type
- 8.1.1. River Cruise
- 8.1.2. Ocean Cruise
- 8.1.3. Expedition Cruise
- 8.1.4. Theme Cruise
- 8.1.5. Adventure Cruise
- 8.1.6. Others
- 8.2. Market Analysis, Insights and Forecast - by Duration
- 8.2.1. 1-7Days
- 8.2.2. 8-14 Days
- 8.2.3. 15-20 Days
- 8.2.4. More than 21 Days
- 8.3. Market Analysis, Insights and Forecast - by Passenger Age
- 8.3.1. Less than 12 years
- 8.3.2. 13-19 Years
- 8.3.3. 20-39 Years
- 8.3.4. 40-59 Years
- 8.3.5. Above 60 Years
- 8.1. Market Analysis, Insights and Forecast - by Type
- 9. Asia Pacific Cruise Tourism Market Analysis, Insights and Forecast, 2020-2032
- 9.1. Market Analysis, Insights and Forecast - by Type
- 9.1.1. River Cruise
- 9.1.2. Ocean Cruise
- 9.1.3. Expedition Cruise
- 9.1.4. Theme Cruise
- 9.1.5. Adventure Cruise
- 9.1.6. Others
- 9.2. Market Analysis, Insights and Forecast - by Duration
- 9.2.1. 1-7Days
- 9.2.2. 8-14 Days
- 9.2.3. 15-20 Days
- 9.2.4. More than 21 Days
- 9.3. Market Analysis, Insights and Forecast - by Passenger Age
- 9.3.1. Less than 12 years
- 9.3.2. 13-19 Years
- 9.3.3. 20-39 Years
- 9.3.4. 40-59 Years
- 9.3.5. Above 60 Years
- 9.1. Market Analysis, Insights and Forecast - by Type
- 10. South America Cruise Tourism Market Analysis, Insights and Forecast, 2020-2032
- 10.1. Market Analysis, Insights and Forecast - by Type
- 10.1.1. River Cruise
- 10.1.2. Ocean Cruise
- 10.1.3. Expedition Cruise
- 10.1.4. Theme Cruise
- 10.1.5. Adventure Cruise
- 10.1.6. Others
- 10.2. Market Analysis, Insights and Forecast - by Duration
- 10.2.1. 1-7Days
- 10.2.2. 8-14 Days
- 10.2.3. 15-20 Days
- 10.2.4. More than 21 Days
- 10.3. Market Analysis, Insights and Forecast - by Passenger Age
- 10.3.1. Less than 12 years
- 10.3.2. 13-19 Years
- 10.3.3. 20-39 Years
- 10.3.4. 40-59 Years
- 10.3.5. Above 60 Years
- 10.1. Market Analysis, Insights and Forecast - by Type
- 11. Middle East Cruise Tourism Market Analysis, Insights and Forecast, 2020-2032
- 11.1. Market Analysis, Insights and Forecast - by Type
- 11.1.1. River Cruise
- 11.1.2. Ocean Cruise
- 11.1.3. Expedition Cruise
- 11.1.4. Theme Cruise
- 11.1.5. Adventure Cruise
- 11.1.6. Others
- 11.2. Market Analysis, Insights and Forecast - by Duration
- 11.2.1. 1-7Days
- 11.2.2. 8-14 Days
- 11.2.3. 15-20 Days
- 11.2.4. More than 21 Days
- 11.3. Market Analysis, Insights and Forecast - by Passenger Age
- 11.3.1. Less than 12 years
- 11.3.2. 13-19 Years
- 11.3.3. 20-39 Years
- 11.3.4. 40-59 Years
- 11.3.5. Above 60 Years
- 11.1. Market Analysis, Insights and Forecast - by Type
- 12. Competitive Analysis
- 12.1. Company Profiles
- 12.1.1 Princess Cruises
- 12.1.1.1. Company Overview
- 12.1.1.2. Products
- 12.1.1.3. Company Financials
- 12.1.1.4. SWOT Analysis
- 12.1.2 Carnival Corporation & Plc
- 12.1.2.1. Company Overview
- 12.1.2.2. Products
- 12.1.2.3. Company Financials
- 12.1.2.4. SWOT Analysis
- 12.1.3 Norwegian Cruise Line Holdings Ltd
- 12.1.3.1. Company Overview
- 12.1.3.2. Products
- 12.1.3.3. Company Financials
- 12.1.3.4. SWOT Analysis
- 12.1.4 Royal Caribbean Group
- 12.1.4.1. Company Overview
- 12.1.4.2. Products
- 12.1.4.3. Company Financials
- 12.1.4.4. SWOT Analysis
- 12.1.5 Celebrity Cruises
- 12.1.5.1. Company Overview
- 12.1.5.2. Products
- 12.1.5.3. Company Financials
- 12.1.5.4. SWOT Analysis
- 12.1.6 Costa Cruises
- 12.1.6.1. Company Overview
- 12.1.6.2. Products
- 12.1.6.3. Company Financials
- 12.1.6.4. SWOT Analysis
- 12.1.7 Holland America Line
- 12.1.7.1. Company Overview
- 12.1.7.2. Products
- 12.1.7.3. Company Financials
- 12.1.7.4. SWOT Analysis
- 12.1.8 MSC Cruises
- 12.1.8.1. Company Overview
- 12.1.8.2. Products
- 12.1.8.3. Company Financials
- 12.1.8.4. SWOT Analysis
- 12.1.9 Disney Cruise Line
- 12.1.9.1. Company Overview
- 12.1.9.2. Products
- 12.1.9.3. Company Financials
- 12.1.9.4. SWOT Analysis
- 12.1.10 Cunard Line**List Not Exhaustive
- 12.1.10.1. Company Overview
- 12.1.10.2. Products
- 12.1.10.3. Company Financials
- 12.1.10.4. SWOT Analysis
- 12.1.1 Princess Cruises
- 12.2. Market Entropy
- 12.2.1 Company's Key Areas Served
- 12.2.2 Recent Developments
- 12.3. Company Market Share Analysis 2025
- 12.3.1 Top 5 Companies Market Share Analysis
- 12.3.2 Top 3 Companies Market Share Analysis
- 12.4. List of Potential Customers
- 13. Research Methodology
List of Figures
- Figure 1: Global Cruise Tourism Market Revenue Breakdown (Million, %) by Region 2025 & 2033
- Figure 2: North America Cruise Tourism Market Revenue (Million), by Type 2025 & 2033
- Figure 3: North America Cruise Tourism Market Revenue Share (%), by Type 2025 & 2033
- Figure 4: North America Cruise Tourism Market Revenue (Million), by Duration 2025 & 2033
- Figure 5: North America Cruise Tourism Market Revenue Share (%), by Duration 2025 & 2033
- Figure 6: North America Cruise Tourism Market Revenue (Million), by Passenger Age 2025 & 2033
- Figure 7: North America Cruise Tourism Market Revenue Share (%), by Passenger Age 2025 & 2033
- Figure 8: North America Cruise Tourism Market Revenue (Million), by Country 2025 & 2033
- Figure 9: North America Cruise Tourism Market Revenue Share (%), by Country 2025 & 2033
- Figure 10: Europe Cruise Tourism Market Revenue (Million), by Type 2025 & 2033
- Figure 11: Europe Cruise Tourism Market Revenue Share (%), by Type 2025 & 2033
- Figure 12: Europe Cruise Tourism Market Revenue (Million), by Duration 2025 & 2033
- Figure 13: Europe Cruise Tourism Market Revenue Share (%), by Duration 2025 & 2033
- Figure 14: Europe Cruise Tourism Market Revenue (Million), by Passenger Age 2025 & 2033
- Figure 15: Europe Cruise Tourism Market Revenue Share (%), by Passenger Age 2025 & 2033
- Figure 16: Europe Cruise Tourism Market Revenue (Million), by Country 2025 & 2033
- Figure 17: Europe Cruise Tourism Market Revenue Share (%), by Country 2025 & 2033
- Figure 18: Asia Pacific Cruise Tourism Market Revenue (Million), by Type 2025 & 2033
- Figure 19: Asia Pacific Cruise Tourism Market Revenue Share (%), by Type 2025 & 2033
- Figure 20: Asia Pacific Cruise Tourism Market Revenue (Million), by Duration 2025 & 2033
- Figure 21: Asia Pacific Cruise Tourism Market Revenue Share (%), by Duration 2025 & 2033
- Figure 22: Asia Pacific Cruise Tourism Market Revenue (Million), by Passenger Age 2025 & 2033
- Figure 23: Asia Pacific Cruise Tourism Market Revenue Share (%), by Passenger Age 2025 & 2033
- Figure 24: Asia Pacific Cruise Tourism Market Revenue (Million), by Country 2025 & 2033
- Figure 25: Asia Pacific Cruise Tourism Market Revenue Share (%), by Country 2025 & 2033
- Figure 26: South America Cruise Tourism Market Revenue (Million), by Type 2025 & 2033
- Figure 27: South America Cruise Tourism Market Revenue Share (%), by Type 2025 & 2033
- Figure 28: South America Cruise Tourism Market Revenue (Million), by Duration 2025 & 2033
- Figure 29: South America Cruise Tourism Market Revenue Share (%), by Duration 2025 & 2033
- Figure 30: South America Cruise Tourism Market Revenue (Million), by Passenger Age 2025 & 2033
- Figure 31: South America Cruise Tourism Market Revenue Share (%), by Passenger Age 2025 & 2033
- Figure 32: South America Cruise Tourism Market Revenue (Million), by Country 2025 & 2033
- Figure 33: South America Cruise Tourism Market Revenue Share (%), by Country 2025 & 2033
- Figure 34: Middle East Cruise Tourism Market Revenue (Million), by Type 2025 & 2033
- Figure 35: Middle East Cruise Tourism Market Revenue Share (%), by Type 2025 & 2033
- Figure 36: Middle East Cruise Tourism Market Revenue (Million), by Duration 2025 & 2033
- Figure 37: Middle East Cruise Tourism Market Revenue Share (%), by Duration 2025 & 2033
- Figure 38: Middle East Cruise Tourism Market Revenue (Million), by Passenger Age 2025 & 2033
- Figure 39: Middle East Cruise Tourism Market Revenue Share (%), by Passenger Age 2025 & 2033
- Figure 40: Middle East Cruise Tourism Market Revenue (Million), by Country 2025 & 2033
- Figure 41: Middle East Cruise Tourism Market Revenue Share (%), by Country 2025 & 2033
List of Tables
- Table 1: Global Cruise Tourism Market Revenue Million Forecast, by Type 2020 & 2033
- Table 2: Global Cruise Tourism Market Revenue Million Forecast, by Duration 2020 & 2033
- Table 3: Global Cruise Tourism Market Revenue Million Forecast, by Passenger Age 2020 & 2033
- Table 4: Global Cruise Tourism Market Revenue Million Forecast, by Region 2020 & 2033
- Table 5: Global Cruise Tourism Market Revenue Million Forecast, by Type 2020 & 2033
- Table 6: Global Cruise Tourism Market Revenue Million Forecast, by Duration 2020 & 2033
- Table 7: Global Cruise Tourism Market Revenue Million Forecast, by Passenger Age 2020 & 2033
- Table 8: Global Cruise Tourism Market Revenue Million Forecast, by Country 2020 & 2033
- Table 9: US Cruise Tourism Market Revenue (Million) Forecast, by Application 2020 & 2033
- Table 10: Canada Cruise Tourism Market Revenue (Million) Forecast, by Application 2020 & 2033
- Table 11: Mexico Cruise Tourism Market Revenue (Million) Forecast, by Application 2020 & 2033
- Table 12: Rest of North America Cruise Tourism Market Revenue (Million) Forecast, by Application 2020 & 2033
- Table 13: Global Cruise Tourism Market Revenue Million Forecast, by Type 2020 & 2033
- Table 14: Global Cruise Tourism Market Revenue Million Forecast, by Duration 2020 & 2033
- Table 15: Global Cruise Tourism Market Revenue Million Forecast, by Passenger Age 2020 & 2033
- Table 16: Global Cruise Tourism Market Revenue Million Forecast, by Country 2020 & 2033
- Table 17: Germany Cruise Tourism Market Revenue (Million) Forecast, by Application 2020 & 2033
- Table 18: UK Cruise Tourism Market Revenue (Million) Forecast, by Application 2020 & 2033
- Table 19: France Cruise Tourism Market Revenue (Million) Forecast, by Application 2020 & 2033
- Table 20: Russia Cruise Tourism Market Revenue (Million) Forecast, by Application 2020 & 2033
- Table 21: Spain Cruise Tourism Market Revenue (Million) Forecast, by Application 2020 & 2033
- Table 22: Rest of Europe Cruise Tourism Market Revenue (Million) Forecast, by Application 2020 & 2033
- Table 23: Global Cruise Tourism Market Revenue Million Forecast, by Type 2020 & 2033
- Table 24: Global Cruise Tourism Market Revenue Million Forecast, by Duration 2020 & 2033
- Table 25: Global Cruise Tourism Market Revenue Million Forecast, by Passenger Age 2020 & 2033
- Table 26: Global Cruise Tourism Market Revenue Million Forecast, by Country 2020 & 2033
- Table 27: India Cruise Tourism Market Revenue (Million) Forecast, by Application 2020 & 2033
- Table 28: China Cruise Tourism Market Revenue (Million) Forecast, by Application 2020 & 2033
- Table 29: Japan Cruise Tourism Market Revenue (Million) Forecast, by Application 2020 & 2033
- Table 30: Rest of Asia Pacific Cruise Tourism Market Revenue (Million) Forecast, by Application 2020 & 2033
- Table 31: Global Cruise Tourism Market Revenue Million Forecast, by Type 2020 & 2033
- Table 32: Global Cruise Tourism Market Revenue Million Forecast, by Duration 2020 & 2033
- Table 33: Global Cruise Tourism Market Revenue Million Forecast, by Passenger Age 2020 & 2033
- Table 34: Global Cruise Tourism Market Revenue Million Forecast, by Country 2020 & 2033
- Table 35: Brazil Cruise Tourism Market Revenue (Million) Forecast, by Application 2020 & 2033
- Table 36: Argentina Cruise Tourism Market Revenue (Million) Forecast, by Application 2020 & 2033
- Table 37: Rest of South America Cruise Tourism Market Revenue (Million) Forecast, by Application 2020 & 2033
- Table 38: Global Cruise Tourism Market Revenue Million Forecast, by Type 2020 & 2033
- Table 39: Global Cruise Tourism Market Revenue Million Forecast, by Duration 2020 & 2033
- Table 40: Global Cruise Tourism Market Revenue Million Forecast, by Passenger Age 2020 & 2033
- Table 41: Global Cruise Tourism Market Revenue Million Forecast, by Country 2020 & 2033
- Table 42: UAE Cruise Tourism Market Revenue (Million) Forecast, by Application 2020 & 2033
- Table 43: Saudi Arabia Cruise Tourism Market Revenue (Million) Forecast, by Application 2020 & 2033
- Table 44: Rest of Middle East Cruise Tourism Market Revenue (Million) Forecast, by Application 2020 & 2033
Frequently Asked Questions
1. What is the projected Compound Annual Growth Rate (CAGR) of the Cruise Tourism Market?
The projected CAGR is approximately 8.67%.
2. Which companies are prominent players in the Cruise Tourism Market?
Key companies in the market include Princess Cruises, Carnival Corporation & Plc, Norwegian Cruise Line Holdings Ltd, Royal Caribbean Group, Celebrity Cruises, Costa Cruises, Holland America Line, MSC Cruises, Disney Cruise Line, Cunard Line**List Not Exhaustive.
3. What are the main segments of the Cruise Tourism Market?
The market segments include Type, Duration, Passenger Age.
4. Can you provide details about the market size?
The market size is estimated to be USD 9.44 Million as of 2022.
5. What are some drivers contributing to market growth?
Increasing Disposable Income is Driving the Market.
6. What are the notable trends driving market growth?
Increase in Number of Ocean Cruise Passengers in North America.
7. Are there any restraints impacting market growth?
High Costs is Restraining the Market.
8. Can you provide examples of recent developments in the market?
November 2023: TravClan and Resorts World Cruises joined forces in a groundbreaking partnership aimed at revolutionizing cruise tourism in India. Through this collaboration, TravClan embarks on a transformative journey that promises to redefine the landscape of cruise vacations in India, ensuring accessibility and affordability for all.
9. What pricing options are available for accessing the report?
Pricing options include single-user, multi-user, and enterprise licenses priced at USD 4750, USD 5250, and USD 8750 respectively.
10. Is the market size provided in terms of value or volume?
The market size is provided in terms of value, measured in Million.
11. Are there any specific market keywords associated with the report?
Yes, the market keyword associated with the report is "Cruise Tourism Market," which aids in identifying and referencing the specific market segment covered.
12. How do I determine which pricing option suits my needs best?
The pricing options vary based on user requirements and access needs. Individual users may opt for single-user licenses, while businesses requiring broader access may choose multi-user or enterprise licenses for cost-effective access to the report.
13. Are there any additional resources or data provided in the Cruise Tourism Market report?
While the report offers comprehensive insights, it's advisable to review the specific contents or supplementary materials provided to ascertain if additional resources or data are available.
14. How can I stay updated on further developments or reports in the Cruise Tourism Market?
To stay informed about further developments, trends, and reports in the Cruise Tourism Market, consider subscribing to industry newsletters, following relevant companies and organizations, or regularly checking reputable industry news sources and publications.
Methodology
Step 1 - Identification of Relevant Samples Size from Population Database


Step 2 - Approaches for Defining Global Market Size (Value, Volume* & Price*)

Note*: In applicable scenarios
Step 3 - Data Sources
Primary Research
- Web Analytics
- Survey Reports
- Research Institute
- Latest Research Reports
- Opinion Leaders
Secondary Research
- Annual Reports
- White Paper
- Latest Press Release
- Industry Association
- Paid Database
- Investor Presentations

Step 4 - Data Triangulation
Involves using different sources of information in order to increase the validity of a study
These sources are likely to be stakeholders in a program - participants, other researchers, program staff, other community members, and so on.
Then we put all data in single framework & apply various statistical tools to find out the dynamic on the market.
During the analysis stage, feedback from the stakeholder groups would be compared to determine areas of agreement as well as areas of divergence