

Key Insights
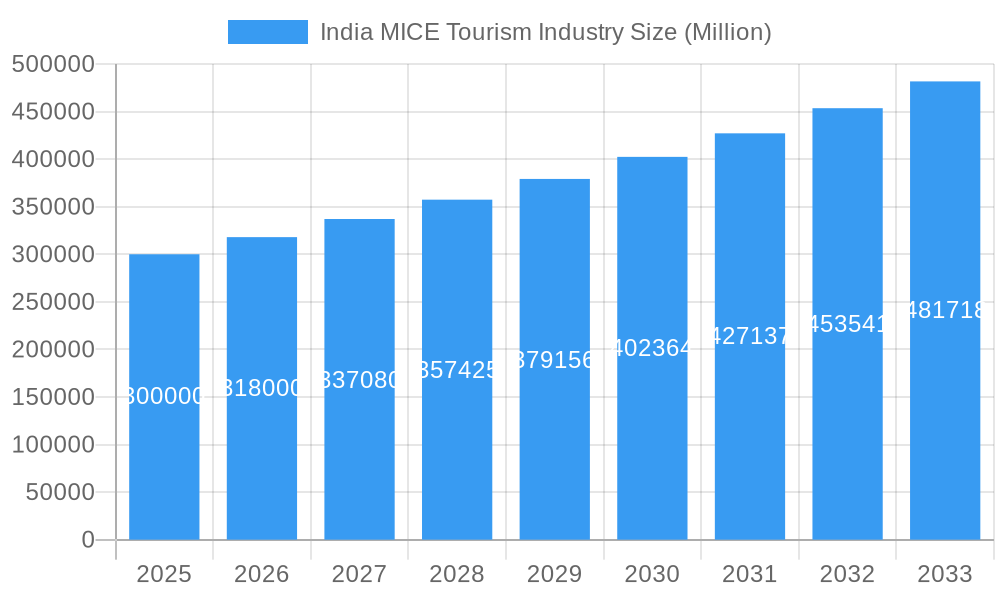
The India MICE (Meetings, Incentives, Conferences, Exhibitions) tourism sector is poised for significant expansion, fueled by a robust economy, escalating business activities, and a growing demand for experiential travel. With a projected CAGR of 5.2% from 2024 to 2033, the market is anticipated to reach approximately $110.3 billion by 2033. A detailed segmental analysis highlights contributions from meetings, incentives, conferences, and exhibitions. The estimated market size for the base year 2024 is $110.3 billion. Key growth drivers include the increasing presence of multinational corporations in India, supportive government tourism initiatives, and the continuous development of world-class infrastructure, particularly in major metropolitan hubs. Emerging trends emphasize a strong inclination towards sustainable and technology-integrated events, a heightened demand for unique and immersive experiences, and the growing adoption of hybrid event formats.
India MICE Tourism Industry Market Size (In Billion)
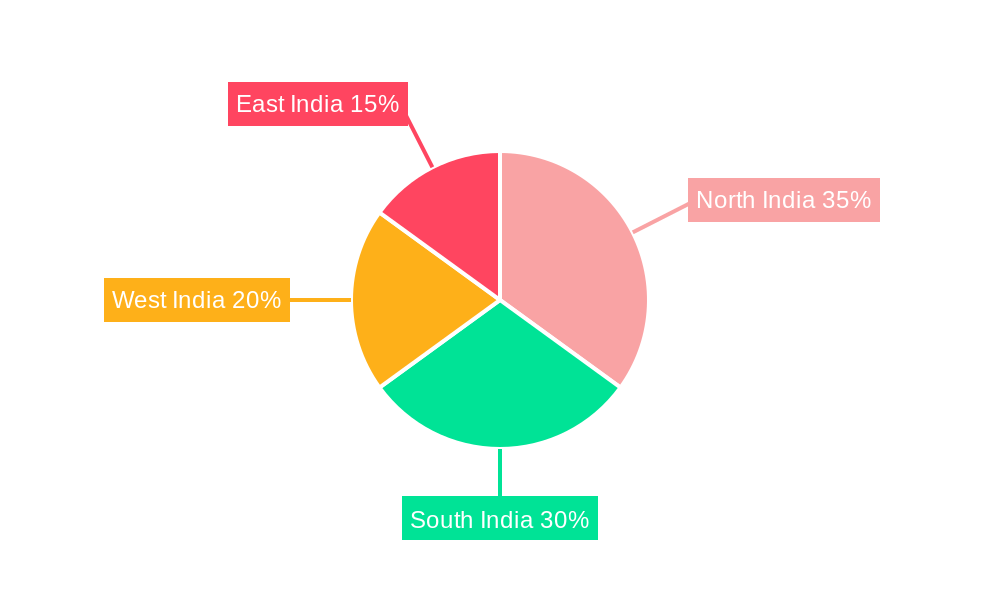
Despite the positive outlook, the industry faces certain challenges. These include infrastructure constraints in secondary regions, intense pricing competition, and the inherent seasonality of tourism. To address these limitations, industry stakeholders are prioritizing technological advancements, cultivating specialized offerings, and actively promoting India as a premier global MICE destination. Regional market distribution indicates a concentration in North and South India due to established infrastructure and economic activity. This presents strategic opportunities for focused investment and promotional efforts in other regions to foster more balanced national growth. The competitive landscape is dynamic, characterized by a blend of established entities and new entrants vying for market share. Companies are implementing diverse strategies, ranging from specialization in specific event categories to leveraging technology for enhanced service delivery and operational efficiency.
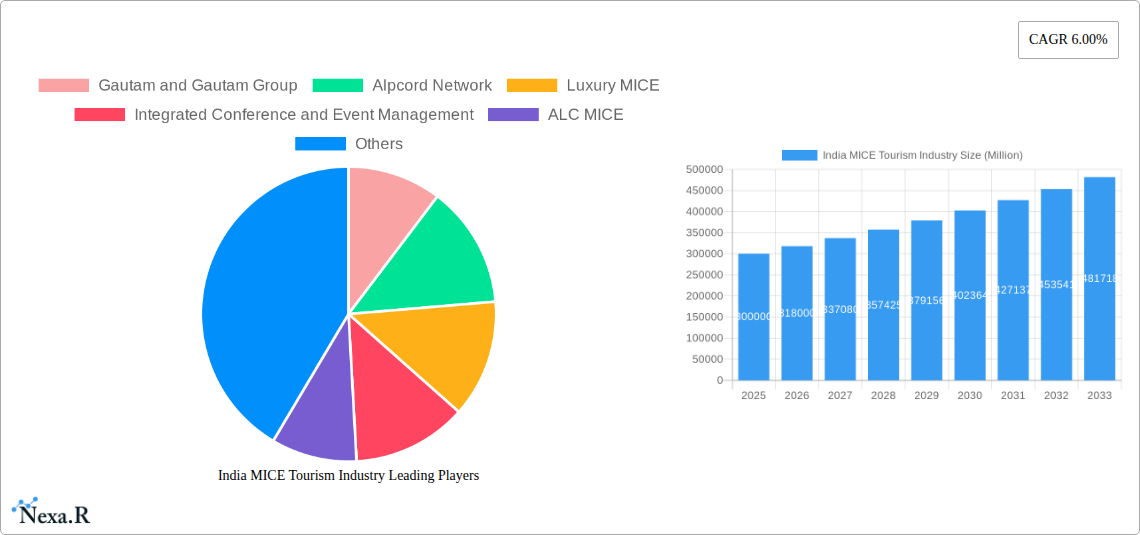
India MICE Tourism Industry Company Market Share
This comprehensive report offers an in-depth analysis of the India MICE tourism market, providing critical insights for industry professionals, investors, and strategic planners. Covering the period 2019-2033, with a base year of 2024, this report meticulously examines market dynamics, growth trajectories, key stakeholders, and future prospects within this rapidly evolving sector. The analysis encompasses the broader Indian tourism market and its MICE segment, offering granular insights into market segmentation by event type (Meetings, Incentives, Conferences, Exhibitions).
India MICE Tourism Industry Market Dynamics & Structure
This section analyzes the competitive landscape, technological advancements, and regulatory influences shaping the Indian MICE tourism market. The report examines market concentration, identifying key players and their market shares (estimated at xx Million for the top 5 players in 2025). Technological innovation, including the adoption of virtual and hybrid events, is assessed alongside regulatory frameworks impacting the sector. The analysis also considers the impact of substitute products (e.g., virtual meetings) and end-user demographics (corporate, government, associations). Furthermore, the report delves into M&A activity within the industry, estimating the volume of deals (xx deals) during the historical period (2019-2024) and projecting future trends (xx deals predicted for 2025-2033).
- Market Concentration: Highly fragmented, with a few large players and numerous smaller firms.
- Technological Innovation: Rapid adoption of virtual and hybrid event technologies. Barriers include digital literacy and infrastructure gaps in certain regions.
- Regulatory Framework: Government policies promoting tourism and infrastructure development influence market growth.
- Competitive Substitutes: Rise of virtual events poses a challenge to traditional MICE services.
- End-User Demographics: Primarily corporate clients, but growing participation from government and associations.
- M&A Trends: Consolidation is expected, with larger firms acquiring smaller players to enhance market share and service offerings.
India MICE Tourism Industry Growth Trends & Insights
The Indian MICE tourism market exhibits robust growth, driven by factors such as increasing business travel, rising disposable incomes, and government initiatives promoting tourism. The report provides a detailed analysis of market size evolution (from xx Million in 2019 to xx Million in 2024, projected to reach xx Million in 2033), adoption rates of new technologies, and shifting consumer preferences toward experiential and personalized events. The report also quantifies the Compound Annual Growth Rate (CAGR) and market penetration rates, providing a comprehensive understanding of industry growth dynamics. The influence of technological disruptions, such as the shift toward hybrid and virtual events, and changing consumer behaviors are meticulously assessed.
Dominant Regions, Countries, or Segments in India MICE Tourism Industry
This section identifies the leading segments within the Indian MICE tourism market, analyzing their growth drivers and market dominance. While data is unavailable to assign a single dominant region, the report highlights the contributions of different states and cities to overall growth. The focus on specific event types (Meetings, Incentives, Conferences, Exhibitions) will help identify the most impactful segments. Key factors influencing regional dominance include economic strength, infrastructure development, and government policies.
- Key Drivers:
- Strong economic growth in key regions.
- Development of world-class infrastructure (e.g., convention centers, airports).
- Favorable government policies promoting tourism and business events.
- Market Share & Growth Potential: The report provides a detailed breakdown of market share by region and segment, projecting future growth potential based on various factors. For example, cities like Bangalore, after the 2022 budget announcement, are expected to experience a surge in MICE activity.
India MICE Tourism Industry Product Landscape
The MICE industry offers a diverse range of products and services, encompassing event planning, venue management, technology solutions, and accommodation. Recent innovations include the integration of virtual reality and augmented reality experiences, enhancing engagement and interactivity. Key performance indicators (KPIs) such as event attendance, customer satisfaction, and return on investment (ROI) are analyzed. Unique selling propositions of various service providers and the adoption of advanced technologies like AI for event management are highlighted.
Key Drivers, Barriers & Challenges in India MICE Tourism Industry
Key Drivers:
- Rapid economic growth and increasing business activities.
- Government initiatives promoting tourism and infrastructure development.
- Growing preference for experiential and personalized events.
Challenges:
- Infrastructure limitations in certain regions.
- Intense competition among service providers.
- Dependence on global economic conditions and fluctuating currency exchange rates, which might have influenced the industry value by xx Million in the last year.
Emerging Opportunities in India MICE Tourism Industry
Emerging opportunities include the expansion of niche MICE segments (e.g., medical tourism conferences, sustainable events), the growth of virtual and hybrid event formats, and the increasing demand for specialized services such as event technology integration. The untapped potential of tier-2 and tier-3 cities also presents significant opportunities for market expansion.
Growth Accelerators in the India MICE Tourism Industry Industry
Long-term growth is fueled by technological advancements (AI-powered event management tools), strategic partnerships between event organizers and technology providers, and the expansion into new geographic markets. Government incentives and improved infrastructure are also major catalysts.
Key Players Shaping the India MICE Tourism Industry Market
- Gautam and Gautam Group
- Alpcord Network
- Luxury MICE
- Integrated Conference and Event Management
- ALC MICE
- ITL World
- India MICE
- Travel XS MICE & More Services
- Dee Catalyst Pvt Ltd
- Plan IT! India
Notable Milestones in India MICE Tourism Industry Sector
- June 2021: The Ministry of Tourism identified six cities (Agra, Udaipur, Pune, Thiruvananthapuram, Varanasi, and Bhubaneswar) for MICE development. This initiative is expected to significantly boost tourism across these regions.
- March 2022: The Chief Minister of Karnataka announced the upgradation of Bangalore into a major MICE hub, leveraging its existing infrastructure and strategic location. This decision is projected to lead to a substantial increase in MICE events held in Bangalore.
In-Depth India MICE Tourism Industry Market Outlook
The Indian MICE tourism market exhibits strong future growth potential. Technological advancements, strategic collaborations, and favorable government policies will continue to drive expansion. The development of new infrastructure and the exploration of niche segments will unlock further opportunities for market players. The projected growth is expected to significantly benefit the overall tourism sector and contribute substantially to India's GDP.
India MICE Tourism Industry Segmentation
-
1. Event
- 1.1. Meeting
- 1.2. Incentives
- 1.3. Conference
- 1.4. Exhibitions
India MICE Tourism Industry Segmentation By Geography
- 1. India
India MICE Tourism Industry Regional Market Share
Geographic Coverage of India MICE Tourism Industry
India MICE Tourism Industry REPORT HIGHLIGHTS
| Aspects | Details |
|---|---|
| Study Period | 2020-2034 |
| Base Year | 2025 |
| Estimated Year | 2026 |
| Forecast Period | 2026-2034 |
| Historical Period | 2020-2025 |
| Growth Rate | CAGR of 5.2% from 2020-2034 |
| Segmentation |
|
Table of Contents
- 1. Introduction
- 1.1. Research Scope
- 1.2. Market Segmentation
- 1.3. Research Objective
- 1.4. Definitions and Assumptions
- 2. Executive Summary
- 2.1. Market Snapshot
- 3. Market Dynamics
- 3.1. Market Drivers
- 3.2. Market Restrains
- 3.3. Market Trends
- 3.4. Market Opportunities
- 4. Market Factor Analysis
- 4.1. Porters Five Forces
- 4.1.1. Bargaining Power of Suppliers
- 4.1.2. Bargaining Power of Buyers
- 4.1.3. Threat of New Entrants
- 4.1.4. Threat of Substitutes
- 4.1.5. Competitive Rivalry
- 4.2. PESTEL analysis
- 4.3. BCG Analysis
- 4.3.1. Stars (High Growth, High Market Share)
- 4.3.2. Cash Cows (Low Growth, High Market Share)
- 4.3.3. Question Mark (High Growth, Low Market Share)
- 4.3.4. Dogs (Low Growth, Low Market Share)
- 4.4. Ansoff Matrix Analysis
- 4.5. Supply Chain Analysis
- 4.6. Regulatory Landscape
- 4.7. Current Market Potential and Opportunity Assessment (TAM–SAM–SOM Framework)
- 4.8. NRP Analyst Note
- 4.1. Porters Five Forces
- 5. Market Analysis, Insights and Forecast 2021-2033
- 5.1. Market Analysis, Insights and Forecast - by Event
- 5.1.1. Meeting
- 5.1.2. Incentives
- 5.1.3. Conference
- 5.1.4. Exhibitions
- 5.2. Market Analysis, Insights and Forecast - by Region
- 5.2.1. India
- 5.1. Market Analysis, Insights and Forecast - by Event
- 6. India MICE Tourism Industry Analysis, Insights and Forecast, 2021-2033
- 6.1. Market Analysis, Insights and Forecast - by Event
- 6.1.1. Meeting
- 6.1.2. Incentives
- 6.1.3. Conference
- 6.1.4. Exhibitions
- 6.1. Market Analysis, Insights and Forecast - by Event
- 7. Competitive Analysis
- 7.1. Company Profiles
- 7.1.1 Gautam and Gautam Group
- 7.1.1.1. Company Overview
- 7.1.1.2. Products
- 7.1.1.3. Company Financials
- 7.1.1.4. SWOT Analysis
- 7.1.2 Alpcord Network
- 7.1.2.1. Company Overview
- 7.1.2.2. Products
- 7.1.2.3. Company Financials
- 7.1.2.4. SWOT Analysis
- 7.1.3 Luxury MICE
- 7.1.3.1. Company Overview
- 7.1.3.2. Products
- 7.1.3.3. Company Financials
- 7.1.3.4. SWOT Analysis
- 7.1.4 Integrated Conference and Event Management
- 7.1.4.1. Company Overview
- 7.1.4.2. Products
- 7.1.4.3. Company Financials
- 7.1.4.4. SWOT Analysis
- 7.1.5 ALC MICE
- 7.1.5.1. Company Overview
- 7.1.5.2. Products
- 7.1.5.3. Company Financials
- 7.1.5.4. SWOT Analysis
- 7.1.6 ITL World
- 7.1.6.1. Company Overview
- 7.1.6.2. Products
- 7.1.6.3. Company Financials
- 7.1.6.4. SWOT Analysis
- 7.1.7 India MICE**List Not Exhaustive
- 7.1.7.1. Company Overview
- 7.1.7.2. Products
- 7.1.7.3. Company Financials
- 7.1.7.4. SWOT Analysis
- 7.1.8 Travel XS MICE & More Services
- 7.1.8.1. Company Overview
- 7.1.8.2. Products
- 7.1.8.3. Company Financials
- 7.1.8.4. SWOT Analysis
- 7.1.9 Dee Catalyst Pvt Ltd
- 7.1.9.1. Company Overview
- 7.1.9.2. Products
- 7.1.9.3. Company Financials
- 7.1.9.4. SWOT Analysis
- 7.1.10 Plan IT! India
- 7.1.10.1. Company Overview
- 7.1.10.2. Products
- 7.1.10.3. Company Financials
- 7.1.10.4. SWOT Analysis
- 7.1.1 Gautam and Gautam Group
- 7.2. Market Entropy
- 7.2.1 Company's Key Areas Served
- 7.2.2 Recent Developments
- 7.3. Company Market Share Analysis 2025
- 7.3.1 Top 5 Companies Market Share Analysis
- 7.3.2 Top 3 Companies Market Share Analysis
- 7.4. List of Potential Customers
- 8. Research Methodology
List of Figures
- Figure 1: India MICE Tourism Industry Revenue Breakdown (billion, %) by Product 2025 & 2033
- Figure 2: India MICE Tourism Industry Share (%) by Company 2025
List of Tables
- Table 1: India MICE Tourism Industry Revenue billion Forecast, by Event 2020 & 2033
- Table 2: India MICE Tourism Industry Revenue billion Forecast, by Region 2020 & 2033
- Table 3: India MICE Tourism Industry Revenue billion Forecast, by Event 2020 & 2033
- Table 4: India MICE Tourism Industry Revenue billion Forecast, by Country 2020 & 2033
Frequently Asked Questions
1. What is the projected Compound Annual Growth Rate (CAGR) of the India MICE Tourism Industry?
The projected CAGR is approximately 5.2%.
2. Which companies are prominent players in the India MICE Tourism Industry?
Key companies in the market include Gautam and Gautam Group, Alpcord Network, Luxury MICE, Integrated Conference and Event Management, ALC MICE, ITL World, India MICE**List Not Exhaustive, Travel XS MICE & More Services, Dee Catalyst Pvt Ltd, Plan IT! India.
3. What are the main segments of the India MICE Tourism Industry?
The market segments include Event.
4. Can you provide details about the market size?
The market size is estimated to be USD 110.3 billion as of 2022.
5. What are some drivers contributing to market growth?
Growing Popularity of Museums. Historical Sites. Zoos and Park is driving the Market Growth; Digitalized Experiences is Driving the Market.
6. What are the notable trends driving market growth?
Then Number of Meeting and Conventions in India is Increasing.
7. Are there any restraints impacting market growth?
Distinct institutional cultures and values; Adapting to the changes in technology is tough for the Institutions.
8. Can you provide examples of recent developments in the market?
In March 2022, Presenting the budget for 2022/23, the Chief Minister of the State announced the up-gradation of Bangalore into a Meeting, Incentive, Conferences, and Exhibitions (MICE) hub of the country by leveraging the city's advantages as a business capital, IT Capital as well as its developed infrastructure in technology, transport, and air connectivity.
9. What pricing options are available for accessing the report?
Pricing options include single-user, multi-user, and enterprise licenses priced at USD 3800, USD 4500, and USD 5800 respectively.
10. Is the market size provided in terms of value or volume?
The market size is provided in terms of value, measured in billion.
11. Are there any specific market keywords associated with the report?
Yes, the market keyword associated with the report is "India MICE Tourism Industry," which aids in identifying and referencing the specific market segment covered.
12. How do I determine which pricing option suits my needs best?
The pricing options vary based on user requirements and access needs. Individual users may opt for single-user licenses, while businesses requiring broader access may choose multi-user or enterprise licenses for cost-effective access to the report.
13. Are there any additional resources or data provided in the India MICE Tourism Industry report?
While the report offers comprehensive insights, it's advisable to review the specific contents or supplementary materials provided to ascertain if additional resources or data are available.
14. How can I stay updated on further developments or reports in the India MICE Tourism Industry?
To stay informed about further developments, trends, and reports in the India MICE Tourism Industry, consider subscribing to industry newsletters, following relevant companies and organizations, or regularly checking reputable industry news sources and publications.
Methodology
Step 1 - Identification of Relevant Samples Size from Population Database


Step 2 - Approaches for Defining Global Market Size (Value, Volume* & Price*)

Note*: In applicable scenarios
Step 3 - Data Sources
Primary Research
- Web Analytics
- Survey Reports
- Research Institute
- Latest Research Reports
- Opinion Leaders
Secondary Research
- Annual Reports
- White Paper
- Latest Press Release
- Industry Association
- Paid Database
- Investor Presentations

Step 4 - Data Triangulation
Involves using different sources of information in order to increase the validity of a study
These sources are likely to be stakeholders in a program - participants, other researchers, program staff, other community members, and so on.
Then we put all data in single framework & apply various statistical tools to find out the dynamic on the market.
During the analysis stage, feedback from the stakeholder groups would be compared to determine areas of agreement as well as areas of divergence