

Key Insights
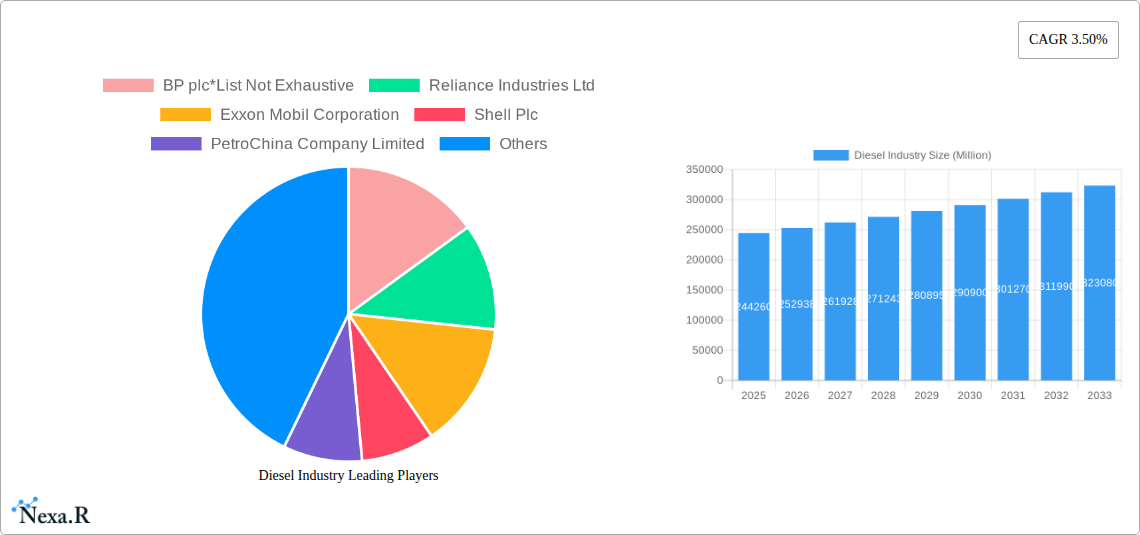
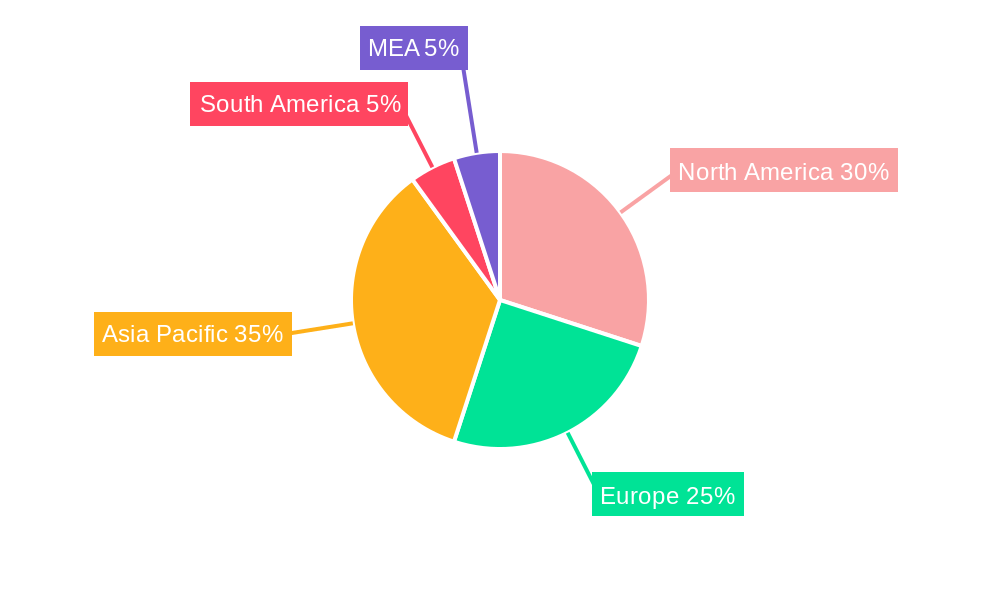
The global diesel fuel market, valued at $244.26 billion in 2025, is projected to experience steady growth, driven primarily by the continued reliance on diesel-powered vehicles in transportation and industrial sectors. A compound annual growth rate (CAGR) of 3.50% from 2025 to 2033 indicates a market expansion to approximately $340 billion by 2033. Key drivers include robust growth in freight transportation, particularly in emerging economies experiencing rapid industrialization and infrastructure development. The increasing demand for heavy-duty vehicles like trucks and construction equipment further fuels market expansion. However, growing environmental concerns related to diesel emissions, stringent government regulations aimed at reducing carbon footprint, and the rising adoption of alternative fuels like biofuels and electric vehicles pose significant restraints. Market segmentation reveals that transportation holds the largest share, followed by the industrial sector. Major players such as BP, Reliance Industries, ExxonMobil, and Shell dominate the market, leveraging their extensive distribution networks and refining capabilities. Regional analysis shows a significant market presence in North America and Asia-Pacific, driven by large economies and industrial activity in these regions. Europe, while showing consistent demand, faces stricter environmental regulations, potentially influencing the growth trajectory. The long-term outlook suggests a balance between steady growth and the challenges posed by decarbonization efforts. The market will likely witness increasing diversification and innovation, with a focus on cleaner diesel technologies and alternative fuel blends to mitigate environmental concerns and meet regulatory compliance.
The competitive landscape is characterized by a mix of large multinational corporations and regional players. The market is characterized by significant price fluctuations depending on crude oil prices. Furthermore, geopolitical factors and supply chain disruptions can influence market stability. Future growth will be significantly influenced by the pace of technological advancements in cleaner diesel technologies and the adoption of alternative fuels. Government policies and incentives related to fuel efficiency and emission reduction will also play a pivotal role in shaping the market's future. The market segments (transportation, industrial, and others) will experience different growth trajectories based on their unique dynamics, with transportation maintaining a leading position due to the pervasive use of diesel in heavy-duty vehicles.
Diesel Industry Market Report: 2019-2033
This comprehensive report provides an in-depth analysis of the global diesel industry, encompassing market dynamics, growth trends, regional dominance, product landscape, and future outlook. The report covers the period 2019-2033, with a focus on the forecast period 2025-2033 and a base year of 2025. It caters specifically to industry professionals, investors, and strategists seeking to understand this dynamic market. Market values are presented in million units.
Target Audience: Oil & Gas Companies, Automotive Manufacturers, Transportation Firms, Industrial Users, Government Agencies, Investment Firms.
Parent Market: Energy Market Child Market: Fuel Market
Diesel Industry Market Dynamics & Structure
This section analyzes the intricate structure of the diesel industry, focusing on market concentration, technological advancements, regulatory landscapes, and competitive dynamics. We delve into the influence of mergers and acquisitions (M&A) and the interplay between end-user demographics and market trends.
- Market Concentration: The diesel industry is characterized by a high degree of concentration, with a few major players holding significant market share. The top 10 companies account for approximately xx% of global production. [Specific market share data for each company will be detailed within the full report].
- Technological Innovation: Innovations in fuel efficiency, emission reduction technologies (e.g., selective catalytic reduction - SCR), and biofuels are key drivers of change. However, high R&D costs and regulatory uncertainties pose significant barriers to innovation.
- Regulatory Frameworks: Stringent emission regulations (e.g., Euro standards in Europe, Tier standards in the US) are continuously evolving, impacting fuel formulations and vehicle technologies. These regulations vary across regions, creating complexities for global players.
- Competitive Product Substitutes: The increasing adoption of electric vehicles (EVs) and alternative fuels (e.g., biodiesels, hydrogen) presents a significant competitive challenge to the traditional diesel market. The pace of this substitution will be a key factor influencing future market dynamics.
- End-User Demographics: Transportation remains the dominant end-user segment, followed by industrial applications. The growth of both segments is significantly impacted by economic growth, infrastructural development and regulatory changes.
- M&A Trends: Consolidation through M&A activities has been significant in the past few years, with xx major deals concluded during the historical period, resulting in xx% increase in market concentration. This trend is expected to continue, driven by the need for scale and technological advancements.
Diesel Industry Growth Trends & Insights
This section provides a comprehensive analysis of diesel industry growth trends, encompassing market size evolution, adoption rates, technological disruptions, and evolving consumer behavior. Leveraging proprietary data and industry insights, the report offers a detailed look into the market's trajectory.
[This section will contain a 600-word in-depth analysis based on proprietary data. This analysis will detail market size (in million units) for each year of the study period (2019-2033), showing growth trends with CAGR and market penetration rates for various segments.] For example, the transportation segment will be analyzed based on trucking, shipping, and railway demand, and the industrial sector will be investigated based on its use in heavy machinery, power generation, and agriculture.

Dominant Regions, Countries, or Segments in Diesel Industry
This section identifies the key regions and segments driving market growth.
Dominant Region: [The full report will identify the dominant region (e.g., Asia-Pacific) based on the quantitative data and analysis]. The key drivers of this region's dominance include [specific drivers will be listed and elaborated upon in the full report, e.g., rapid industrialization, expanding transportation infrastructure].
Dominant Segment: The transportation segment is expected to remain the dominant end-user sector throughout the forecast period, with industrial applications showing substantial growth. This growth is linked to [detailed analysis will be provided in the full report focusing on industrial automation, construction, and logistics expansion].
Dominant Countries: [The full report will list the key countries in each region driving growth, including their market share and growth potential, with explanations for their growth.]
Diesel Industry Product Landscape
The diesel industry encompasses a range of products, including various grades of diesel fuel, additives, and blends tailored to specific applications. Recent innovations focus on enhancing fuel efficiency, reducing emissions, and improving performance. These advancements are driven by stringent environmental regulations and the need for improved cost-effectiveness. Key innovations include the development of low-sulfur diesel, biodiesel blends, and advanced engine technologies.
Key Drivers, Barriers & Challenges in Diesel Industry
Key Drivers:
- Increasing industrialization and urbanization in developing economies.
- Growth in global freight transportation.
- Demand from heavy-duty vehicles and machinery.
- Technological advancements in diesel engine efficiency.
Key Challenges & Restraints:
- Stricter emission regulations globally leading to higher production costs.
- Growing competition from alternative fuels (e.g., EVs, biofuels).
- Volatility in crude oil prices impacting diesel pricing.
- Supply chain disruptions impacting availability and pricing. [Quantitative impacts will be shown within the full report].
Emerging Opportunities in Diesel Industry
Emerging opportunities in the diesel industry include:
- Expansion into underserved markets in developing countries.
- Development of advanced biofuels and renewable diesel blends.
- Integration of digital technologies for improved fuel management and efficiency.
- Growth in specialized diesel formulations for niche applications.
Growth Accelerators in the Diesel Industry
Long-term growth in the diesel industry will be driven by technological breakthroughs in emission reduction, strategic partnerships to diversify fuel sources, and expansion into new geographic markets. Investment in research and development of cleaner diesel technologies will be crucial for sustaining market growth.
Key Players Shaping the Diesel Industry Market
- BP plc
- Reliance Industries Ltd
- Exxon Mobil Corporation
- Shell Plc
- PetroChina Company Limited
- NK Rosneft' PAO
- Chevron Corporation
- Saudi Arabian Oil Co
- Qatar Petroleum
- SK energy Co Ltd
Notable Milestones in Diesel Industry Sector
- May 2023: Petrobras' new fuel pricing policy led to a nearly 13% reduction in gasoline and diesel prices in Brazil, impacting market dynamics and consumer behavior.
- February 2023: The European Union's ban on new petrol and diesel cars from 2035 will significantly impact the long-term demand for diesel fuel in Europe.
In-Depth Diesel Industry Market Outlook
The diesel industry faces a complex future. While the transition to alternative fuels will inevitably impact demand, the continued need for heavy-duty vehicles and industrial applications ensures a persistent, albeit potentially smaller, market for diesel fuel. Strategic investments in clean technology, diversification of fuel sources, and adaptation to evolving regulatory landscapes will be critical for ensuring the long-term success of key players. The forecast indicates a [predicted growth percentage]% CAGR for the forecast period, although this will be significantly impacted by the rate of adoption of alternative fuels and government policies.
Diesel Industry Segmentation
-
1. End-User
- 1.1. Transporation
- 1.2. Industrial
- 1.3. Others
Diesel Industry Segmentation By Geography
-
1. North America
- 1.1. United States
- 1.2. Canada
- 1.3. Rest of North America
-
2. Europe
- 2.1. United Kingdom
- 2.2. Russia
- 2.3. Germany
- 2.4. Norway
- 2.5. Rest of Europe
-
3. Asia Pacific
- 3.1. China
- 3.2. India
- 3.3. Indonesia
- 3.4. Malaysia
- 3.5. Vietnam
-
4. Middle East and Africa
- 4.1. Saudi Arabia
- 4.2. United Arab Emirates
- 4.3. South Africa
- 4.4. Nigeria
- 4.5. Egypt
- 4.6. Rest of Middle East and Africa
-
5. South America
- 5.1. Argentina
- 5.2. Brazil
- 5.3. Venezuela
- 5.4. Rest of South America
Diesel Industry REPORT HIGHLIGHTS
| Aspects | Details |
|---|---|
| Study Period | 2019-2033 |
| Base Year | 2024 |
| Estimated Year | 2025 |
| Forecast Period | 2025-2033 |
| Historical Period | 2019-2024 |
| Growth Rate | CAGR of 3.50% from 2019-2033 |
| Segmentation |
|
Table of Contents
- 1. Introduction
- 1.1. Research Scope
- 1.2. Market Segmentation
- 1.3. Research Methodology
- 1.4. Definitions and Assumptions
- 2. Executive Summary
- 2.1. Introduction
- 3. Market Dynamics
- 3.1. Introduction
- 3.2. Market Drivers
- 3.2.1. Increasing Demand from Industrial Applications4.; Growing Infrastructure Across the World
- 3.3. Market Restrains
- 3.3.1. A Rise in Concerns Related to Carbon Emissions and A Shift Towards Electric Vehicles and Renewable Sources of Energy
- 3.4. Market Trends
- 3.4.1. Transportation Segment is to Expected to Dominate in the Market
- 4. Market Factor Analysis
- 4.1. Porters Five Forces
- 4.2. Supply/Value Chain
- 4.3. PESTEL analysis
- 4.4. Market Entropy
- 4.5. Patent/Trademark Analysis
- 5. Global Diesel Industry Analysis, Insights and Forecast, 2019-2031
- 5.1. Market Analysis, Insights and Forecast - by End-User
- 5.1.1. Transporation
- 5.1.2. Industrial
- 5.1.3. Others
- 5.2. Market Analysis, Insights and Forecast - by Region
- 5.2.1. North America
- 5.2.2. Europe
- 5.2.3. Asia Pacific
- 5.2.4. Middle East and Africa
- 5.2.5. South America
- 5.1. Market Analysis, Insights and Forecast - by End-User
- 6. North America Diesel Industry Analysis, Insights and Forecast, 2019-2031
- 6.1. Market Analysis, Insights and Forecast - by End-User
- 6.1.1. Transporation
- 6.1.2. Industrial
- 6.1.3. Others
- 6.1. Market Analysis, Insights and Forecast - by End-User
- 7. Europe Diesel Industry Analysis, Insights and Forecast, 2019-2031
- 7.1. Market Analysis, Insights and Forecast - by End-User
- 7.1.1. Transporation
- 7.1.2. Industrial
- 7.1.3. Others
- 7.1. Market Analysis, Insights and Forecast - by End-User
- 8. Asia Pacific Diesel Industry Analysis, Insights and Forecast, 2019-2031
- 8.1. Market Analysis, Insights and Forecast - by End-User
- 8.1.1. Transporation
- 8.1.2. Industrial
- 8.1.3. Others
- 8.1. Market Analysis, Insights and Forecast - by End-User
- 9. Middle East and Africa Diesel Industry Analysis, Insights and Forecast, 2019-2031
- 9.1. Market Analysis, Insights and Forecast - by End-User
- 9.1.1. Transporation
- 9.1.2. Industrial
- 9.1.3. Others
- 9.1. Market Analysis, Insights and Forecast - by End-User
- 10. South America Diesel Industry Analysis, Insights and Forecast, 2019-2031
- 10.1. Market Analysis, Insights and Forecast - by End-User
- 10.1.1. Transporation
- 10.1.2. Industrial
- 10.1.3. Others
- 10.1. Market Analysis, Insights and Forecast - by End-User
- 11. North America Diesel Industry Analysis, Insights and Forecast, 2019-2031
- 11.1. Market Analysis, Insights and Forecast - By Country/Sub-region
- 11.1.1 United States
- 11.1.2 Canada
- 11.1.3 Mexico
- 12. Europe Diesel Industry Analysis, Insights and Forecast, 2019-2031
- 12.1. Market Analysis, Insights and Forecast - By Country/Sub-region
- 12.1.1 Germany
- 12.1.2 United Kingdom
- 12.1.3 France
- 12.1.4 Spain
- 12.1.5 Italy
- 12.1.6 Spain
- 12.1.7 Belgium
- 12.1.8 Netherland
- 12.1.9 Nordics
- 12.1.10 Rest of Europe
- 13. Asia Pacific Diesel Industry Analysis, Insights and Forecast, 2019-2031
- 13.1. Market Analysis, Insights and Forecast - By Country/Sub-region
- 13.1.1 China
- 13.1.2 Japan
- 13.1.3 India
- 13.1.4 South Korea
- 13.1.5 Southeast Asia
- 13.1.6 Australia
- 13.1.7 Indonesia
- 13.1.8 Phillipes
- 13.1.9 Singapore
- 13.1.10 Thailandc
- 13.1.11 Rest of Asia Pacific
- 14. South America Diesel Industry Analysis, Insights and Forecast, 2019-2031
- 14.1. Market Analysis, Insights and Forecast - By Country/Sub-region
- 14.1.1 Brazil
- 14.1.2 Argentina
- 14.1.3 Peru
- 14.1.4 Chile
- 14.1.5 Colombia
- 14.1.6 Ecuador
- 14.1.7 Venezuela
- 14.1.8 Rest of South America
- 15. North America Diesel Industry Analysis, Insights and Forecast, 2019-2031
- 15.1. Market Analysis, Insights and Forecast - By Country/Sub-region
- 15.1.1 United States
- 15.1.2 Canada
- 15.1.3 Mexico
- 16. MEA Diesel Industry Analysis, Insights and Forecast, 2019-2031
- 16.1. Market Analysis, Insights and Forecast - By Country/Sub-region
- 16.1.1 United Arab Emirates
- 16.1.2 Saudi Arabia
- 16.1.3 South Africa
- 16.1.4 Rest of Middle East and Africa
- 17. Competitive Analysis
- 17.1. Global Market Share Analysis 2024
- 17.2. Company Profiles
- 17.2.1 BP plc*List Not Exhaustive
- 17.2.1.1. Overview
- 17.2.1.2. Products
- 17.2.1.3. SWOT Analysis
- 17.2.1.4. Recent Developments
- 17.2.1.5. Financials (Based on Availability)
- 17.2.2 Reliance Industries Ltd
- 17.2.2.1. Overview
- 17.2.2.2. Products
- 17.2.2.3. SWOT Analysis
- 17.2.2.4. Recent Developments
- 17.2.2.5. Financials (Based on Availability)
- 17.2.3 Exxon Mobil Corporation
- 17.2.3.1. Overview
- 17.2.3.2. Products
- 17.2.3.3. SWOT Analysis
- 17.2.3.4. Recent Developments
- 17.2.3.5. Financials (Based on Availability)
- 17.2.4 Shell Plc
- 17.2.4.1. Overview
- 17.2.4.2. Products
- 17.2.4.3. SWOT Analysis
- 17.2.4.4. Recent Developments
- 17.2.4.5. Financials (Based on Availability)
- 17.2.5 PetroChina Company Limited
- 17.2.5.1. Overview
- 17.2.5.2. Products
- 17.2.5.3. SWOT Analysis
- 17.2.5.4. Recent Developments
- 17.2.5.5. Financials (Based on Availability)
- 17.2.6 NK Rosneft' PAO
- 17.2.6.1. Overview
- 17.2.6.2. Products
- 17.2.6.3. SWOT Analysis
- 17.2.6.4. Recent Developments
- 17.2.6.5. Financials (Based on Availability)
- 17.2.7 Chevron Corporation
- 17.2.7.1. Overview
- 17.2.7.2. Products
- 17.2.7.3. SWOT Analysis
- 17.2.7.4. Recent Developments
- 17.2.7.5. Financials (Based on Availability)
- 17.2.8 Saudi Arabian Oil Co
- 17.2.8.1. Overview
- 17.2.8.2. Products
- 17.2.8.3. SWOT Analysis
- 17.2.8.4. Recent Developments
- 17.2.8.5. Financials (Based on Availability)
- 17.2.9 Qatar Petroleum
- 17.2.9.1. Overview
- 17.2.9.2. Products
- 17.2.9.3. SWOT Analysis
- 17.2.9.4. Recent Developments
- 17.2.9.5. Financials (Based on Availability)
- 17.2.10 SK energy Co Ltd
- 17.2.10.1. Overview
- 17.2.10.2. Products
- 17.2.10.3. SWOT Analysis
- 17.2.10.4. Recent Developments
- 17.2.10.5. Financials (Based on Availability)
- 17.2.1 BP plc*List Not Exhaustive
List of Figures
- Figure 1: Global Diesel Industry Revenue Breakdown (Million, %) by Region 2024 & 2032
- Figure 2: Global Diesel Industry Volume Breakdown (Litre, %) by Region 2024 & 2032
- Figure 3: North America Diesel Industry Revenue (Million), by Country 2024 & 2032
- Figure 4: North America Diesel Industry Volume (Litre), by Country 2024 & 2032
- Figure 5: North America Diesel Industry Revenue Share (%), by Country 2024 & 2032
- Figure 6: North America Diesel Industry Volume Share (%), by Country 2024 & 2032
- Figure 7: Europe Diesel Industry Revenue (Million), by Country 2024 & 2032
- Figure 8: Europe Diesel Industry Volume (Litre), by Country 2024 & 2032
- Figure 9: Europe Diesel Industry Revenue Share (%), by Country 2024 & 2032
- Figure 10: Europe Diesel Industry Volume Share (%), by Country 2024 & 2032
- Figure 11: Asia Pacific Diesel Industry Revenue (Million), by Country 2024 & 2032
- Figure 12: Asia Pacific Diesel Industry Volume (Litre), by Country 2024 & 2032
- Figure 13: Asia Pacific Diesel Industry Revenue Share (%), by Country 2024 & 2032
- Figure 14: Asia Pacific Diesel Industry Volume Share (%), by Country 2024 & 2032
- Figure 15: South America Diesel Industry Revenue (Million), by Country 2024 & 2032
- Figure 16: South America Diesel Industry Volume (Litre), by Country 2024 & 2032
- Figure 17: South America Diesel Industry Revenue Share (%), by Country 2024 & 2032
- Figure 18: South America Diesel Industry Volume Share (%), by Country 2024 & 2032
- Figure 19: North America Diesel Industry Revenue (Million), by Country 2024 & 2032
- Figure 20: North America Diesel Industry Volume (Litre), by Country 2024 & 2032
- Figure 21: North America Diesel Industry Revenue Share (%), by Country 2024 & 2032
- Figure 22: North America Diesel Industry Volume Share (%), by Country 2024 & 2032
- Figure 23: MEA Diesel Industry Revenue (Million), by Country 2024 & 2032
- Figure 24: MEA Diesel Industry Volume (Litre), by Country 2024 & 2032
- Figure 25: MEA Diesel Industry Revenue Share (%), by Country 2024 & 2032
- Figure 26: MEA Diesel Industry Volume Share (%), by Country 2024 & 2032
- Figure 27: North America Diesel Industry Revenue (Million), by End-User 2024 & 2032
- Figure 28: North America Diesel Industry Volume (Litre), by End-User 2024 & 2032
- Figure 29: North America Diesel Industry Revenue Share (%), by End-User 2024 & 2032
- Figure 30: North America Diesel Industry Volume Share (%), by End-User 2024 & 2032
- Figure 31: North America Diesel Industry Revenue (Million), by Country 2024 & 2032
- Figure 32: North America Diesel Industry Volume (Litre), by Country 2024 & 2032
- Figure 33: North America Diesel Industry Revenue Share (%), by Country 2024 & 2032
- Figure 34: North America Diesel Industry Volume Share (%), by Country 2024 & 2032
- Figure 35: Europe Diesel Industry Revenue (Million), by End-User 2024 & 2032
- Figure 36: Europe Diesel Industry Volume (Litre), by End-User 2024 & 2032
- Figure 37: Europe Diesel Industry Revenue Share (%), by End-User 2024 & 2032
- Figure 38: Europe Diesel Industry Volume Share (%), by End-User 2024 & 2032
- Figure 39: Europe Diesel Industry Revenue (Million), by Country 2024 & 2032
- Figure 40: Europe Diesel Industry Volume (Litre), by Country 2024 & 2032
- Figure 41: Europe Diesel Industry Revenue Share (%), by Country 2024 & 2032
- Figure 42: Europe Diesel Industry Volume Share (%), by Country 2024 & 2032
- Figure 43: Asia Pacific Diesel Industry Revenue (Million), by End-User 2024 & 2032
- Figure 44: Asia Pacific Diesel Industry Volume (Litre), by End-User 2024 & 2032
- Figure 45: Asia Pacific Diesel Industry Revenue Share (%), by End-User 2024 & 2032
- Figure 46: Asia Pacific Diesel Industry Volume Share (%), by End-User 2024 & 2032
- Figure 47: Asia Pacific Diesel Industry Revenue (Million), by Country 2024 & 2032
- Figure 48: Asia Pacific Diesel Industry Volume (Litre), by Country 2024 & 2032
- Figure 49: Asia Pacific Diesel Industry Revenue Share (%), by Country 2024 & 2032
- Figure 50: Asia Pacific Diesel Industry Volume Share (%), by Country 2024 & 2032
- Figure 51: Middle East and Africa Diesel Industry Revenue (Million), by End-User 2024 & 2032
- Figure 52: Middle East and Africa Diesel Industry Volume (Litre), by End-User 2024 & 2032
- Figure 53: Middle East and Africa Diesel Industry Revenue Share (%), by End-User 2024 & 2032
- Figure 54: Middle East and Africa Diesel Industry Volume Share (%), by End-User 2024 & 2032
- Figure 55: Middle East and Africa Diesel Industry Revenue (Million), by Country 2024 & 2032
- Figure 56: Middle East and Africa Diesel Industry Volume (Litre), by Country 2024 & 2032
- Figure 57: Middle East and Africa Diesel Industry Revenue Share (%), by Country 2024 & 2032
- Figure 58: Middle East and Africa Diesel Industry Volume Share (%), by Country 2024 & 2032
- Figure 59: South America Diesel Industry Revenue (Million), by End-User 2024 & 2032
- Figure 60: South America Diesel Industry Volume (Litre), by End-User 2024 & 2032
- Figure 61: South America Diesel Industry Revenue Share (%), by End-User 2024 & 2032
- Figure 62: South America Diesel Industry Volume Share (%), by End-User 2024 & 2032
- Figure 63: South America Diesel Industry Revenue (Million), by Country 2024 & 2032
- Figure 64: South America Diesel Industry Volume (Litre), by Country 2024 & 2032
- Figure 65: South America Diesel Industry Revenue Share (%), by Country 2024 & 2032
- Figure 66: South America Diesel Industry Volume Share (%), by Country 2024 & 2032
List of Tables
- Table 1: Global Diesel Industry Revenue Million Forecast, by Region 2019 & 2032
- Table 2: Global Diesel Industry Volume Litre Forecast, by Region 2019 & 2032
- Table 3: Global Diesel Industry Revenue Million Forecast, by End-User 2019 & 2032
- Table 4: Global Diesel Industry Volume Litre Forecast, by End-User 2019 & 2032
- Table 5: Global Diesel Industry Revenue Million Forecast, by Region 2019 & 2032
- Table 6: Global Diesel Industry Volume Litre Forecast, by Region 2019 & 2032
- Table 7: Global Diesel Industry Revenue Million Forecast, by Country 2019 & 2032
- Table 8: Global Diesel Industry Volume Litre Forecast, by Country 2019 & 2032
- Table 9: United States Diesel Industry Revenue (Million) Forecast, by Application 2019 & 2032
- Table 10: United States Diesel Industry Volume (Litre) Forecast, by Application 2019 & 2032
- Table 11: Canada Diesel Industry Revenue (Million) Forecast, by Application 2019 & 2032
- Table 12: Canada Diesel Industry Volume (Litre) Forecast, by Application 2019 & 2032
- Table 13: Mexico Diesel Industry Revenue (Million) Forecast, by Application 2019 & 2032
- Table 14: Mexico Diesel Industry Volume (Litre) Forecast, by Application 2019 & 2032
- Table 15: Global Diesel Industry Revenue Million Forecast, by Country 2019 & 2032
- Table 16: Global Diesel Industry Volume Litre Forecast, by Country 2019 & 2032
- Table 17: Germany Diesel Industry Revenue (Million) Forecast, by Application 2019 & 2032
- Table 18: Germany Diesel Industry Volume (Litre) Forecast, by Application 2019 & 2032
- Table 19: United Kingdom Diesel Industry Revenue (Million) Forecast, by Application 2019 & 2032
- Table 20: United Kingdom Diesel Industry Volume (Litre) Forecast, by Application 2019 & 2032
- Table 21: France Diesel Industry Revenue (Million) Forecast, by Application 2019 & 2032
- Table 22: France Diesel Industry Volume (Litre) Forecast, by Application 2019 & 2032
- Table 23: Spain Diesel Industry Revenue (Million) Forecast, by Application 2019 & 2032
- Table 24: Spain Diesel Industry Volume (Litre) Forecast, by Application 2019 & 2032
- Table 25: Italy Diesel Industry Revenue (Million) Forecast, by Application 2019 & 2032
- Table 26: Italy Diesel Industry Volume (Litre) Forecast, by Application 2019 & 2032
- Table 27: Spain Diesel Industry Revenue (Million) Forecast, by Application 2019 & 2032
- Table 28: Spain Diesel Industry Volume (Litre) Forecast, by Application 2019 & 2032
- Table 29: Belgium Diesel Industry Revenue (Million) Forecast, by Application 2019 & 2032
- Table 30: Belgium Diesel Industry Volume (Litre) Forecast, by Application 2019 & 2032
- Table 31: Netherland Diesel Industry Revenue (Million) Forecast, by Application 2019 & 2032
- Table 32: Netherland Diesel Industry Volume (Litre) Forecast, by Application 2019 & 2032
- Table 33: Nordics Diesel Industry Revenue (Million) Forecast, by Application 2019 & 2032
- Table 34: Nordics Diesel Industry Volume (Litre) Forecast, by Application 2019 & 2032
- Table 35: Rest of Europe Diesel Industry Revenue (Million) Forecast, by Application 2019 & 2032
- Table 36: Rest of Europe Diesel Industry Volume (Litre) Forecast, by Application 2019 & 2032
- Table 37: Global Diesel Industry Revenue Million Forecast, by Country 2019 & 2032
- Table 38: Global Diesel Industry Volume Litre Forecast, by Country 2019 & 2032
- Table 39: China Diesel Industry Revenue (Million) Forecast, by Application 2019 & 2032
- Table 40: China Diesel Industry Volume (Litre) Forecast, by Application 2019 & 2032
- Table 41: Japan Diesel Industry Revenue (Million) Forecast, by Application 2019 & 2032
- Table 42: Japan Diesel Industry Volume (Litre) Forecast, by Application 2019 & 2032
- Table 43: India Diesel Industry Revenue (Million) Forecast, by Application 2019 & 2032
- Table 44: India Diesel Industry Volume (Litre) Forecast, by Application 2019 & 2032
- Table 45: South Korea Diesel Industry Revenue (Million) Forecast, by Application 2019 & 2032
- Table 46: South Korea Diesel Industry Volume (Litre) Forecast, by Application 2019 & 2032
- Table 47: Southeast Asia Diesel Industry Revenue (Million) Forecast, by Application 2019 & 2032
- Table 48: Southeast Asia Diesel Industry Volume (Litre) Forecast, by Application 2019 & 2032
- Table 49: Australia Diesel Industry Revenue (Million) Forecast, by Application 2019 & 2032
- Table 50: Australia Diesel Industry Volume (Litre) Forecast, by Application 2019 & 2032
- Table 51: Indonesia Diesel Industry Revenue (Million) Forecast, by Application 2019 & 2032
- Table 52: Indonesia Diesel Industry Volume (Litre) Forecast, by Application 2019 & 2032
- Table 53: Phillipes Diesel Industry Revenue (Million) Forecast, by Application 2019 & 2032
- Table 54: Phillipes Diesel Industry Volume (Litre) Forecast, by Application 2019 & 2032
- Table 55: Singapore Diesel Industry Revenue (Million) Forecast, by Application 2019 & 2032
- Table 56: Singapore Diesel Industry Volume (Litre) Forecast, by Application 2019 & 2032
- Table 57: Thailandc Diesel Industry Revenue (Million) Forecast, by Application 2019 & 2032
- Table 58: Thailandc Diesel Industry Volume (Litre) Forecast, by Application 2019 & 2032
- Table 59: Rest of Asia Pacific Diesel Industry Revenue (Million) Forecast, by Application 2019 & 2032
- Table 60: Rest of Asia Pacific Diesel Industry Volume (Litre) Forecast, by Application 2019 & 2032
- Table 61: Global Diesel Industry Revenue Million Forecast, by Country 2019 & 2032
- Table 62: Global Diesel Industry Volume Litre Forecast, by Country 2019 & 2032
- Table 63: Brazil Diesel Industry Revenue (Million) Forecast, by Application 2019 & 2032
- Table 64: Brazil Diesel Industry Volume (Litre) Forecast, by Application 2019 & 2032
- Table 65: Argentina Diesel Industry Revenue (Million) Forecast, by Application 2019 & 2032
- Table 66: Argentina Diesel Industry Volume (Litre) Forecast, by Application 2019 & 2032
- Table 67: Peru Diesel Industry Revenue (Million) Forecast, by Application 2019 & 2032
- Table 68: Peru Diesel Industry Volume (Litre) Forecast, by Application 2019 & 2032
- Table 69: Chile Diesel Industry Revenue (Million) Forecast, by Application 2019 & 2032
- Table 70: Chile Diesel Industry Volume (Litre) Forecast, by Application 2019 & 2032
- Table 71: Colombia Diesel Industry Revenue (Million) Forecast, by Application 2019 & 2032
- Table 72: Colombia Diesel Industry Volume (Litre) Forecast, by Application 2019 & 2032
- Table 73: Ecuador Diesel Industry Revenue (Million) Forecast, by Application 2019 & 2032
- Table 74: Ecuador Diesel Industry Volume (Litre) Forecast, by Application 2019 & 2032
- Table 75: Venezuela Diesel Industry Revenue (Million) Forecast, by Application 2019 & 2032
- Table 76: Venezuela Diesel Industry Volume (Litre) Forecast, by Application 2019 & 2032
- Table 77: Rest of South America Diesel Industry Revenue (Million) Forecast, by Application 2019 & 2032
- Table 78: Rest of South America Diesel Industry Volume (Litre) Forecast, by Application 2019 & 2032
- Table 79: Global Diesel Industry Revenue Million Forecast, by Country 2019 & 2032
- Table 80: Global Diesel Industry Volume Litre Forecast, by Country 2019 & 2032
- Table 81: United States Diesel Industry Revenue (Million) Forecast, by Application 2019 & 2032
- Table 82: United States Diesel Industry Volume (Litre) Forecast, by Application 2019 & 2032
- Table 83: Canada Diesel Industry Revenue (Million) Forecast, by Application 2019 & 2032
- Table 84: Canada Diesel Industry Volume (Litre) Forecast, by Application 2019 & 2032
- Table 85: Mexico Diesel Industry Revenue (Million) Forecast, by Application 2019 & 2032
- Table 86: Mexico Diesel Industry Volume (Litre) Forecast, by Application 2019 & 2032
- Table 87: Global Diesel Industry Revenue Million Forecast, by Country 2019 & 2032
- Table 88: Global Diesel Industry Volume Litre Forecast, by Country 2019 & 2032
- Table 89: United Arab Emirates Diesel Industry Revenue (Million) Forecast, by Application 2019 & 2032
- Table 90: United Arab Emirates Diesel Industry Volume (Litre) Forecast, by Application 2019 & 2032
- Table 91: Saudi Arabia Diesel Industry Revenue (Million) Forecast, by Application 2019 & 2032
- Table 92: Saudi Arabia Diesel Industry Volume (Litre) Forecast, by Application 2019 & 2032
- Table 93: South Africa Diesel Industry Revenue (Million) Forecast, by Application 2019 & 2032
- Table 94: South Africa Diesel Industry Volume (Litre) Forecast, by Application 2019 & 2032
- Table 95: Rest of Middle East and Africa Diesel Industry Revenue (Million) Forecast, by Application 2019 & 2032
- Table 96: Rest of Middle East and Africa Diesel Industry Volume (Litre) Forecast, by Application 2019 & 2032
- Table 97: Global Diesel Industry Revenue Million Forecast, by End-User 2019 & 2032
- Table 98: Global Diesel Industry Volume Litre Forecast, by End-User 2019 & 2032
- Table 99: Global Diesel Industry Revenue Million Forecast, by Country 2019 & 2032
- Table 100: Global Diesel Industry Volume Litre Forecast, by Country 2019 & 2032
- Table 101: United States Diesel Industry Revenue (Million) Forecast, by Application 2019 & 2032
- Table 102: United States Diesel Industry Volume (Litre) Forecast, by Application 2019 & 2032
- Table 103: Canada Diesel Industry Revenue (Million) Forecast, by Application 2019 & 2032
- Table 104: Canada Diesel Industry Volume (Litre) Forecast, by Application 2019 & 2032
- Table 105: Rest of North America Diesel Industry Revenue (Million) Forecast, by Application 2019 & 2032
- Table 106: Rest of North America Diesel Industry Volume (Litre) Forecast, by Application 2019 & 2032
- Table 107: Global Diesel Industry Revenue Million Forecast, by End-User 2019 & 2032
- Table 108: Global Diesel Industry Volume Litre Forecast, by End-User 2019 & 2032
- Table 109: Global Diesel Industry Revenue Million Forecast, by Country 2019 & 2032
- Table 110: Global Diesel Industry Volume Litre Forecast, by Country 2019 & 2032
- Table 111: United Kingdom Diesel Industry Revenue (Million) Forecast, by Application 2019 & 2032
- Table 112: United Kingdom Diesel Industry Volume (Litre) Forecast, by Application 2019 & 2032
- Table 113: Russia Diesel Industry Revenue (Million) Forecast, by Application 2019 & 2032
- Table 114: Russia Diesel Industry Volume (Litre) Forecast, by Application 2019 & 2032
- Table 115: Germany Diesel Industry Revenue (Million) Forecast, by Application 2019 & 2032
- Table 116: Germany Diesel Industry Volume (Litre) Forecast, by Application 2019 & 2032
- Table 117: Norway Diesel Industry Revenue (Million) Forecast, by Application 2019 & 2032
- Table 118: Norway Diesel Industry Volume (Litre) Forecast, by Application 2019 & 2032
- Table 119: Rest of Europe Diesel Industry Revenue (Million) Forecast, by Application 2019 & 2032
- Table 120: Rest of Europe Diesel Industry Volume (Litre) Forecast, by Application 2019 & 2032
- Table 121: Global Diesel Industry Revenue Million Forecast, by End-User 2019 & 2032
- Table 122: Global Diesel Industry Volume Litre Forecast, by End-User 2019 & 2032
- Table 123: Global Diesel Industry Revenue Million Forecast, by Country 2019 & 2032
- Table 124: Global Diesel Industry Volume Litre Forecast, by Country 2019 & 2032
- Table 125: China Diesel Industry Revenue (Million) Forecast, by Application 2019 & 2032
- Table 126: China Diesel Industry Volume (Litre) Forecast, by Application 2019 & 2032
- Table 127: India Diesel Industry Revenue (Million) Forecast, by Application 2019 & 2032
- Table 128: India Diesel Industry Volume (Litre) Forecast, by Application 2019 & 2032
- Table 129: Indonesia Diesel Industry Revenue (Million) Forecast, by Application 2019 & 2032
- Table 130: Indonesia Diesel Industry Volume (Litre) Forecast, by Application 2019 & 2032
- Table 131: Malaysia Diesel Industry Revenue (Million) Forecast, by Application 2019 & 2032
- Table 132: Malaysia Diesel Industry Volume (Litre) Forecast, by Application 2019 & 2032
- Table 133: Vietnam Diesel Industry Revenue (Million) Forecast, by Application 2019 & 2032
- Table 134: Vietnam Diesel Industry Volume (Litre) Forecast, by Application 2019 & 2032
- Table 135: Global Diesel Industry Revenue Million Forecast, by End-User 2019 & 2032
- Table 136: Global Diesel Industry Volume Litre Forecast, by End-User 2019 & 2032
- Table 137: Global Diesel Industry Revenue Million Forecast, by Country 2019 & 2032
- Table 138: Global Diesel Industry Volume Litre Forecast, by Country 2019 & 2032
- Table 139: Saudi Arabia Diesel Industry Revenue (Million) Forecast, by Application 2019 & 2032
- Table 140: Saudi Arabia Diesel Industry Volume (Litre) Forecast, by Application 2019 & 2032
- Table 141: United Arab Emirates Diesel Industry Revenue (Million) Forecast, by Application 2019 & 2032
- Table 142: United Arab Emirates Diesel Industry Volume (Litre) Forecast, by Application 2019 & 2032
- Table 143: South Africa Diesel Industry Revenue (Million) Forecast, by Application 2019 & 2032
- Table 144: South Africa Diesel Industry Volume (Litre) Forecast, by Application 2019 & 2032
- Table 145: Nigeria Diesel Industry Revenue (Million) Forecast, by Application 2019 & 2032
- Table 146: Nigeria Diesel Industry Volume (Litre) Forecast, by Application 2019 & 2032
- Table 147: Egypt Diesel Industry Revenue (Million) Forecast, by Application 2019 & 2032
- Table 148: Egypt Diesel Industry Volume (Litre) Forecast, by Application 2019 & 2032
- Table 149: Rest of Middle East and Africa Diesel Industry Revenue (Million) Forecast, by Application 2019 & 2032
- Table 150: Rest of Middle East and Africa Diesel Industry Volume (Litre) Forecast, by Application 2019 & 2032
- Table 151: Global Diesel Industry Revenue Million Forecast, by End-User 2019 & 2032
- Table 152: Global Diesel Industry Volume Litre Forecast, by End-User 2019 & 2032
- Table 153: Global Diesel Industry Revenue Million Forecast, by Country 2019 & 2032
- Table 154: Global Diesel Industry Volume Litre Forecast, by Country 2019 & 2032
- Table 155: Argentina Diesel Industry Revenue (Million) Forecast, by Application 2019 & 2032
- Table 156: Argentina Diesel Industry Volume (Litre) Forecast, by Application 2019 & 2032
- Table 157: Brazil Diesel Industry Revenue (Million) Forecast, by Application 2019 & 2032
- Table 158: Brazil Diesel Industry Volume (Litre) Forecast, by Application 2019 & 2032
- Table 159: Venezuela Diesel Industry Revenue (Million) Forecast, by Application 2019 & 2032
- Table 160: Venezuela Diesel Industry Volume (Litre) Forecast, by Application 2019 & 2032
- Table 161: Rest of South America Diesel Industry Revenue (Million) Forecast, by Application 2019 & 2032
- Table 162: Rest of South America Diesel Industry Volume (Litre) Forecast, by Application 2019 & 2032
Frequently Asked Questions
1. What is the projected Compound Annual Growth Rate (CAGR) of the Diesel Industry?
The projected CAGR is approximately 3.50%.
2. Which companies are prominent players in the Diesel Industry?
Key companies in the market include BP plc*List Not Exhaustive, Reliance Industries Ltd, Exxon Mobil Corporation, Shell Plc, PetroChina Company Limited, NK Rosneft' PAO, Chevron Corporation, Saudi Arabian Oil Co, Qatar Petroleum, SK energy Co Ltd.
3. What are the main segments of the Diesel Industry?
The market segments include End-User.
4. Can you provide details about the market size?
The market size is estimated to be USD 244.26 Million as of 2022.
5. What are some drivers contributing to market growth?
Increasing Demand from Industrial Applications4.; Growing Infrastructure Across the World.
6. What are the notable trends driving market growth?
Transportation Segment is to Expected to Dominate in the Market.
7. Are there any restraints impacting market growth?
A Rise in Concerns Related to Carbon Emissions and A Shift Towards Electric Vehicles and Renewable Sources of Energy.
8. Can you provide examples of recent developments in the market?
May 2023: Petrobras, the state oil company of Brazil, gave the green light to a revised fuel pricing policy that will result in significant cost reductions for drivers. As per the newly approved strategy, gasoline, and diesel prices will experience a considerable decline, with a nearly 13% reduction.
9. What pricing options are available for accessing the report?
Pricing options include single-user, multi-user, and enterprise licenses priced at USD 4750, USD 5250, and USD 8750 respectively.
10. Is the market size provided in terms of value or volume?
The market size is provided in terms of value, measured in Million and volume, measured in Litre.
11. Are there any specific market keywords associated with the report?
Yes, the market keyword associated with the report is "Diesel Industry," which aids in identifying and referencing the specific market segment covered.
12. How do I determine which pricing option suits my needs best?
The pricing options vary based on user requirements and access needs. Individual users may opt for single-user licenses, while businesses requiring broader access may choose multi-user or enterprise licenses for cost-effective access to the report.
13. Are there any additional resources or data provided in the Diesel Industry report?
While the report offers comprehensive insights, it's advisable to review the specific contents or supplementary materials provided to ascertain if additional resources or data are available.
14. How can I stay updated on further developments or reports in the Diesel Industry?
To stay informed about further developments, trends, and reports in the Diesel Industry, consider subscribing to industry newsletters, following relevant companies and organizations, or regularly checking reputable industry news sources and publications.
Methodology
Step 1 - Identification of Relevant Samples Size from Population Database


Step 2 - Approaches for Defining Global Market Size (Value, Volume* & Price*)

Note*: In applicable scenarios
Step 3 - Data Sources
Primary Research
- Web Analytics
- Survey Reports
- Research Institute
- Latest Research Reports
- Opinion Leaders
Secondary Research
- Annual Reports
- White Paper
- Latest Press Release
- Industry Association
- Paid Database
- Investor Presentations

Step 4 - Data Triangulation
Involves using different sources of information in order to increase the validity of a study
These sources are likely to be stakeholders in a program - participants, other researchers, program staff, other community members, and so on.
Then we put all data in single framework & apply various statistical tools to find out the dynamic on the market.
During the analysis stage, feedback from the stakeholder groups would be compared to determine areas of agreement as well as areas of divergence
