

Key Insights
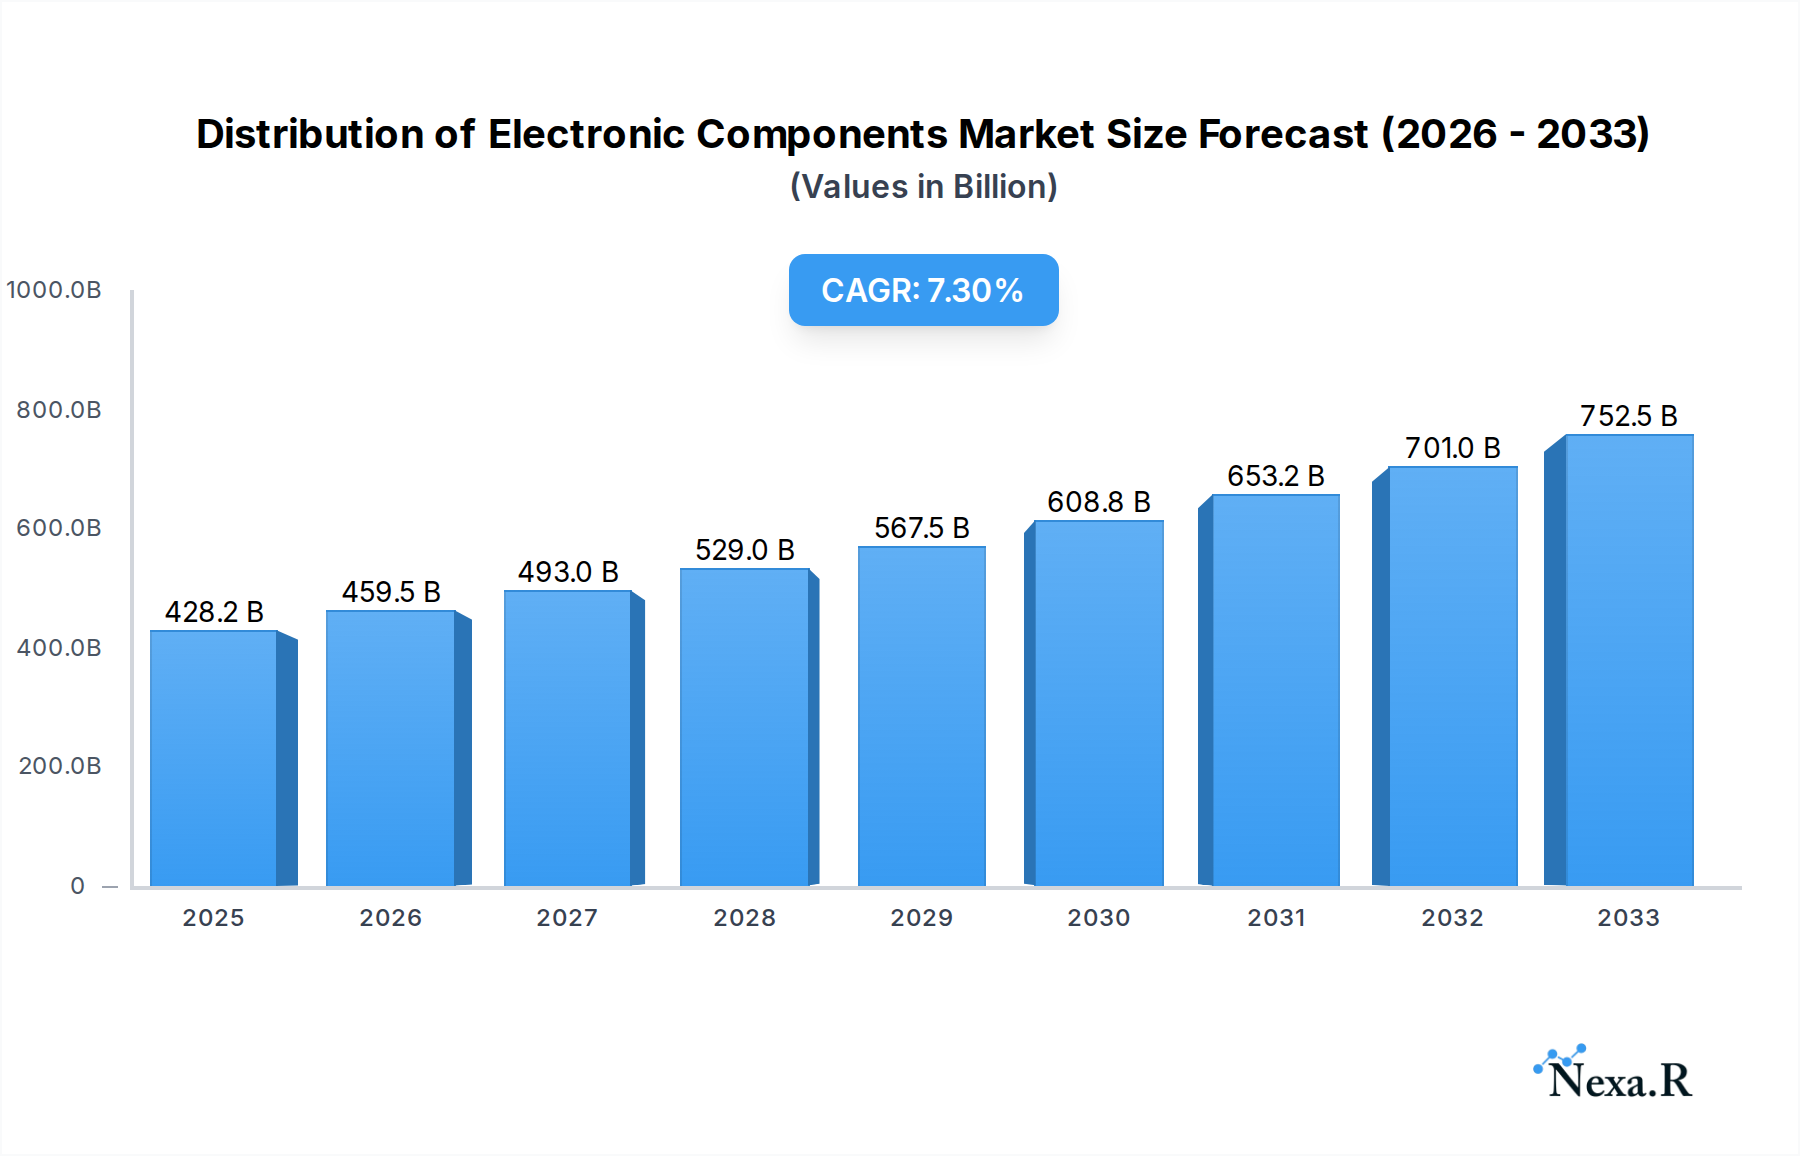
The global market for Electronic Components Distribution is poised for robust growth, driven by an accelerating demand across key sectors such as electronics, industrial automation, and burgeoning medical technology. The market is projected to reach a significant $428.22 billion in 2025, expanding at a compound annual growth rate (CAGR) of 7.36% through 2033. This expansion is fueled by the relentless innovation in consumer electronics, the increasing adoption of smart technologies in industrial settings, and the critical role of advanced components in modern healthcare devices. The proliferation of the Internet of Things (IoT), advancements in artificial intelligence (AI), and the growing need for sophisticated semiconductor solutions are all major catalysts propelling this market forward. Furthermore, the ongoing digital transformation across various industries necessitates a constant supply of diverse and high-performance electronic components, ensuring a sustained demand for distribution services.

Distribution of Electronic Components Market Size (In Billion)
The market landscape is characterized by a dynamic interplay of growth drivers and challenges. While the increasing complexity of supply chains and the need for specialized technical support present opportunities for value-added distributors, component shortages and geopolitical uncertainties pose potential restraints. The market segmentation reveals a strong reliance on Active Components, which are integral to the functionality of nearly all electronic devices. However, the consistent demand for Passive Components also underscores their foundational importance in circuit design. Geographically, Asia Pacific is anticipated to lead the market due to its extensive manufacturing base and a rapidly growing consumer electronics market. North America and Europe remain significant markets, driven by advanced technological adoption and a strong industrial base. Key players are increasingly focusing on enhancing their digital platforms, expanding their product portfolios, and strengthening their logistics networks to cater to the evolving needs of a diverse customer base.
Distribution of Electronic Components Company Market Share
Unlocking Growth: A Comprehensive Report on the Global Distribution of Electronic Components Market (2019-2033)
This in-depth report provides an indispensable analysis of the global distribution of electronic components market, a critical backbone for the electronics industry, industrial electronics, and emerging sectors like medical electronics. Covering the period from 2019 to 2033, with a base year of 2025, this research delves into market dynamics, growth trends, regional dominance, product landscapes, key players, and future opportunities. We offer granular insights into the Active Components and Passive Components segments, vital for understanding the intricate supply chains of modern technology.
Distribution of Electronic Components Market Dynamics & Structure
The distribution of electronic components market exhibits a moderate to high degree of concentration, with leading distributors like Arrow Electronics, WPG Holdings, Avnet, and WT Microelectronics holding significant market shares. Technological innovation remains a primary driver, fueled by advancements in semiconductor distribution, IoT devices, AI, and 5G infrastructure. Regulatory frameworks, particularly concerning trade policies, environmental standards, and component traceability, are increasingly influencing operational strategies. Competitive product substitutes, though present, are often nuanced, with distributors focusing on value-added services, technical support, and supply chain optimization rather than direct product competition. End-user demographics are diversifying, with a growing demand from the industrial automation, automotive, and consumer electronics sectors. Mergers and acquisitions (M&A) are a notable trend, with companies like TTI, Smith, and MOUSER strategically acquiring smaller players or complementary businesses to expand their geographical reach and service portfolios. For instance, recent M&A activities have seen an approximate increase of 15% in deal volume over the past five years, reflecting a consolidation drive. Innovation barriers include the high capital expenditure for advanced warehousing and logistics, as well as the continuous need for specialized technical expertise to support complex component ecosystems.
Distribution of Electronic Components Growth Trends & Insights
The electronic component distribution market is poised for substantial expansion driven by the escalating demand for advanced electronic devices across all sectors. The global electronic components market size is projected to witness a Compound Annual Growth Rate (CAGR) of approximately 6.5% during the forecast period (2025-2033). This growth is underpinned by several transformative trends. Firstly, the ubiquitous adoption of the Internet of Things (IoT) is creating an insatiable appetite for microcontrollers, sensors, and communication modules, boosting the demand for active components distribution. Secondly, the relentless push towards miniaturization and energy efficiency in consumer electronics and mobile devices is driving innovation in passive component distribution, such as capacitors and resistors. Furthermore, the burgeoning electric vehicle (EV) market, with its complex power management and control systems, represents a significant growth engine, requiring specialized electronic components and robust distribution networks. Consumer behavior is shifting towards a preference for integrated solutions and faster product development cycles, compelling distributors to offer more comprehensive design support and rapid prototyping services. The electronic component supply chain is also experiencing a paradigm shift, with a growing emphasis on resilience and transparency, catalyzed by recent global disruptions. The penetration of specialized distribution services, including kitting, programming, and testing, is expected to rise by an estimated 20% over the next decade, enhancing the value proposition for manufacturers and end-users alike. The increasing complexity of Bill of Materials (BOM) management is also creating opportunities for distributors to offer advanced software solutions and analytics, further streamlining procurement processes for businesses across the industrial electronics and medical electronics segments. The shift towards Industry 4.0 is accelerating the demand for automation components, predictive maintenance solutions, and sophisticated control systems, all of which rely heavily on a steady and reliable supply of electronic components.
Dominant Regions, Countries, or Segments in Distribution of Electronic Components
The Asia Pacific region is unequivocally the dominant force in the distribution of electronic components market, driven by its position as a global manufacturing hub and its burgeoning domestic demand. Countries like China, South Korea, Taiwan, and Japan are not only major producers but also significant consumers of electronic components. This dominance is further amplified by robust government initiatives supporting the semiconductor and electronics manufacturing sectors, along with substantial investments in research and development. The electronic application segment within this region is the primary growth driver, encompassing consumer electronics, telecommunications, and computing. The market share of electronic applications in the Asia Pacific distribution of electronic components is estimated at approximately 55%, with a projected growth rate of 7.2% CAGR. Within the Types segmentation, Active Components continue to command a larger market share, estimated at around 60% of the total market value in the region, due to the increasing complexity of modern electronic devices and the proliferation of semiconductors. However, the Passive Components segment is also experiencing significant growth, fueled by the miniaturization trends and the demand for higher performance in various applications. The region's extensive manufacturing infrastructure, coupled with a highly skilled workforce and a rapidly growing middle class, underpins this sustained growth. Infrastructure development, including advanced logistics networks and free trade zones, further facilitates the efficient distribution of components. Economic policies aimed at fostering innovation and attracting foreign direct investment have created a fertile ground for both global and local distributors. Key players like WPG Holdings, Synnex Technology International, and Techtronics have established strong presences here, catering to the diverse needs of the regional market. The continued expansion of 5G networks, the rapid adoption of electric vehicles, and the ongoing digital transformation across industries are all contributing to the sustained dominance of the Asia Pacific region in the electronic components distribution market. The market penetration of electronic components in the automotive sector within this region is expected to reach 25% by 2030, showcasing immense growth potential.
Distribution of Electronic Components Product Landscape
The product landscape in the distribution of electronic components is characterized by continuous innovation and increasing sophistication. Distributors are increasingly offering advanced semiconductor solutions, including microcontrollers, processors, memory chips, and power management ICs, which are critical for applications ranging from AI and machine learning to automotive systems. Alongside these active components, the demand for high-performance passive components like advanced capacitors, resistors, inductors, and connectors is also soaring, driven by the need for miniaturization, enhanced reliability, and improved signal integrity in next-generation devices. Unique selling propositions for distributors often lie in their ability to provide access to a broad portfolio of specialized components, coupled with robust technical support, design-in services, and efficient supply chain management. Technological advancements are focused on delivering components with higher power density, lower energy consumption, and greater integration capabilities, directly impacting the performance and functionality of end-products. The ongoing miniaturization trend in consumer electronics necessitates smaller yet more powerful components, pushing the boundaries of material science and manufacturing processes within the distribution of electronic components.
Key Drivers, Barriers & Challenges in Distribution of Electronic Components
Key Drivers:
- Rapid Technological Advancements: The continuous evolution of technologies like AI, IoT, 5G, and electric vehicles fuels a consistent demand for new and specialized electronic components.
- Growth of Emerging Markets: Increasing industrialization and digitalization in developing economies are creating vast new markets for electronic components.
- Demand for Miniaturization and Performance: Consumer and industrial trends necessitate smaller, more powerful, and energy-efficient electronic components.
Barriers & Challenges:
- Supply Chain Volatility: Geopolitical tensions, natural disasters, and trade disputes can lead to component shortages and price fluctuations, impacting distribution.
- Increasing Complexity: The growing complexity of electronic designs requires distributors to possess advanced technical expertise and offer value-added services.
- Regulatory Compliance: Adherence to stringent environmental, safety, and trade regulations across different regions presents ongoing challenges.
- Counterfeit Components: The risk of counterfeit components entering the supply chain poses significant quality and security concerns.
Emerging Opportunities in Distribution of Electronic Components Industry
Emerging opportunities in the distribution of electronic components industry are abundant, particularly in the rapidly expanding sectors of electric vehicles, renewable energy, and advanced medical devices. The increasing sophistication of autonomous driving systems is creating a significant demand for high-reliability semiconductors and specialized sensors. Furthermore, the global push towards sustainable energy solutions is driving the need for components used in solar power systems, battery management, and energy-efficient infrastructure. The evolution of personalized medicine and remote healthcare technologies is also opening up new avenues for distributors to supply specialized medical-grade electronic components. The growth of edge computing and the proliferation of smart cities present further untapped markets for localized and intelligent component distribution solutions.
Growth Accelerators in the Distribution of Electronic Components Industry
Several key catalysts are accelerating growth in the distribution of electronic components industry. The ongoing digital transformation across all sectors is a primary driver, necessitating continuous upgrades and expansion of electronic infrastructure. Strategic partnerships between component manufacturers and distributors are becoming crucial for streamlining product development and market access. Furthermore, the increasing adoption of automation and artificial intelligence in manufacturing processes by end-users is driving demand for advanced control and sensor components. The expansion of e-commerce platforms and digital marketplaces is also making it easier for smaller businesses to access a wider range of components, thereby broadening the market reach. Investments in R&D for next-generation technologies, such as quantum computing and advanced robotics, will create significant future demand for highly specialized electronic components.
Key Players Shaping the Distribution of Electronic Components Market
Arrow Electronics, WPG Holdings, Avnet, WT Microelectronics, Macnica Fuji Electronics Holdings, GEC Port, Digi-Key Electronics, S A S Dragon Holdings, Techtronics, EDOM Technology, Shenzhen Huaqiang Industry, TTI, Smith, MOUSER, RS Group plc, Supreme Electronics, Restar Holdings, Fusion Worldwide, Weikeng Group, Ryosan, Xiamen Holder Electronics, Ufct Technology, Kanematsu Corporation, Wisewheel Electronics, Excelpoint Technology, Alltek Technology, Wuhan P and S Information Technology, Sunray Electronics, Cogobuy, Sinox, Smart-Core Holding, Marubun Corp, Heilind Electronics, Rutronik, Promate Electronic, Haoshanghao Xinxi, Yitoa Intelligent.
Notable Milestones in Distribution of Electronic Components Sector
- 2021: Increased global supply chain disruptions lead to significant price volatility and shortages, highlighting the need for resilient distribution networks.
- 2022: Growing demand for electric vehicles accelerates the need for specialized automotive-grade electronic components.
- 2023: Intensified focus on sustainability and ESG initiatives within the electronics industry, impacting component sourcing and distribution practices.
- 2024: Advancements in AI and machine learning drive higher demand for sophisticated processors and memory components.
- 2025 (Estimated): Significant market growth anticipated due to widespread adoption of 5G infrastructure and continued expansion of IoT devices.
In-Depth Distribution of Electronic Components Market Outlook
The future outlook for the distribution of electronic components market is exceptionally bright, propelled by sustained technological innovation and expanding end-user applications. The ongoing digital transformation, coupled with significant investments in areas like AI, 5G, and the Internet of Things, will continue to be primary growth accelerators. The burgeoning electric vehicle sector and the renewable energy transition present substantial long-term opportunities for specialized component distribution. Strategic collaborations, the adoption of advanced digital tools for supply chain management, and a keen focus on value-added services will be crucial for distributors to capitalize on emerging market trends and maintain a competitive edge in this dynamic industry.
Distribution of Electronic Components Segmentation
-
1. Application
- 1.1. Electronic
- 1.2. Industrial
- 1.3. Medical
- 1.4. Others
-
2. Types
- 2.1. Active Components
- 2.2. Passive Components
Distribution of Electronic Components Segmentation By Geography
-
1. North America
- 1.1. United States
- 1.2. Canada
- 1.3. Mexico
-
2. South America
- 2.1. Brazil
- 2.2. Argentina
- 2.3. Rest of South America
-
3. Europe
- 3.1. United Kingdom
- 3.2. Germany
- 3.3. France
- 3.4. Italy
- 3.5. Spain
- 3.6. Russia
- 3.7. Benelux
- 3.8. Nordics
- 3.9. Rest of Europe
-
4. Middle East & Africa
- 4.1. Turkey
- 4.2. Israel
- 4.3. GCC
- 4.4. North Africa
- 4.5. South Africa
- 4.6. Rest of Middle East & Africa
-
5. Asia Pacific
- 5.1. China
- 5.2. India
- 5.3. Japan
- 5.4. South Korea
- 5.5. ASEAN
- 5.6. Oceania
- 5.7. Rest of Asia Pacific
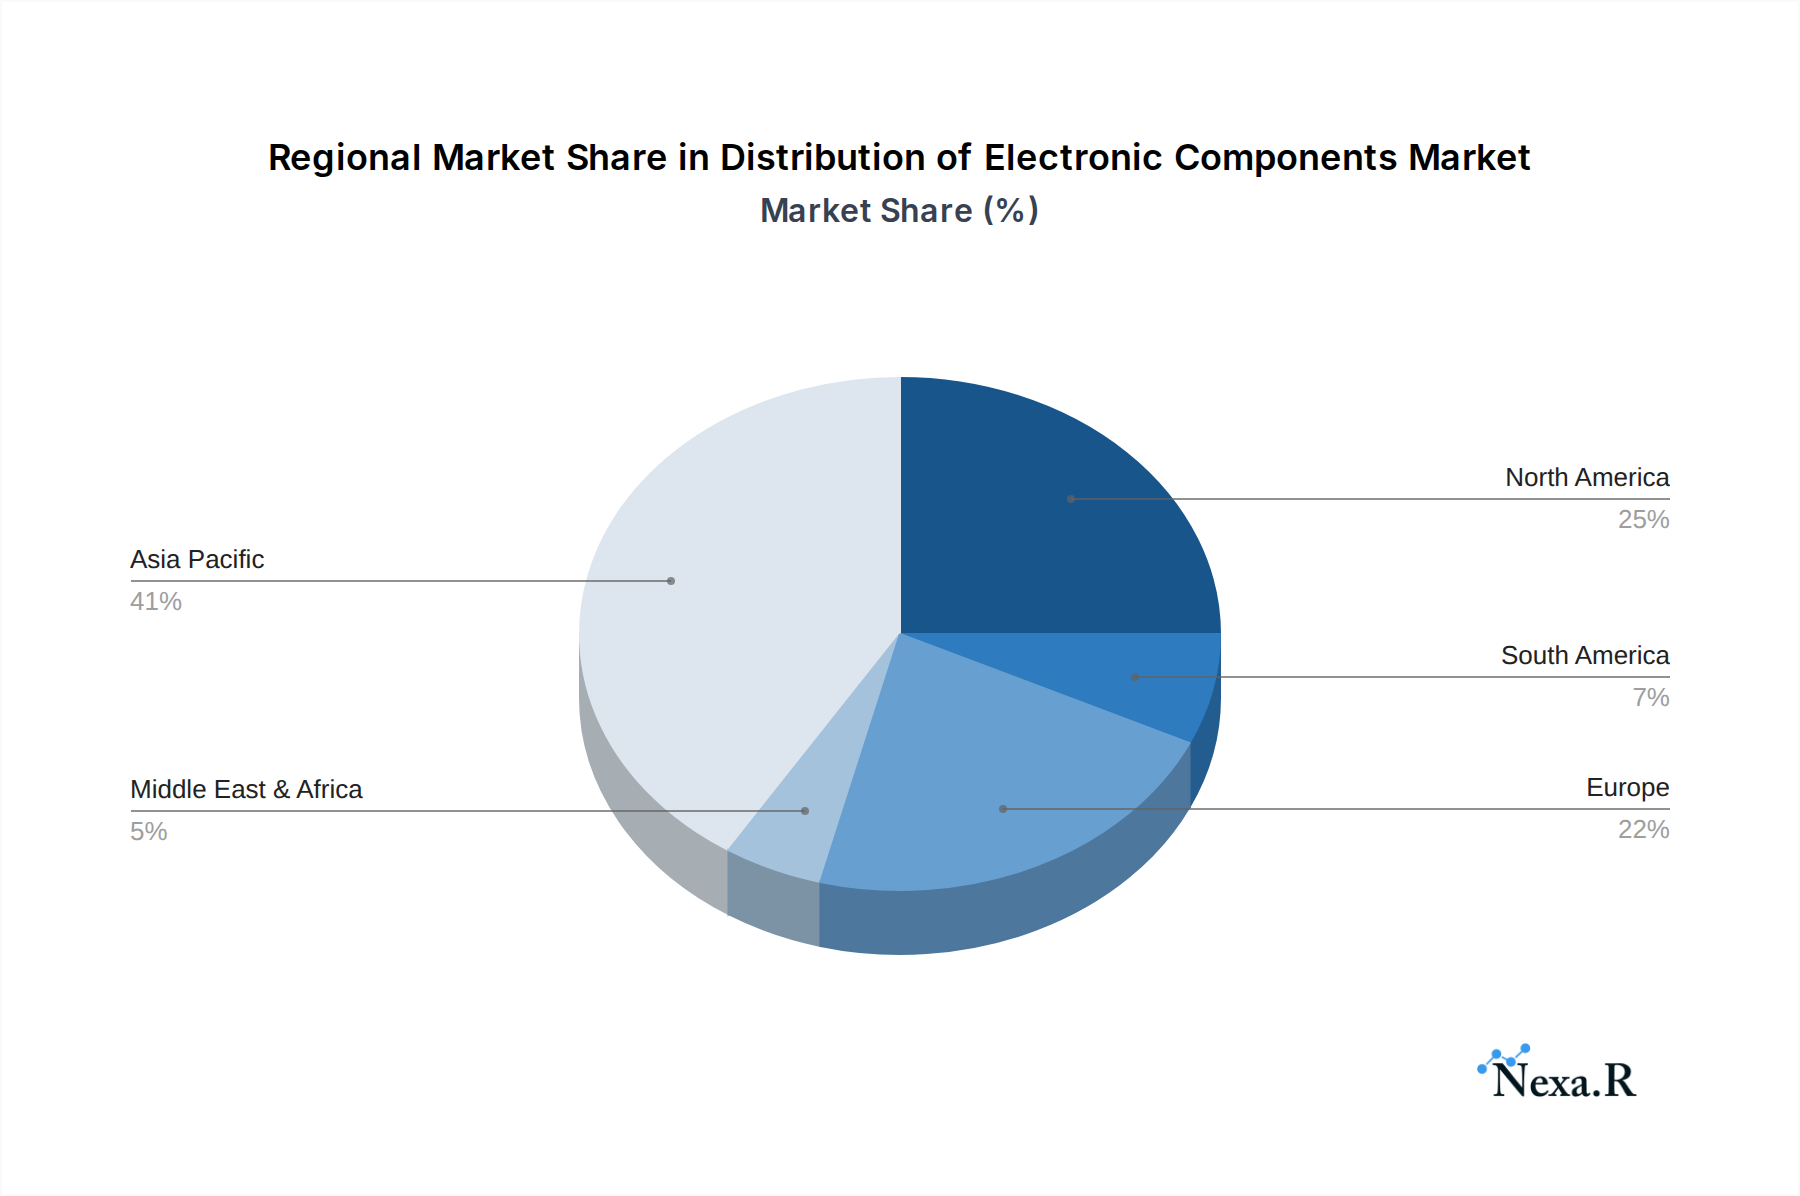
Distribution of Electronic Components Regional Market Share
Geographic Coverage of Distribution of Electronic Components
Distribution of Electronic Components REPORT HIGHLIGHTS
| Aspects | Details |
|---|---|
| Study Period | 2020-2034 |
| Base Year | 2025 |
| Estimated Year | 2026 |
| Forecast Period | 2026-2034 |
| Historical Period | 2020-2025 |
| Growth Rate | CAGR of 10.2% from 2020-2034 |
| Segmentation |
|
Table of Contents
- 1. Introduction
- 1.1. Research Scope
- 1.2. Market Segmentation
- 1.3. Research Objective
- 1.4. Definitions and Assumptions
- 2. Executive Summary
- 2.1. Market Snapshot
- 3. Market Dynamics
- 3.1. Market Drivers
- 3.2. Market Restrains
- 3.3. Market Trends
- 3.4. Market Opportunities
- 4. Market Factor Analysis
- 4.1. Porters Five Forces
- 4.1.1. Bargaining Power of Suppliers
- 4.1.2. Bargaining Power of Buyers
- 4.1.3. Threat of New Entrants
- 4.1.4. Threat of Substitutes
- 4.1.5. Competitive Rivalry
- 4.2. PESTEL analysis
- 4.3. BCG Analysis
- 4.3.1. Stars (High Growth, High Market Share)
- 4.3.2. Cash Cows (Low Growth, High Market Share)
- 4.3.3. Question Mark (High Growth, Low Market Share)
- 4.3.4. Dogs (Low Growth, Low Market Share)
- 4.4. Ansoff Matrix Analysis
- 4.5. Supply Chain Analysis
- 4.6. Regulatory Landscape
- 4.7. Current Market Potential and Opportunity Assessment (TAM–SAM–SOM Framework)
- 4.8. NRP Analyst Note
- 4.1. Porters Five Forces
- 5. Market Analysis, Insights and Forecast 2021-2033
- 5.1. Market Analysis, Insights and Forecast - by Application
- 5.1.1. Electronic
- 5.1.2. Industrial
- 5.1.3. Medical
- 5.1.4. Others
- 5.2. Market Analysis, Insights and Forecast - by Types
- 5.2.1. Active Components
- 5.2.2. Passive Components
- 5.3. Market Analysis, Insights and Forecast - by Region
- 5.3.1. North America
- 5.3.2. South America
- 5.3.3. Europe
- 5.3.4. Middle East & Africa
- 5.3.5. Asia Pacific
- 5.1. Market Analysis, Insights and Forecast - by Application
- 6. Global Distribution of Electronic Components Analysis, Insights and Forecast, 2021-2033
- 6.1. Market Analysis, Insights and Forecast - by Application
- 6.1.1. Electronic
- 6.1.2. Industrial
- 6.1.3. Medical
- 6.1.4. Others
- 6.2. Market Analysis, Insights and Forecast - by Types
- 6.2.1. Active Components
- 6.2.2. Passive Components
- 6.1. Market Analysis, Insights and Forecast - by Application
- 7. North America Distribution of Electronic Components Analysis, Insights and Forecast, 2020-2032
- 7.1. Market Analysis, Insights and Forecast - by Application
- 7.1.1. Electronic
- 7.1.2. Industrial
- 7.1.3. Medical
- 7.1.4. Others
- 7.2. Market Analysis, Insights and Forecast - by Types
- 7.2.1. Active Components
- 7.2.2. Passive Components
- 7.1. Market Analysis, Insights and Forecast - by Application
- 8. South America Distribution of Electronic Components Analysis, Insights and Forecast, 2020-2032
- 8.1. Market Analysis, Insights and Forecast - by Application
- 8.1.1. Electronic
- 8.1.2. Industrial
- 8.1.3. Medical
- 8.1.4. Others
- 8.2. Market Analysis, Insights and Forecast - by Types
- 8.2.1. Active Components
- 8.2.2. Passive Components
- 8.1. Market Analysis, Insights and Forecast - by Application
- 9. Europe Distribution of Electronic Components Analysis, Insights and Forecast, 2020-2032
- 9.1. Market Analysis, Insights and Forecast - by Application
- 9.1.1. Electronic
- 9.1.2. Industrial
- 9.1.3. Medical
- 9.1.4. Others
- 9.2. Market Analysis, Insights and Forecast - by Types
- 9.2.1. Active Components
- 9.2.2. Passive Components
- 9.1. Market Analysis, Insights and Forecast - by Application
- 10. Middle East & Africa Distribution of Electronic Components Analysis, Insights and Forecast, 2020-2032
- 10.1. Market Analysis, Insights and Forecast - by Application
- 10.1.1. Electronic
- 10.1.2. Industrial
- 10.1.3. Medical
- 10.1.4. Others
- 10.2. Market Analysis, Insights and Forecast - by Types
- 10.2.1. Active Components
- 10.2.2. Passive Components
- 10.1. Market Analysis, Insights and Forecast - by Application
- 11. Asia Pacific Distribution of Electronic Components Analysis, Insights and Forecast, 2020-2032
- 11.1. Market Analysis, Insights and Forecast - by Application
- 11.1.1. Electronic
- 11.1.2. Industrial
- 11.1.3. Medical
- 11.1.4. Others
- 11.2. Market Analysis, Insights and Forecast - by Types
- 11.2.1. Active Components
- 11.2.2. Passive Components
- 11.1. Market Analysis, Insights and Forecast - by Application
- 12. Competitive Analysis
- 12.1. Company Profiles
- 12.1.1 Arrow Electronics
- 12.1.1.1. Company Overview
- 12.1.1.2. Products
- 12.1.1.3. Company Financials
- 12.1.1.4. SWOT Analysis
- 12.1.2 WPG Holdings
- 12.1.2.1. Company Overview
- 12.1.2.2. Products
- 12.1.2.3. Company Financials
- 12.1.2.4. SWOT Analysis
- 12.1.3 Avnet
- 12.1.3.1. Company Overview
- 12.1.3.2. Products
- 12.1.3.3. Company Financials
- 12.1.3.4. SWOT Analysis
- 12.1.4 WT Microelectronics
- 12.1.4.1. Company Overview
- 12.1.4.2. Products
- 12.1.4.3. Company Financials
- 12.1.4.4. SWOT Analysis
- 12.1.5 Macnica Fuji Electronics Holdings
- 12.1.5.1. Company Overview
- 12.1.5.2. Products
- 12.1.5.3. Company Financials
- 12.1.5.4. SWOT Analysis
- 12.1.6 GEC Port
- 12.1.6.1. Company Overview
- 12.1.6.2. Products
- 12.1.6.3. Company Financials
- 12.1.6.4. SWOT Analysis
- 12.1.7 Digi-Key Electronics
- 12.1.7.1. Company Overview
- 12.1.7.2. Products
- 12.1.7.3. Company Financials
- 12.1.7.4. SWOT Analysis
- 12.1.8 S A S Dragon Holdings
- 12.1.8.1. Company Overview
- 12.1.8.2. Products
- 12.1.8.3. Company Financials
- 12.1.8.4. SWOT Analysis
- 12.1.9 Techtronics
- 12.1.9.1. Company Overview
- 12.1.9.2. Products
- 12.1.9.3. Company Financials
- 12.1.9.4. SWOT Analysis
- 12.1.10 EDOM Technology
- 12.1.10.1. Company Overview
- 12.1.10.2. Products
- 12.1.10.3. Company Financials
- 12.1.10.4. SWOT Analysis
- 12.1.11 Shenzhen Huaqiang Industry
- 12.1.11.1. Company Overview
- 12.1.11.2. Products
- 12.1.11.3. Company Financials
- 12.1.11.4. SWOT Analysis
- 12.1.12 TTI
- 12.1.12.1. Company Overview
- 12.1.12.2. Products
- 12.1.12.3. Company Financials
- 12.1.12.4. SWOT Analysis
- 12.1.13 Smith
- 12.1.13.1. Company Overview
- 12.1.13.2. Products
- 12.1.13.3. Company Financials
- 12.1.13.4. SWOT Analysis
- 12.1.14 MOUSER
- 12.1.14.1. Company Overview
- 12.1.14.2. Products
- 12.1.14.3. Company Financials
- 12.1.14.4. SWOT Analysis
- 12.1.15 RS Group plc
- 12.1.15.1. Company Overview
- 12.1.15.2. Products
- 12.1.15.3. Company Financials
- 12.1.15.4. SWOT Analysis
- 12.1.16 Supreme Electronics
- 12.1.16.1. Company Overview
- 12.1.16.2. Products
- 12.1.16.3. Company Financials
- 12.1.16.4. SWOT Analysis
- 12.1.17 Restar Holdings
- 12.1.17.1. Company Overview
- 12.1.17.2. Products
- 12.1.17.3. Company Financials
- 12.1.17.4. SWOT Analysis
- 12.1.18 Fusion Worldwide
- 12.1.18.1. Company Overview
- 12.1.18.2. Products
- 12.1.18.3. Company Financials
- 12.1.18.4. SWOT Analysis
- 12.1.19 Weikeng Group
- 12.1.19.1. Company Overview
- 12.1.19.2. Products
- 12.1.19.3. Company Financials
- 12.1.19.4. SWOT Analysis
- 12.1.20 Ryosan
- 12.1.20.1. Company Overview
- 12.1.20.2. Products
- 12.1.20.3. Company Financials
- 12.1.20.4. SWOT Analysis
- 12.1.21 Xiamen Holder Electronics
- 12.1.21.1. Company Overview
- 12.1.21.2. Products
- 12.1.21.3. Company Financials
- 12.1.21.4. SWOT Analysis
- 12.1.22 Ufct Technology
- 12.1.22.1. Company Overview
- 12.1.22.2. Products
- 12.1.22.3. Company Financials
- 12.1.22.4. SWOT Analysis
- 12.1.23 Kanematsu Corporation
- 12.1.23.1. Company Overview
- 12.1.23.2. Products
- 12.1.23.3. Company Financials
- 12.1.23.4. SWOT Analysis
- 12.1.24 Wisewheel Electronics
- 12.1.24.1. Company Overview
- 12.1.24.2. Products
- 12.1.24.3. Company Financials
- 12.1.24.4. SWOT Analysis
- 12.1.25 Excelpoint Technology
- 12.1.25.1. Company Overview
- 12.1.25.2. Products
- 12.1.25.3. Company Financials
- 12.1.25.4. SWOT Analysis
- 12.1.26 Alltek Technology
- 12.1.26.1. Company Overview
- 12.1.26.2. Products
- 12.1.26.3. Company Financials
- 12.1.26.4. SWOT Analysis
- 12.1.27 Wuhan P and S Information Technology
- 12.1.27.1. Company Overview
- 12.1.27.2. Products
- 12.1.27.3. Company Financials
- 12.1.27.4. SWOT Analysis
- 12.1.28 Sunray Electronics
- 12.1.28.1. Company Overview
- 12.1.28.2. Products
- 12.1.28.3. Company Financials
- 12.1.28.4. SWOT Analysis
- 12.1.29 Cogobuy
- 12.1.29.1. Company Overview
- 12.1.29.2. Products
- 12.1.29.3. Company Financials
- 12.1.29.4. SWOT Analysis
- 12.1.30 Sinox
- 12.1.30.1. Company Overview
- 12.1.30.2. Products
- 12.1.30.3. Company Financials
- 12.1.30.4. SWOT Analysis
- 12.1.31 Smart-Core Holding
- 12.1.31.1. Company Overview
- 12.1.31.2. Products
- 12.1.31.3. Company Financials
- 12.1.31.4. SWOT Analysis
- 12.1.32 Marubun Corp
- 12.1.32.1. Company Overview
- 12.1.32.2. Products
- 12.1.32.3. Company Financials
- 12.1.32.4. SWOT Analysis
- 12.1.33 Heilind Electronics
- 12.1.33.1. Company Overview
- 12.1.33.2. Products
- 12.1.33.3. Company Financials
- 12.1.33.4. SWOT Analysis
- 12.1.34 Rutronik
- 12.1.34.1. Company Overview
- 12.1.34.2. Products
- 12.1.34.3. Company Financials
- 12.1.34.4. SWOT Analysis
- 12.1.35 Promate Electronic
- 12.1.35.1. Company Overview
- 12.1.35.2. Products
- 12.1.35.3. Company Financials
- 12.1.35.4. SWOT Analysis
- 12.1.36 Haoshanghao Xinxi
- 12.1.36.1. Company Overview
- 12.1.36.2. Products
- 12.1.36.3. Company Financials
- 12.1.36.4. SWOT Analysis
- 12.1.37 Yitoa Intelligent
- 12.1.37.1. Company Overview
- 12.1.37.2. Products
- 12.1.37.3. Company Financials
- 12.1.37.4. SWOT Analysis
- 12.1.1 Arrow Electronics
- 12.2. Market Entropy
- 12.2.1 Company's Key Areas Served
- 12.2.2 Recent Developments
- 12.3. Company Market Share Analysis 2025
- 12.3.1 Top 5 Companies Market Share Analysis
- 12.3.2 Top 3 Companies Market Share Analysis
- 12.4. List of Potential Customers
- 13. Research Methodology
List of Figures
- Figure 1: Global Distribution of Electronic Components Revenue Breakdown (undefined, %) by Region 2025 & 2033
- Figure 2: North America Distribution of Electronic Components Revenue (undefined), by Application 2025 & 2033
- Figure 3: North America Distribution of Electronic Components Revenue Share (%), by Application 2025 & 2033
- Figure 4: North America Distribution of Electronic Components Revenue (undefined), by Types 2025 & 2033
- Figure 5: North America Distribution of Electronic Components Revenue Share (%), by Types 2025 & 2033
- Figure 6: North America Distribution of Electronic Components Revenue (undefined), by Country 2025 & 2033
- Figure 7: North America Distribution of Electronic Components Revenue Share (%), by Country 2025 & 2033
- Figure 8: South America Distribution of Electronic Components Revenue (undefined), by Application 2025 & 2033
- Figure 9: South America Distribution of Electronic Components Revenue Share (%), by Application 2025 & 2033
- Figure 10: South America Distribution of Electronic Components Revenue (undefined), by Types 2025 & 2033
- Figure 11: South America Distribution of Electronic Components Revenue Share (%), by Types 2025 & 2033
- Figure 12: South America Distribution of Electronic Components Revenue (undefined), by Country 2025 & 2033
- Figure 13: South America Distribution of Electronic Components Revenue Share (%), by Country 2025 & 2033
- Figure 14: Europe Distribution of Electronic Components Revenue (undefined), by Application 2025 & 2033
- Figure 15: Europe Distribution of Electronic Components Revenue Share (%), by Application 2025 & 2033
- Figure 16: Europe Distribution of Electronic Components Revenue (undefined), by Types 2025 & 2033
- Figure 17: Europe Distribution of Electronic Components Revenue Share (%), by Types 2025 & 2033
- Figure 18: Europe Distribution of Electronic Components Revenue (undefined), by Country 2025 & 2033
- Figure 19: Europe Distribution of Electronic Components Revenue Share (%), by Country 2025 & 2033
- Figure 20: Middle East & Africa Distribution of Electronic Components Revenue (undefined), by Application 2025 & 2033
- Figure 21: Middle East & Africa Distribution of Electronic Components Revenue Share (%), by Application 2025 & 2033
- Figure 22: Middle East & Africa Distribution of Electronic Components Revenue (undefined), by Types 2025 & 2033
- Figure 23: Middle East & Africa Distribution of Electronic Components Revenue Share (%), by Types 2025 & 2033
- Figure 24: Middle East & Africa Distribution of Electronic Components Revenue (undefined), by Country 2025 & 2033
- Figure 25: Middle East & Africa Distribution of Electronic Components Revenue Share (%), by Country 2025 & 2033
- Figure 26: Asia Pacific Distribution of Electronic Components Revenue (undefined), by Application 2025 & 2033
- Figure 27: Asia Pacific Distribution of Electronic Components Revenue Share (%), by Application 2025 & 2033
- Figure 28: Asia Pacific Distribution of Electronic Components Revenue (undefined), by Types 2025 & 2033
- Figure 29: Asia Pacific Distribution of Electronic Components Revenue Share (%), by Types 2025 & 2033
- Figure 30: Asia Pacific Distribution of Electronic Components Revenue (undefined), by Country 2025 & 2033
- Figure 31: Asia Pacific Distribution of Electronic Components Revenue Share (%), by Country 2025 & 2033
List of Tables
- Table 1: Global Distribution of Electronic Components Revenue undefined Forecast, by Application 2020 & 2033
- Table 2: Global Distribution of Electronic Components Revenue undefined Forecast, by Types 2020 & 2033
- Table 3: Global Distribution of Electronic Components Revenue undefined Forecast, by Region 2020 & 2033
- Table 4: Global Distribution of Electronic Components Revenue undefined Forecast, by Application 2020 & 2033
- Table 5: Global Distribution of Electronic Components Revenue undefined Forecast, by Types 2020 & 2033
- Table 6: Global Distribution of Electronic Components Revenue undefined Forecast, by Country 2020 & 2033
- Table 7: United States Distribution of Electronic Components Revenue (undefined) Forecast, by Application 2020 & 2033
- Table 8: Canada Distribution of Electronic Components Revenue (undefined) Forecast, by Application 2020 & 2033
- Table 9: Mexico Distribution of Electronic Components Revenue (undefined) Forecast, by Application 2020 & 2033
- Table 10: Global Distribution of Electronic Components Revenue undefined Forecast, by Application 2020 & 2033
- Table 11: Global Distribution of Electronic Components Revenue undefined Forecast, by Types 2020 & 2033
- Table 12: Global Distribution of Electronic Components Revenue undefined Forecast, by Country 2020 & 2033
- Table 13: Brazil Distribution of Electronic Components Revenue (undefined) Forecast, by Application 2020 & 2033
- Table 14: Argentina Distribution of Electronic Components Revenue (undefined) Forecast, by Application 2020 & 2033
- Table 15: Rest of South America Distribution of Electronic Components Revenue (undefined) Forecast, by Application 2020 & 2033
- Table 16: Global Distribution of Electronic Components Revenue undefined Forecast, by Application 2020 & 2033
- Table 17: Global Distribution of Electronic Components Revenue undefined Forecast, by Types 2020 & 2033
- Table 18: Global Distribution of Electronic Components Revenue undefined Forecast, by Country 2020 & 2033
- Table 19: United Kingdom Distribution of Electronic Components Revenue (undefined) Forecast, by Application 2020 & 2033
- Table 20: Germany Distribution of Electronic Components Revenue (undefined) Forecast, by Application 2020 & 2033
- Table 21: France Distribution of Electronic Components Revenue (undefined) Forecast, by Application 2020 & 2033
- Table 22: Italy Distribution of Electronic Components Revenue (undefined) Forecast, by Application 2020 & 2033
- Table 23: Spain Distribution of Electronic Components Revenue (undefined) Forecast, by Application 2020 & 2033
- Table 24: Russia Distribution of Electronic Components Revenue (undefined) Forecast, by Application 2020 & 2033
- Table 25: Benelux Distribution of Electronic Components Revenue (undefined) Forecast, by Application 2020 & 2033
- Table 26: Nordics Distribution of Electronic Components Revenue (undefined) Forecast, by Application 2020 & 2033
- Table 27: Rest of Europe Distribution of Electronic Components Revenue (undefined) Forecast, by Application 2020 & 2033
- Table 28: Global Distribution of Electronic Components Revenue undefined Forecast, by Application 2020 & 2033
- Table 29: Global Distribution of Electronic Components Revenue undefined Forecast, by Types 2020 & 2033
- Table 30: Global Distribution of Electronic Components Revenue undefined Forecast, by Country 2020 & 2033
- Table 31: Turkey Distribution of Electronic Components Revenue (undefined) Forecast, by Application 2020 & 2033
- Table 32: Israel Distribution of Electronic Components Revenue (undefined) Forecast, by Application 2020 & 2033
- Table 33: GCC Distribution of Electronic Components Revenue (undefined) Forecast, by Application 2020 & 2033
- Table 34: North Africa Distribution of Electronic Components Revenue (undefined) Forecast, by Application 2020 & 2033
- Table 35: South Africa Distribution of Electronic Components Revenue (undefined) Forecast, by Application 2020 & 2033
- Table 36: Rest of Middle East & Africa Distribution of Electronic Components Revenue (undefined) Forecast, by Application 2020 & 2033
- Table 37: Global Distribution of Electronic Components Revenue undefined Forecast, by Application 2020 & 2033
- Table 38: Global Distribution of Electronic Components Revenue undefined Forecast, by Types 2020 & 2033
- Table 39: Global Distribution of Electronic Components Revenue undefined Forecast, by Country 2020 & 2033
- Table 40: China Distribution of Electronic Components Revenue (undefined) Forecast, by Application 2020 & 2033
- Table 41: India Distribution of Electronic Components Revenue (undefined) Forecast, by Application 2020 & 2033
- Table 42: Japan Distribution of Electronic Components Revenue (undefined) Forecast, by Application 2020 & 2033
- Table 43: South Korea Distribution of Electronic Components Revenue (undefined) Forecast, by Application 2020 & 2033
- Table 44: ASEAN Distribution of Electronic Components Revenue (undefined) Forecast, by Application 2020 & 2033
- Table 45: Oceania Distribution of Electronic Components Revenue (undefined) Forecast, by Application 2020 & 2033
- Table 46: Rest of Asia Pacific Distribution of Electronic Components Revenue (undefined) Forecast, by Application 2020 & 2033
Frequently Asked Questions
1. What is the projected Compound Annual Growth Rate (CAGR) of the Distribution of Electronic Components?
The projected CAGR is approximately 10.2%.
2. Which companies are prominent players in the Distribution of Electronic Components?
Key companies in the market include Arrow Electronics, WPG Holdings, Avnet, WT Microelectronics, Macnica Fuji Electronics Holdings, GEC Port, Digi-Key Electronics, S A S Dragon Holdings, Techtronics, EDOM Technology, Shenzhen Huaqiang Industry, TTI, Smith, MOUSER, RS Group plc, Supreme Electronics, Restar Holdings, Fusion Worldwide, Weikeng Group, Ryosan, Xiamen Holder Electronics, Ufct Technology, Kanematsu Corporation, Wisewheel Electronics, Excelpoint Technology, Alltek Technology, Wuhan P and S Information Technology, Sunray Electronics, Cogobuy, Sinox, Smart-Core Holding, Marubun Corp, Heilind Electronics, Rutronik, Promate Electronic, Haoshanghao Xinxi, Yitoa Intelligent.
3. What are the main segments of the Distribution of Electronic Components?
The market segments include Application, Types.
4. Can you provide details about the market size?
The market size is estimated to be USD XXX N/A as of 2022.
5. What are some drivers contributing to market growth?
N/A
6. What are the notable trends driving market growth?
N/A
7. Are there any restraints impacting market growth?
N/A
8. Can you provide examples of recent developments in the market?
N/A
9. What pricing options are available for accessing the report?
Pricing options include single-user, multi-user, and enterprise licenses priced at USD 3350.00, USD 5025.00, and USD 6700.00 respectively.
10. Is the market size provided in terms of value or volume?
The market size is provided in terms of value, measured in N/A.
11. Are there any specific market keywords associated with the report?
Yes, the market keyword associated with the report is "Distribution of Electronic Components," which aids in identifying and referencing the specific market segment covered.
12. How do I determine which pricing option suits my needs best?
The pricing options vary based on user requirements and access needs. Individual users may opt for single-user licenses, while businesses requiring broader access may choose multi-user or enterprise licenses for cost-effective access to the report.
13. Are there any additional resources or data provided in the Distribution of Electronic Components report?
While the report offers comprehensive insights, it's advisable to review the specific contents or supplementary materials provided to ascertain if additional resources or data are available.
14. How can I stay updated on further developments or reports in the Distribution of Electronic Components?
To stay informed about further developments, trends, and reports in the Distribution of Electronic Components, consider subscribing to industry newsletters, following relevant companies and organizations, or regularly checking reputable industry news sources and publications.
Methodology
Step 1 - Identification of Relevant Samples Size from Population Database


Step 2 - Approaches for Defining Global Market Size (Value, Volume* & Price*)

Note*: In applicable scenarios
Step 3 - Data Sources
Primary Research
- Web Analytics
- Survey Reports
- Research Institute
- Latest Research Reports
- Opinion Leaders
Secondary Research
- Annual Reports
- White Paper
- Latest Press Release
- Industry Association
- Paid Database
- Investor Presentations

Step 4 - Data Triangulation
Involves using different sources of information in order to increase the validity of a study
These sources are likely to be stakeholders in a program - participants, other researchers, program staff, other community members, and so on.
Then we put all data in single framework & apply various statistical tools to find out the dynamic on the market.
During the analysis stage, feedback from the stakeholder groups would be compared to determine areas of agreement as well as areas of divergence