

Key Insights
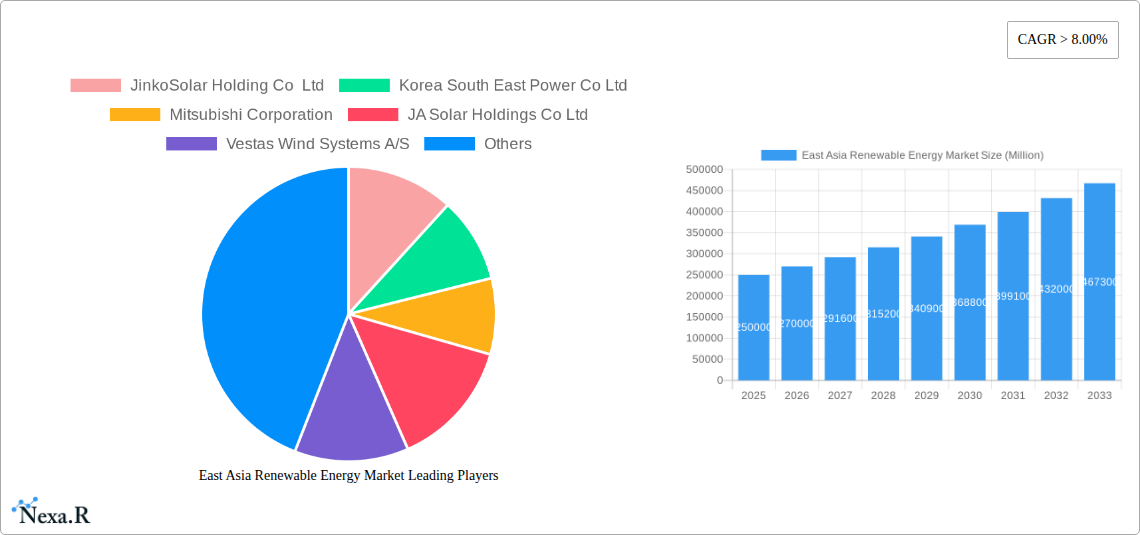
The East Asia renewable energy market, encompassing solar, wind, hydro, and other sources, is experiencing robust growth, projected to maintain a Compound Annual Growth Rate (CAGR) exceeding 8% from 2025 to 2033. This expansion is fueled by several key drivers. Firstly, increasing government support through subsidies, tax incentives, and renewable energy mandates across countries like China, Japan, South Korea, and Taiwan is significantly stimulating investment and deployment. Secondly, the declining costs of renewable energy technologies, particularly solar and wind power, have made them increasingly competitive with traditional fossil fuels, further accelerating adoption. Thirdly, rising energy security concerns and commitments to reducing carbon emissions are pushing nations in East Asia to diversify their energy mix and transition towards cleaner energy sources. The market is segmented geographically, with China expected to maintain its dominant position, followed by Japan and South Korea. However, other nations within the region are also witnessing significant growth as they develop their renewable energy infrastructure. The market is also segmented by technology, with solar and wind power leading the way due to their scalability and relatively lower costs. While hydro remains a significant contributor, particularly in certain regions, its future growth may be constrained by environmental concerns and geographical limitations. Growth will not be uniform; challenges remain, including grid infrastructure limitations and the need for effective energy storage solutions to manage intermittency issues associated with solar and wind power. Despite these restraints, the long-term outlook for the East Asia renewable energy market remains highly positive, driven by strong policy support, technological advancements, and growing environmental awareness.
The competitive landscape features a mix of international and domestic players, including established energy companies like Mitsubishi Corporation and Siemens Gamesa Renewable Energy SA, alongside leading solar manufacturers such as JinkoSolar Holding Co Ltd and LONGi Green Energy Technology Co Ltd. These companies are engaged in intense competition, leading to innovation and cost reductions, benefiting consumers and driving market expansion. Furthermore, the increasing participation of independent power producers (IPPs) and the rise of community-based renewable energy projects are adding further dynamism to the market. The successful integration of renewable energy sources into existing grids and the development of smart grids capable of managing fluctuating power supply are critical factors determining future growth. Strategic partnerships, mergers, and acquisitions are likely to shape the market landscape in the coming years as companies seek to expand their reach and consolidate their market positions. Overall, the East Asia renewable energy market is poised for sustained and significant growth, presenting considerable opportunities for investors and businesses in the sector.
East Asia Renewable Energy Market: A Comprehensive Report (2019-2033)
This comprehensive report provides a detailed analysis of the East Asia renewable energy market, encompassing market size, growth trends, key players, and future outlook. The report covers the period from 2019 to 2033, with a focus on the 2025-2033 forecast period. It segments the market by source (Solar, Wind, Hydro, Other Sources) and geography (China, Japan, South Korea, Taiwan, Rest of East Asia), offering invaluable insights for investors, industry professionals, and policymakers. The market is valued in Million units.
East Asia Renewable Energy Market Dynamics & Structure
The East Asia renewable energy market is characterized by a dynamic interplay of technological advancements, supportive government policies, and intense competition. Market concentration varies across segments and geographies, with China dominating solar PV manufacturing and installation. Technological innovation, driven by the need for cost reduction and efficiency improvements, is a key driver. Stringent environmental regulations are pushing the adoption of renewable energy sources, while the availability of cheaper fossil fuels sometimes presents a challenge. Mergers and acquisitions (M&A) activity is significant, with larger players consolidating their market share and expanding their geographical reach.
- Market Concentration: China holds a significant share of the manufacturing and installation market for solar PV. The wind energy sector shows a more diversified landscape. xx% of the market is controlled by the top 5 players.
- Technological Innovation: Continuous improvement in solar panel efficiency and wind turbine technology is a major driver of cost reduction and market expansion. However, challenges remain in grid integration and energy storage solutions.
- Regulatory Frameworks: Government policies promoting renewable energy deployment through feed-in tariffs, tax incentives, and renewable portfolio standards (RPS) are crucial. Variations in policies across countries create opportunities and challenges.
- Competitive Product Substitutes: Fossil fuels remain a significant competitor, particularly in regions with abundant resources and comparatively low prices. However, the increasing cost of fossil fuels and environmental concerns are shifting the balance in favor of renewables.
- End-User Demographics: The end-users encompass a mix of utility-scale projects, commercial and industrial installations, and residential consumers. The mix varies by country and renewable energy source.
- M&A Trends: The past five years have witnessed a significant number of M&A deals (xx deals), reflecting consolidation within the industry and strategic expansion efforts.
East Asia Renewable Energy Market Growth Trends & Insights
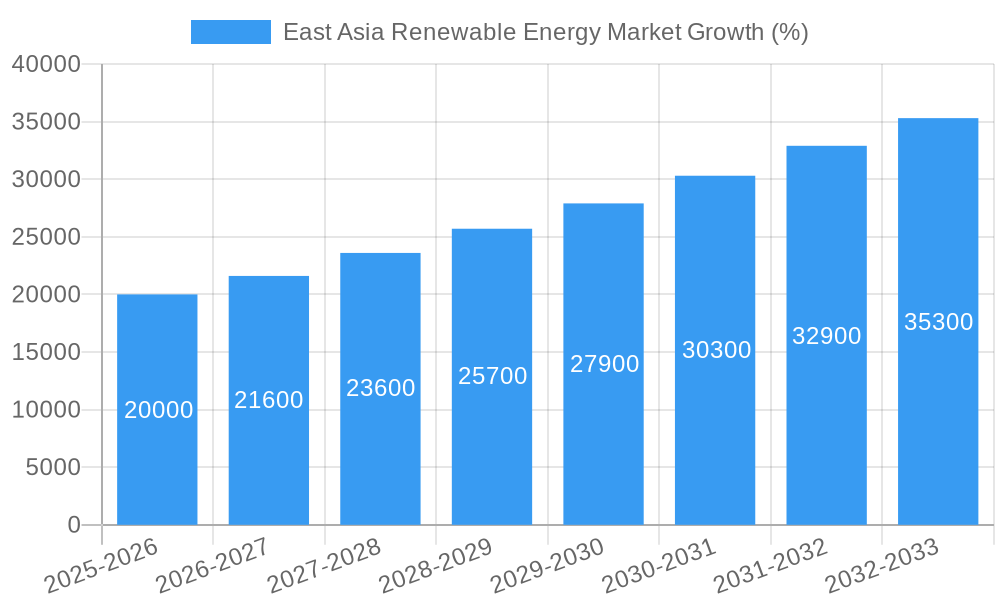
The East Asia renewable energy market is experiencing robust growth, driven by increasing energy demand, environmental concerns, and supportive government policies. The market size has grown from xx Million in 2019 to xx Million in 2024, registering a Compound Annual Growth Rate (CAGR) of xx%. The adoption rate of renewable energy is accelerating, particularly in China, Japan, and South Korea. Technological disruptions, such as advancements in energy storage and smart grid technologies, are further enhancing the competitiveness of renewable energy. Consumer behavior is evolving towards greater environmental consciousness, increasing demand for renewable energy sources. Market penetration is expected to increase significantly in the forecast period, with projections indicating a CAGR of xx% from 2025 to 2033.
Dominant Regions, Countries, or Segments in East Asia Renewable Energy Market
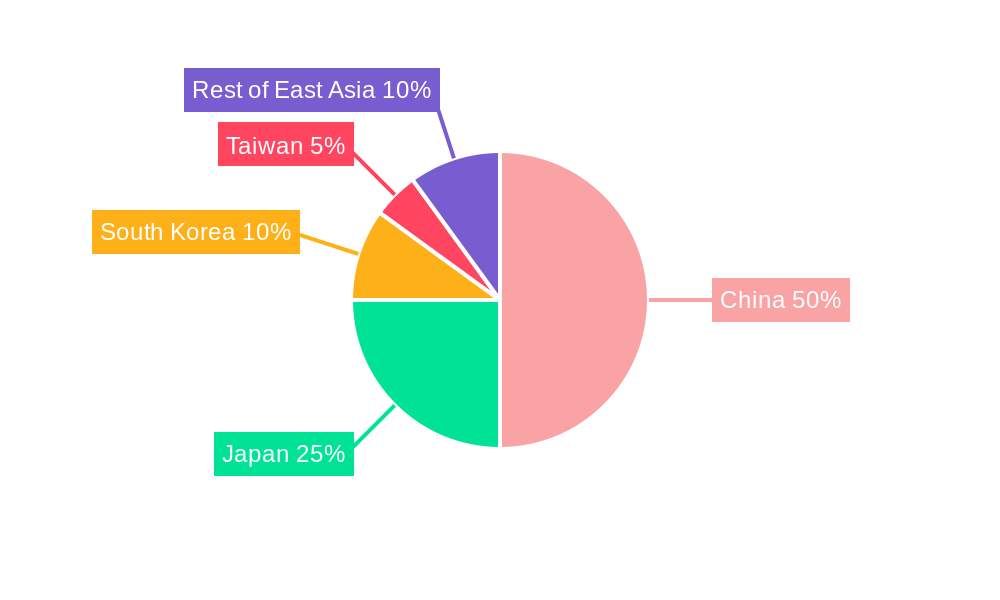
China dominates the East Asia renewable energy market, accounting for the largest share (xx%) of the total market size in 2024. This dominance stems from its massive energy demand, ambitious renewable energy targets, and robust manufacturing base. Japan and South Korea are also significant markets, driven by their commitment to energy security and decarbonization goals. Solar PV is the leading segment, followed by wind energy and hydro.
- China: Massive government investment, supportive policies, and a strong manufacturing base have propelled China's dominance in solar PV and wind energy.
- Japan: Focus on energy security and a growing renewable energy portfolio are driving market expansion, especially in offshore wind.
- South Korea: Investment in renewable energy is increasing, driven by environmental concerns and the country's commitment to reducing greenhouse gas emissions.
- Taiwan: A growing emphasis on renewable energy development, combined with supportive policies, is attracting significant foreign investment.
- Rest of East Asia: The market in this region is smaller but exhibits substantial growth potential due to rising energy demand and government initiatives.
- Solar PV: Technological advancements, cost reductions, and favorable policies have made solar PV the dominant segment.
- Wind Energy: Growth is significant, with offshore wind projects gaining momentum in countries like Japan.
- Hydropower: This sector's growth is more constrained, with limited opportunities for large-scale projects.
East Asia Renewable Energy Market Product Landscape
The East Asia renewable energy market features a wide range of products, including advanced solar PV panels, high-efficiency wind turbines, and smart grid technologies. Innovations focus on cost reduction, efficiency improvements, and enhanced performance in challenging environmental conditions. Unique selling propositions include higher energy yield, longer lifespans, and reduced maintenance requirements. Technological advancements in areas such as Perovskite solar cells and advanced energy storage solutions are driving further improvements in efficiency and cost-effectiveness.
Key Drivers, Barriers & Challenges in East Asia Renewable Energy Market
Key Drivers:
- Government support: Subsidies, tax incentives, and renewable portfolio standards are boosting market growth.
- Falling technology costs: The decreasing cost of solar PV and wind energy makes them more competitive.
- Climate change concerns: Growing awareness of environmental issues increases demand for clean energy sources.
Key Challenges:
- Grid infrastructure limitations: Upgrading existing grids to handle intermittent renewable energy sources is essential.
- Land availability: Securing suitable land for large-scale renewable energy projects can be a significant challenge.
- Intermittency: The variable nature of solar and wind power requires effective energy storage and grid management solutions. This poses a challenge for grid stability and reliability. The costs associated with these solutions are also a barrier to entry for smaller players.
Emerging Opportunities in East Asia Renewable Energy Market
- Offshore wind: Significant potential for large-scale projects in countries with suitable coastlines.
- Energy storage: Growing demand for battery storage solutions to address the intermittency of renewable energy sources.
- Green hydrogen: Emerging opportunities in the production and utilization of green hydrogen as a clean fuel source.
Growth Accelerators in the East Asia Renewable Energy Market Industry
Technological breakthroughs in solar PV and wind energy, coupled with strategic partnerships between domestic and international players, are accelerating growth. Expansion into untapped markets, such as rural areas with limited access to electricity, represents a significant opportunity. Moreover, evolving consumer preferences toward sustainable energy solutions are creating a robust demand for renewable energy.
Key Players Shaping the East Asia Renewable Energy Market Market
- JinkoSolar Holding Co Ltd
- Korea South East Power Co Ltd
- Mitsubishi Corporation
- JA Solar Holdings Co Ltd
- Vestas Wind Systems A/S
- Eurus Energy Holdings Corporation
- Siemens Gamesa Renewable Energy SA
- LONGi Green Energy Technology Co Ltd
- Xinjiang Goldwind Science & Technology Co
- Trina Solar Limited
Notable Milestones in East Asia Renewable Energy Market Sector
- April 2022: Jera and West Holdings finalized a deal to develop at least 1 GW of solar capacity in Japan by the end of 2025. This signals a major investment in domestic solar energy and strengthens the position of renewable energy in Japan's energy mix.
- May 2022: Lightsource BP announced plans to build a 150 MW solar park in Taiwan, highlighting growing investor confidence in the Taiwanese renewable energy sector and the potential for large-scale solar projects.
In-Depth East Asia Renewable Energy Market Market Outlook
The East Asia renewable energy market is poised for sustained growth in the coming years, driven by strong government support, falling technology costs, and increasing environmental awareness. Strategic opportunities exist in offshore wind, energy storage, and green hydrogen, representing significant potential for future market expansion and investment. The market is expected to reach xx Million by 2033, indicating a strong growth trajectory and attractive investment prospects.
East Asia Renewable Energy Market Segmentation
-
1. Source
- 1.1. Solar
- 1.2. Wind
- 1.3. Hydro
- 1.4. Other Sources
-
2. Geogrpahy
- 2.1. China
- 2.2. Japan
- 2.3. South Korea
- 2.4. Taiwan
- 2.5. Rest of East Asia
East Asia Renewable Energy Market Segmentation By Geography
-
1. North America
- 1.1. United States
- 1.2. Canada
- 1.3. Mexico
-
2. South America
- 2.1. Brazil
- 2.2. Argentina
- 2.3. Rest of South America
-
3. Europe
- 3.1. United Kingdom
- 3.2. Germany
- 3.3. France
- 3.4. Italy
- 3.5. Spain
- 3.6. Russia
- 3.7. Benelux
- 3.8. Nordics
- 3.9. Rest of Europe
-
4. Middle East & Africa
- 4.1. Turkey
- 4.2. Israel
- 4.3. GCC
- 4.4. North Africa
- 4.5. South Africa
- 4.6. Rest of Middle East & Africa
-
5. Asia Pacific
- 5.1. China
- 5.2. India
- 5.3. Japan
- 5.4. South Korea
- 5.5. ASEAN
- 5.6. Oceania
- 5.7. Rest of Asia Pacific
East Asia Renewable Energy Market REPORT HIGHLIGHTS
| Aspects | Details |
|---|---|
| Study Period | 2019-2033 |
| Base Year | 2024 |
| Estimated Year | 2025 |
| Forecast Period | 2025-2033 |
| Historical Period | 2019-2024 |
| Growth Rate | CAGR of > 8.00% from 2019-2033 |
| Segmentation |
|
Table of Contents
- 1. Introduction
- 1.1. Research Scope
- 1.2. Market Segmentation
- 1.3. Research Methodology
- 1.4. Definitions and Assumptions
- 2. Executive Summary
- 2.1. Introduction
- 3. Market Dynamics
- 3.1. Introduction
- 3.2. Market Drivers
- 3.2.1. 4.; Demand for Solar Photovoltaic Installations4.; Growing Investments
- 3.3. Market Restrains
- 3.3.1. 4.; Increasing Wind Energy Installations
- 3.4. Market Trends
- 3.4.1. Solar Energy to Dominate the Market
- 4. Market Factor Analysis
- 4.1. Porters Five Forces
- 4.2. Supply/Value Chain
- 4.3. PESTEL analysis
- 4.4. Market Entropy
- 4.5. Patent/Trademark Analysis
- 5. Global East Asia Renewable Energy Market Analysis, Insights and Forecast, 2019-2031
- 5.1. Market Analysis, Insights and Forecast - by Source
- 5.1.1. Solar
- 5.1.2. Wind
- 5.1.3. Hydro
- 5.1.4. Other Sources
- 5.2. Market Analysis, Insights and Forecast - by Geogrpahy
- 5.2.1. China
- 5.2.2. Japan
- 5.2.3. South Korea
- 5.2.4. Taiwan
- 5.2.5. Rest of East Asia
- 5.3. Market Analysis, Insights and Forecast - by Region
- 5.3.1. North America
- 5.3.2. South America
- 5.3.3. Europe
- 5.3.4. Middle East & Africa
- 5.3.5. Asia Pacific
- 5.1. Market Analysis, Insights and Forecast - by Source
- 6. North America East Asia Renewable Energy Market Analysis, Insights and Forecast, 2019-2031
- 6.1. Market Analysis, Insights and Forecast - by Source
- 6.1.1. Solar
- 6.1.2. Wind
- 6.1.3. Hydro
- 6.1.4. Other Sources
- 6.2. Market Analysis, Insights and Forecast - by Geogrpahy
- 6.2.1. China
- 6.2.2. Japan
- 6.2.3. South Korea
- 6.2.4. Taiwan
- 6.2.5. Rest of East Asia
- 6.1. Market Analysis, Insights and Forecast - by Source
- 7. South America East Asia Renewable Energy Market Analysis, Insights and Forecast, 2019-2031
- 7.1. Market Analysis, Insights and Forecast - by Source
- 7.1.1. Solar
- 7.1.2. Wind
- 7.1.3. Hydro
- 7.1.4. Other Sources
- 7.2. Market Analysis, Insights and Forecast - by Geogrpahy
- 7.2.1. China
- 7.2.2. Japan
- 7.2.3. South Korea
- 7.2.4. Taiwan
- 7.2.5. Rest of East Asia
- 7.1. Market Analysis, Insights and Forecast - by Source
- 8. Europe East Asia Renewable Energy Market Analysis, Insights and Forecast, 2019-2031
- 8.1. Market Analysis, Insights and Forecast - by Source
- 8.1.1. Solar
- 8.1.2. Wind
- 8.1.3. Hydro
- 8.1.4. Other Sources
- 8.2. Market Analysis, Insights and Forecast - by Geogrpahy
- 8.2.1. China
- 8.2.2. Japan
- 8.2.3. South Korea
- 8.2.4. Taiwan
- 8.2.5. Rest of East Asia
- 8.1. Market Analysis, Insights and Forecast - by Source
- 9. Middle East & Africa East Asia Renewable Energy Market Analysis, Insights and Forecast, 2019-2031
- 9.1. Market Analysis, Insights and Forecast - by Source
- 9.1.1. Solar
- 9.1.2. Wind
- 9.1.3. Hydro
- 9.1.4. Other Sources
- 9.2. Market Analysis, Insights and Forecast - by Geogrpahy
- 9.2.1. China
- 9.2.2. Japan
- 9.2.3. South Korea
- 9.2.4. Taiwan
- 9.2.5. Rest of East Asia
- 9.1. Market Analysis, Insights and Forecast - by Source
- 10. Asia Pacific East Asia Renewable Energy Market Analysis, Insights and Forecast, 2019-2031
- 10.1. Market Analysis, Insights and Forecast - by Source
- 10.1.1. Solar
- 10.1.2. Wind
- 10.1.3. Hydro
- 10.1.4. Other Sources
- 10.2. Market Analysis, Insights and Forecast - by Geogrpahy
- 10.2.1. China
- 10.2.2. Japan
- 10.2.3. South Korea
- 10.2.4. Taiwan
- 10.2.5. Rest of East Asia
- 10.1. Market Analysis, Insights and Forecast - by Source
- 11. China East Asia Renewable Energy Market Analysis, Insights and Forecast, 2019-2031
- 12. Japan East Asia Renewable Energy Market Analysis, Insights and Forecast, 2019-2031
- 13. India East Asia Renewable Energy Market Analysis, Insights and Forecast, 2019-2031
- 14. South Korea East Asia Renewable Energy Market Analysis, Insights and Forecast, 2019-2031
- 15. Taiwan East Asia Renewable Energy Market Analysis, Insights and Forecast, 2019-2031
- 16. Australia East Asia Renewable Energy Market Analysis, Insights and Forecast, 2019-2031
- 17. Rest of Asia-Pacific East Asia Renewable Energy Market Analysis, Insights and Forecast, 2019-2031
- 18. Competitive Analysis
- 18.1. Global Market Share Analysis 2024
- 18.2. Company Profiles
- 18.2.1 JinkoSolar Holding Co Ltd
- 18.2.1.1. Overview
- 18.2.1.2. Products
- 18.2.1.3. SWOT Analysis
- 18.2.1.4. Recent Developments
- 18.2.1.5. Financials (Based on Availability)
- 18.2.2 Korea South East Power Co Ltd
- 18.2.2.1. Overview
- 18.2.2.2. Products
- 18.2.2.3. SWOT Analysis
- 18.2.2.4. Recent Developments
- 18.2.2.5. Financials (Based on Availability)
- 18.2.3 Mitsubishi Corporation
- 18.2.3.1. Overview
- 18.2.3.2. Products
- 18.2.3.3. SWOT Analysis
- 18.2.3.4. Recent Developments
- 18.2.3.5. Financials (Based on Availability)
- 18.2.4 JA Solar Holdings Co Ltd
- 18.2.4.1. Overview
- 18.2.4.2. Products
- 18.2.4.3. SWOT Analysis
- 18.2.4.4. Recent Developments
- 18.2.4.5. Financials (Based on Availability)
- 18.2.5 Vestas Wind Systems A/S
- 18.2.5.1. Overview
- 18.2.5.2. Products
- 18.2.5.3. SWOT Analysis
- 18.2.5.4. Recent Developments
- 18.2.5.5. Financials (Based on Availability)
- 18.2.6 Eurus Energy Holdings Corporation
- 18.2.6.1. Overview
- 18.2.6.2. Products
- 18.2.6.3. SWOT Analysis
- 18.2.6.4. Recent Developments
- 18.2.6.5. Financials (Based on Availability)
- 18.2.7 Siemens Gamesa Renewable Energy SA
- 18.2.7.1. Overview
- 18.2.7.2. Products
- 18.2.7.3. SWOT Analysis
- 18.2.7.4. Recent Developments
- 18.2.7.5. Financials (Based on Availability)
- 18.2.8 LONGi Green Energy Technology Co Ltd
- 18.2.8.1. Overview
- 18.2.8.2. Products
- 18.2.8.3. SWOT Analysis
- 18.2.8.4. Recent Developments
- 18.2.8.5. Financials (Based on Availability)
- 18.2.9 Xinjiang Goldwind Science & Technology Co
- 18.2.9.1. Overview
- 18.2.9.2. Products
- 18.2.9.3. SWOT Analysis
- 18.2.9.4. Recent Developments
- 18.2.9.5. Financials (Based on Availability)
- 18.2.10 Trina Solar Limited
- 18.2.10.1. Overview
- 18.2.10.2. Products
- 18.2.10.3. SWOT Analysis
- 18.2.10.4. Recent Developments
- 18.2.10.5. Financials (Based on Availability)
- 18.2.1 JinkoSolar Holding Co Ltd
List of Figures
- Figure 1: Global East Asia Renewable Energy Market Revenue Breakdown (Million, %) by Region 2024 & 2032
- Figure 2: Global East Asia Renewable Energy Market Volume Breakdown (Gigawatte, %) by Region 2024 & 2032
- Figure 3: Asia Pacific East Asia Renewable Energy Market Revenue (Million), by Country 2024 & 2032
- Figure 4: Asia Pacific East Asia Renewable Energy Market Volume (Gigawatte), by Country 2024 & 2032
- Figure 5: Asia Pacific East Asia Renewable Energy Market Revenue Share (%), by Country 2024 & 2032
- Figure 6: Asia Pacific East Asia Renewable Energy Market Volume Share (%), by Country 2024 & 2032
- Figure 7: North America East Asia Renewable Energy Market Revenue (Million), by Source 2024 & 2032
- Figure 8: North America East Asia Renewable Energy Market Volume (Gigawatte), by Source 2024 & 2032
- Figure 9: North America East Asia Renewable Energy Market Revenue Share (%), by Source 2024 & 2032
- Figure 10: North America East Asia Renewable Energy Market Volume Share (%), by Source 2024 & 2032
- Figure 11: North America East Asia Renewable Energy Market Revenue (Million), by Geogrpahy 2024 & 2032
- Figure 12: North America East Asia Renewable Energy Market Volume (Gigawatte), by Geogrpahy 2024 & 2032
- Figure 13: North America East Asia Renewable Energy Market Revenue Share (%), by Geogrpahy 2024 & 2032
- Figure 14: North America East Asia Renewable Energy Market Volume Share (%), by Geogrpahy 2024 & 2032
- Figure 15: North America East Asia Renewable Energy Market Revenue (Million), by Country 2024 & 2032
- Figure 16: North America East Asia Renewable Energy Market Volume (Gigawatte), by Country 2024 & 2032
- Figure 17: North America East Asia Renewable Energy Market Revenue Share (%), by Country 2024 & 2032
- Figure 18: North America East Asia Renewable Energy Market Volume Share (%), by Country 2024 & 2032
- Figure 19: South America East Asia Renewable Energy Market Revenue (Million), by Source 2024 & 2032
- Figure 20: South America East Asia Renewable Energy Market Volume (Gigawatte), by Source 2024 & 2032
- Figure 21: South America East Asia Renewable Energy Market Revenue Share (%), by Source 2024 & 2032
- Figure 22: South America East Asia Renewable Energy Market Volume Share (%), by Source 2024 & 2032
- Figure 23: South America East Asia Renewable Energy Market Revenue (Million), by Geogrpahy 2024 & 2032
- Figure 24: South America East Asia Renewable Energy Market Volume (Gigawatte), by Geogrpahy 2024 & 2032
- Figure 25: South America East Asia Renewable Energy Market Revenue Share (%), by Geogrpahy 2024 & 2032
- Figure 26: South America East Asia Renewable Energy Market Volume Share (%), by Geogrpahy 2024 & 2032
- Figure 27: South America East Asia Renewable Energy Market Revenue (Million), by Country 2024 & 2032
- Figure 28: South America East Asia Renewable Energy Market Volume (Gigawatte), by Country 2024 & 2032
- Figure 29: South America East Asia Renewable Energy Market Revenue Share (%), by Country 2024 & 2032
- Figure 30: South America East Asia Renewable Energy Market Volume Share (%), by Country 2024 & 2032
- Figure 31: Europe East Asia Renewable Energy Market Revenue (Million), by Source 2024 & 2032
- Figure 32: Europe East Asia Renewable Energy Market Volume (Gigawatte), by Source 2024 & 2032
- Figure 33: Europe East Asia Renewable Energy Market Revenue Share (%), by Source 2024 & 2032
- Figure 34: Europe East Asia Renewable Energy Market Volume Share (%), by Source 2024 & 2032
- Figure 35: Europe East Asia Renewable Energy Market Revenue (Million), by Geogrpahy 2024 & 2032
- Figure 36: Europe East Asia Renewable Energy Market Volume (Gigawatte), by Geogrpahy 2024 & 2032
- Figure 37: Europe East Asia Renewable Energy Market Revenue Share (%), by Geogrpahy 2024 & 2032
- Figure 38: Europe East Asia Renewable Energy Market Volume Share (%), by Geogrpahy 2024 & 2032
- Figure 39: Europe East Asia Renewable Energy Market Revenue (Million), by Country 2024 & 2032
- Figure 40: Europe East Asia Renewable Energy Market Volume (Gigawatte), by Country 2024 & 2032
- Figure 41: Europe East Asia Renewable Energy Market Revenue Share (%), by Country 2024 & 2032
- Figure 42: Europe East Asia Renewable Energy Market Volume Share (%), by Country 2024 & 2032
- Figure 43: Middle East & Africa East Asia Renewable Energy Market Revenue (Million), by Source 2024 & 2032
- Figure 44: Middle East & Africa East Asia Renewable Energy Market Volume (Gigawatte), by Source 2024 & 2032
- Figure 45: Middle East & Africa East Asia Renewable Energy Market Revenue Share (%), by Source 2024 & 2032
- Figure 46: Middle East & Africa East Asia Renewable Energy Market Volume Share (%), by Source 2024 & 2032
- Figure 47: Middle East & Africa East Asia Renewable Energy Market Revenue (Million), by Geogrpahy 2024 & 2032
- Figure 48: Middle East & Africa East Asia Renewable Energy Market Volume (Gigawatte), by Geogrpahy 2024 & 2032
- Figure 49: Middle East & Africa East Asia Renewable Energy Market Revenue Share (%), by Geogrpahy 2024 & 2032
- Figure 50: Middle East & Africa East Asia Renewable Energy Market Volume Share (%), by Geogrpahy 2024 & 2032
- Figure 51: Middle East & Africa East Asia Renewable Energy Market Revenue (Million), by Country 2024 & 2032
- Figure 52: Middle East & Africa East Asia Renewable Energy Market Volume (Gigawatte), by Country 2024 & 2032
- Figure 53: Middle East & Africa East Asia Renewable Energy Market Revenue Share (%), by Country 2024 & 2032
- Figure 54: Middle East & Africa East Asia Renewable Energy Market Volume Share (%), by Country 2024 & 2032
- Figure 55: Asia Pacific East Asia Renewable Energy Market Revenue (Million), by Source 2024 & 2032
- Figure 56: Asia Pacific East Asia Renewable Energy Market Volume (Gigawatte), by Source 2024 & 2032
- Figure 57: Asia Pacific East Asia Renewable Energy Market Revenue Share (%), by Source 2024 & 2032
- Figure 58: Asia Pacific East Asia Renewable Energy Market Volume Share (%), by Source 2024 & 2032
- Figure 59: Asia Pacific East Asia Renewable Energy Market Revenue (Million), by Geogrpahy 2024 & 2032
- Figure 60: Asia Pacific East Asia Renewable Energy Market Volume (Gigawatte), by Geogrpahy 2024 & 2032
- Figure 61: Asia Pacific East Asia Renewable Energy Market Revenue Share (%), by Geogrpahy 2024 & 2032
- Figure 62: Asia Pacific East Asia Renewable Energy Market Volume Share (%), by Geogrpahy 2024 & 2032
- Figure 63: Asia Pacific East Asia Renewable Energy Market Revenue (Million), by Country 2024 & 2032
- Figure 64: Asia Pacific East Asia Renewable Energy Market Volume (Gigawatte), by Country 2024 & 2032
- Figure 65: Asia Pacific East Asia Renewable Energy Market Revenue Share (%), by Country 2024 & 2032
- Figure 66: Asia Pacific East Asia Renewable Energy Market Volume Share (%), by Country 2024 & 2032
List of Tables
- Table 1: Global East Asia Renewable Energy Market Revenue Million Forecast, by Region 2019 & 2032
- Table 2: Global East Asia Renewable Energy Market Volume Gigawatte Forecast, by Region 2019 & 2032
- Table 3: Global East Asia Renewable Energy Market Revenue Million Forecast, by Source 2019 & 2032
- Table 4: Global East Asia Renewable Energy Market Volume Gigawatte Forecast, by Source 2019 & 2032
- Table 5: Global East Asia Renewable Energy Market Revenue Million Forecast, by Geogrpahy 2019 & 2032
- Table 6: Global East Asia Renewable Energy Market Volume Gigawatte Forecast, by Geogrpahy 2019 & 2032
- Table 7: Global East Asia Renewable Energy Market Revenue Million Forecast, by Region 2019 & 2032
- Table 8: Global East Asia Renewable Energy Market Volume Gigawatte Forecast, by Region 2019 & 2032
- Table 9: Global East Asia Renewable Energy Market Revenue Million Forecast, by Country 2019 & 2032
- Table 10: Global East Asia Renewable Energy Market Volume Gigawatte Forecast, by Country 2019 & 2032
- Table 11: China East Asia Renewable Energy Market Revenue (Million) Forecast, by Application 2019 & 2032
- Table 12: China East Asia Renewable Energy Market Volume (Gigawatte) Forecast, by Application 2019 & 2032
- Table 13: Japan East Asia Renewable Energy Market Revenue (Million) Forecast, by Application 2019 & 2032
- Table 14: Japan East Asia Renewable Energy Market Volume (Gigawatte) Forecast, by Application 2019 & 2032
- Table 15: India East Asia Renewable Energy Market Revenue (Million) Forecast, by Application 2019 & 2032
- Table 16: India East Asia Renewable Energy Market Volume (Gigawatte) Forecast, by Application 2019 & 2032
- Table 17: South Korea East Asia Renewable Energy Market Revenue (Million) Forecast, by Application 2019 & 2032
- Table 18: South Korea East Asia Renewable Energy Market Volume (Gigawatte) Forecast, by Application 2019 & 2032
- Table 19: Taiwan East Asia Renewable Energy Market Revenue (Million) Forecast, by Application 2019 & 2032
- Table 20: Taiwan East Asia Renewable Energy Market Volume (Gigawatte) Forecast, by Application 2019 & 2032
- Table 21: Australia East Asia Renewable Energy Market Revenue (Million) Forecast, by Application 2019 & 2032
- Table 22: Australia East Asia Renewable Energy Market Volume (Gigawatte) Forecast, by Application 2019 & 2032
- Table 23: Rest of Asia-Pacific East Asia Renewable Energy Market Revenue (Million) Forecast, by Application 2019 & 2032
- Table 24: Rest of Asia-Pacific East Asia Renewable Energy Market Volume (Gigawatte) Forecast, by Application 2019 & 2032
- Table 25: Global East Asia Renewable Energy Market Revenue Million Forecast, by Source 2019 & 2032
- Table 26: Global East Asia Renewable Energy Market Volume Gigawatte Forecast, by Source 2019 & 2032
- Table 27: Global East Asia Renewable Energy Market Revenue Million Forecast, by Geogrpahy 2019 & 2032
- Table 28: Global East Asia Renewable Energy Market Volume Gigawatte Forecast, by Geogrpahy 2019 & 2032
- Table 29: Global East Asia Renewable Energy Market Revenue Million Forecast, by Country 2019 & 2032
- Table 30: Global East Asia Renewable Energy Market Volume Gigawatte Forecast, by Country 2019 & 2032
- Table 31: United States East Asia Renewable Energy Market Revenue (Million) Forecast, by Application 2019 & 2032
- Table 32: United States East Asia Renewable Energy Market Volume (Gigawatte) Forecast, by Application 2019 & 2032
- Table 33: Canada East Asia Renewable Energy Market Revenue (Million) Forecast, by Application 2019 & 2032
- Table 34: Canada East Asia Renewable Energy Market Volume (Gigawatte) Forecast, by Application 2019 & 2032
- Table 35: Mexico East Asia Renewable Energy Market Revenue (Million) Forecast, by Application 2019 & 2032
- Table 36: Mexico East Asia Renewable Energy Market Volume (Gigawatte) Forecast, by Application 2019 & 2032
- Table 37: Global East Asia Renewable Energy Market Revenue Million Forecast, by Source 2019 & 2032
- Table 38: Global East Asia Renewable Energy Market Volume Gigawatte Forecast, by Source 2019 & 2032
- Table 39: Global East Asia Renewable Energy Market Revenue Million Forecast, by Geogrpahy 2019 & 2032
- Table 40: Global East Asia Renewable Energy Market Volume Gigawatte Forecast, by Geogrpahy 2019 & 2032
- Table 41: Global East Asia Renewable Energy Market Revenue Million Forecast, by Country 2019 & 2032
- Table 42: Global East Asia Renewable Energy Market Volume Gigawatte Forecast, by Country 2019 & 2032
- Table 43: Brazil East Asia Renewable Energy Market Revenue (Million) Forecast, by Application 2019 & 2032
- Table 44: Brazil East Asia Renewable Energy Market Volume (Gigawatte) Forecast, by Application 2019 & 2032
- Table 45: Argentina East Asia Renewable Energy Market Revenue (Million) Forecast, by Application 2019 & 2032
- Table 46: Argentina East Asia Renewable Energy Market Volume (Gigawatte) Forecast, by Application 2019 & 2032
- Table 47: Rest of South America East Asia Renewable Energy Market Revenue (Million) Forecast, by Application 2019 & 2032
- Table 48: Rest of South America East Asia Renewable Energy Market Volume (Gigawatte) Forecast, by Application 2019 & 2032
- Table 49: Global East Asia Renewable Energy Market Revenue Million Forecast, by Source 2019 & 2032
- Table 50: Global East Asia Renewable Energy Market Volume Gigawatte Forecast, by Source 2019 & 2032
- Table 51: Global East Asia Renewable Energy Market Revenue Million Forecast, by Geogrpahy 2019 & 2032
- Table 52: Global East Asia Renewable Energy Market Volume Gigawatte Forecast, by Geogrpahy 2019 & 2032
- Table 53: Global East Asia Renewable Energy Market Revenue Million Forecast, by Country 2019 & 2032
- Table 54: Global East Asia Renewable Energy Market Volume Gigawatte Forecast, by Country 2019 & 2032
- Table 55: United Kingdom East Asia Renewable Energy Market Revenue (Million) Forecast, by Application 2019 & 2032
- Table 56: United Kingdom East Asia Renewable Energy Market Volume (Gigawatte) Forecast, by Application 2019 & 2032
- Table 57: Germany East Asia Renewable Energy Market Revenue (Million) Forecast, by Application 2019 & 2032
- Table 58: Germany East Asia Renewable Energy Market Volume (Gigawatte) Forecast, by Application 2019 & 2032
- Table 59: France East Asia Renewable Energy Market Revenue (Million) Forecast, by Application 2019 & 2032
- Table 60: France East Asia Renewable Energy Market Volume (Gigawatte) Forecast, by Application 2019 & 2032
- Table 61: Italy East Asia Renewable Energy Market Revenue (Million) Forecast, by Application 2019 & 2032
- Table 62: Italy East Asia Renewable Energy Market Volume (Gigawatte) Forecast, by Application 2019 & 2032
- Table 63: Spain East Asia Renewable Energy Market Revenue (Million) Forecast, by Application 2019 & 2032
- Table 64: Spain East Asia Renewable Energy Market Volume (Gigawatte) Forecast, by Application 2019 & 2032
- Table 65: Russia East Asia Renewable Energy Market Revenue (Million) Forecast, by Application 2019 & 2032
- Table 66: Russia East Asia Renewable Energy Market Volume (Gigawatte) Forecast, by Application 2019 & 2032
- Table 67: Benelux East Asia Renewable Energy Market Revenue (Million) Forecast, by Application 2019 & 2032
- Table 68: Benelux East Asia Renewable Energy Market Volume (Gigawatte) Forecast, by Application 2019 & 2032
- Table 69: Nordics East Asia Renewable Energy Market Revenue (Million) Forecast, by Application 2019 & 2032
- Table 70: Nordics East Asia Renewable Energy Market Volume (Gigawatte) Forecast, by Application 2019 & 2032
- Table 71: Rest of Europe East Asia Renewable Energy Market Revenue (Million) Forecast, by Application 2019 & 2032
- Table 72: Rest of Europe East Asia Renewable Energy Market Volume (Gigawatte) Forecast, by Application 2019 & 2032
- Table 73: Global East Asia Renewable Energy Market Revenue Million Forecast, by Source 2019 & 2032
- Table 74: Global East Asia Renewable Energy Market Volume Gigawatte Forecast, by Source 2019 & 2032
- Table 75: Global East Asia Renewable Energy Market Revenue Million Forecast, by Geogrpahy 2019 & 2032
- Table 76: Global East Asia Renewable Energy Market Volume Gigawatte Forecast, by Geogrpahy 2019 & 2032
- Table 77: Global East Asia Renewable Energy Market Revenue Million Forecast, by Country 2019 & 2032
- Table 78: Global East Asia Renewable Energy Market Volume Gigawatte Forecast, by Country 2019 & 2032
- Table 79: Turkey East Asia Renewable Energy Market Revenue (Million) Forecast, by Application 2019 & 2032
- Table 80: Turkey East Asia Renewable Energy Market Volume (Gigawatte) Forecast, by Application 2019 & 2032
- Table 81: Israel East Asia Renewable Energy Market Revenue (Million) Forecast, by Application 2019 & 2032
- Table 82: Israel East Asia Renewable Energy Market Volume (Gigawatte) Forecast, by Application 2019 & 2032
- Table 83: GCC East Asia Renewable Energy Market Revenue (Million) Forecast, by Application 2019 & 2032
- Table 84: GCC East Asia Renewable Energy Market Volume (Gigawatte) Forecast, by Application 2019 & 2032
- Table 85: North Africa East Asia Renewable Energy Market Revenue (Million) Forecast, by Application 2019 & 2032
- Table 86: North Africa East Asia Renewable Energy Market Volume (Gigawatte) Forecast, by Application 2019 & 2032
- Table 87: South Africa East Asia Renewable Energy Market Revenue (Million) Forecast, by Application 2019 & 2032
- Table 88: South Africa East Asia Renewable Energy Market Volume (Gigawatte) Forecast, by Application 2019 & 2032
- Table 89: Rest of Middle East & Africa East Asia Renewable Energy Market Revenue (Million) Forecast, by Application 2019 & 2032
- Table 90: Rest of Middle East & Africa East Asia Renewable Energy Market Volume (Gigawatte) Forecast, by Application 2019 & 2032
- Table 91: Global East Asia Renewable Energy Market Revenue Million Forecast, by Source 2019 & 2032
- Table 92: Global East Asia Renewable Energy Market Volume Gigawatte Forecast, by Source 2019 & 2032
- Table 93: Global East Asia Renewable Energy Market Revenue Million Forecast, by Geogrpahy 2019 & 2032
- Table 94: Global East Asia Renewable Energy Market Volume Gigawatte Forecast, by Geogrpahy 2019 & 2032
- Table 95: Global East Asia Renewable Energy Market Revenue Million Forecast, by Country 2019 & 2032
- Table 96: Global East Asia Renewable Energy Market Volume Gigawatte Forecast, by Country 2019 & 2032
- Table 97: China East Asia Renewable Energy Market Revenue (Million) Forecast, by Application 2019 & 2032
- Table 98: China East Asia Renewable Energy Market Volume (Gigawatte) Forecast, by Application 2019 & 2032
- Table 99: India East Asia Renewable Energy Market Revenue (Million) Forecast, by Application 2019 & 2032
- Table 100: India East Asia Renewable Energy Market Volume (Gigawatte) Forecast, by Application 2019 & 2032
- Table 101: Japan East Asia Renewable Energy Market Revenue (Million) Forecast, by Application 2019 & 2032
- Table 102: Japan East Asia Renewable Energy Market Volume (Gigawatte) Forecast, by Application 2019 & 2032
- Table 103: South Korea East Asia Renewable Energy Market Revenue (Million) Forecast, by Application 2019 & 2032
- Table 104: South Korea East Asia Renewable Energy Market Volume (Gigawatte) Forecast, by Application 2019 & 2032
- Table 105: ASEAN East Asia Renewable Energy Market Revenue (Million) Forecast, by Application 2019 & 2032
- Table 106: ASEAN East Asia Renewable Energy Market Volume (Gigawatte) Forecast, by Application 2019 & 2032
- Table 107: Oceania East Asia Renewable Energy Market Revenue (Million) Forecast, by Application 2019 & 2032
- Table 108: Oceania East Asia Renewable Energy Market Volume (Gigawatte) Forecast, by Application 2019 & 2032
- Table 109: Rest of Asia Pacific East Asia Renewable Energy Market Revenue (Million) Forecast, by Application 2019 & 2032
- Table 110: Rest of Asia Pacific East Asia Renewable Energy Market Volume (Gigawatte) Forecast, by Application 2019 & 2032
Frequently Asked Questions
1. What is the projected Compound Annual Growth Rate (CAGR) of the East Asia Renewable Energy Market?
The projected CAGR is approximately > 8.00%.
2. Which companies are prominent players in the East Asia Renewable Energy Market?
Key companies in the market include JinkoSolar Holding Co Ltd, Korea South East Power Co Ltd, Mitsubishi Corporation, JA Solar Holdings Co Ltd, Vestas Wind Systems A/S, Eurus Energy Holdings Corporation, Siemens Gamesa Renewable Energy SA, LONGi Green Energy Technology Co Ltd, Xinjiang Goldwind Science & Technology Co, Trina Solar Limited.
3. What are the main segments of the East Asia Renewable Energy Market?
The market segments include Source, Geogrpahy.
4. Can you provide details about the market size?
The market size is estimated to be USD XX Million as of 2022.
5. What are some drivers contributing to market growth?
4.; Demand for Solar Photovoltaic Installations4.; Growing Investments.
6. What are the notable trends driving market growth?
Solar Energy to Dominate the Market.
7. Are there any restraints impacting market growth?
4.; Increasing Wind Energy Installations.
8. Can you provide examples of recent developments in the market?
May 2022: Lightsource BP, a unit of BP, announced that it would build a 150 MW solar park on around 200 fishery ponds in Budai, Chiayi County, in southwestern Taiwan, in collaboration with Green Rock Energy, with construction starting in June 2023.
9. What pricing options are available for accessing the report?
Pricing options include single-user, multi-user, and enterprise licenses priced at USD 4750, USD 5250, and USD 8750 respectively.
10. Is the market size provided in terms of value or volume?
The market size is provided in terms of value, measured in Million and volume, measured in Gigawatte.
11. Are there any specific market keywords associated with the report?
Yes, the market keyword associated with the report is "East Asia Renewable Energy Market," which aids in identifying and referencing the specific market segment covered.
12. How do I determine which pricing option suits my needs best?
The pricing options vary based on user requirements and access needs. Individual users may opt for single-user licenses, while businesses requiring broader access may choose multi-user or enterprise licenses for cost-effective access to the report.
13. Are there any additional resources or data provided in the East Asia Renewable Energy Market report?
While the report offers comprehensive insights, it's advisable to review the specific contents or supplementary materials provided to ascertain if additional resources or data are available.
14. How can I stay updated on further developments or reports in the East Asia Renewable Energy Market?
To stay informed about further developments, trends, and reports in the East Asia Renewable Energy Market, consider subscribing to industry newsletters, following relevant companies and organizations, or regularly checking reputable industry news sources and publications.
Methodology
Step 1 - Identification of Relevant Samples Size from Population Database


Step 2 - Approaches for Defining Global Market Size (Value, Volume* & Price*)

Note*: In applicable scenarios
Step 3 - Data Sources
Primary Research
- Web Analytics
- Survey Reports
- Research Institute
- Latest Research Reports
- Opinion Leaders
Secondary Research
- Annual Reports
- White Paper
- Latest Press Release
- Industry Association
- Paid Database
- Investor Presentations

Step 4 - Data Triangulation
Involves using different sources of information in order to increase the validity of a study
These sources are likely to be stakeholders in a program - participants, other researchers, program staff, other community members, and so on.
Then we put all data in single framework & apply various statistical tools to find out the dynamic on the market.
During the analysis stage, feedback from the stakeholder groups would be compared to determine areas of agreement as well as areas of divergence
