

Key Insights
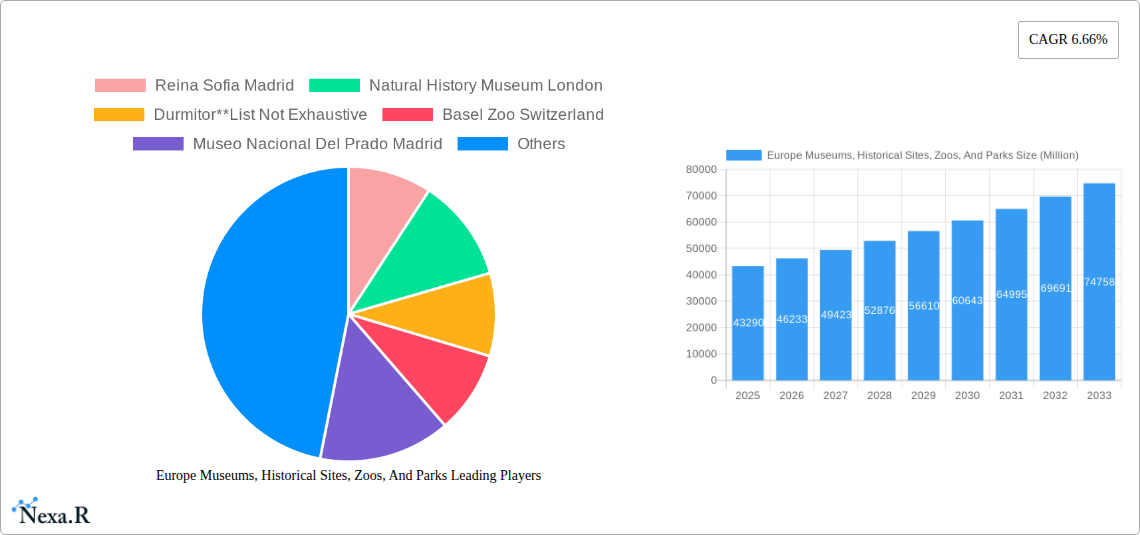
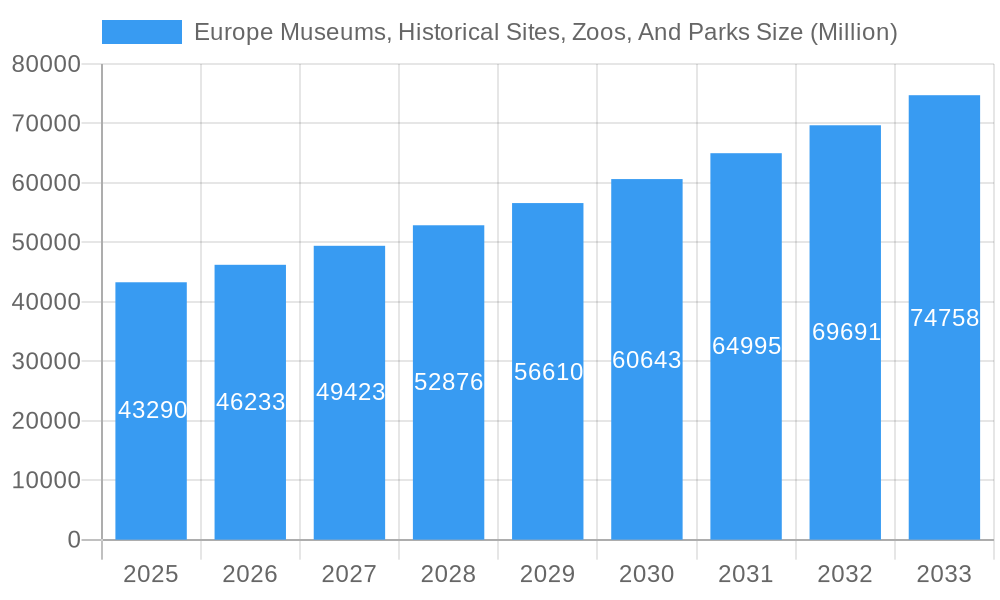
The European museums, historical sites, zoos, and parks market exhibits robust growth potential, projected to reach a market size of €43.29 billion in 2025, expanding at a compound annual growth rate (CAGR) of 6.66% from 2025 to 2033. This expansion is fueled by several key drivers. Firstly, the increasing disposable incomes across Europe, particularly in major economies like Germany, France, and the UK, coupled with a rising interest in leisure activities and cultural experiences, drives significant tourist spending. Secondly, the sector benefits from continuous innovation, including immersive technologies, enhanced visitor experiences, and improved accessibility, attracting wider demographics. Thirdly, strategic government initiatives to promote cultural heritage and tourism contribute significantly to market growth, particularly through funding for infrastructure improvements and marketing campaigns. However, challenges remain, such as seasonal fluctuations in visitor numbers and potential economic downturns affecting consumer spending. Furthermore, maintaining the delicate balance between preservation efforts and the need for commercial viability poses an ongoing challenge for many institutions.
Europe Museums, Historical Sites, Zoos, And Parks Market Size (In Billion)
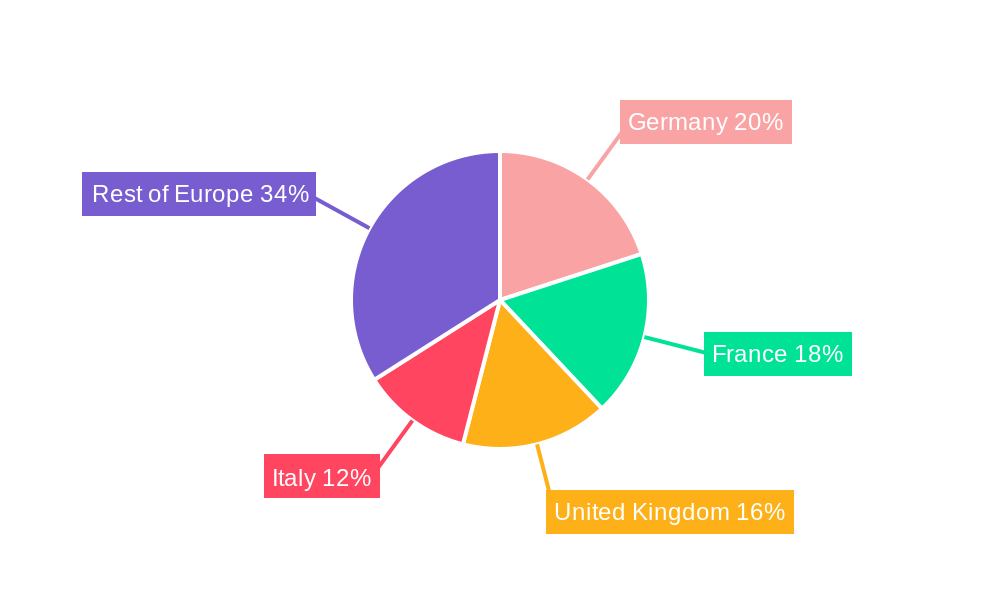
The market segmentation reveals significant opportunities. While "Tickets" remain the primary revenue stream, diversification through "Food and Beverages" and "Other Revenue Sources" (such as merchandise sales, educational programs, and special events) offer substantial growth potential. Among the various facility types, museums and historical sites continue to hold significant market share, benefiting from their enduring appeal to tourists and educational institutions. However, zoos and botanical gardens, and nature parks, are also experiencing notable growth, thanks to a rising focus on conservation and eco-tourism. Geographically, France, Germany, the United Kingdom, and Italy represent the major markets, although emerging markets within "Rest of Europe" show promising expansion trajectories. This necessitates a focused regional strategy, tailored to the unique attributes and tourism patterns of each market, leveraging successful models and adaptations to regional needs and expectations.
Europe Museums, Historical Sites, Zoos, And Parks Company Market Share
Europe Museums, Historical Sites, Zoos, and Parks Market Report: 2019-2033
This comprehensive report provides a detailed analysis of the European museums, historical sites, zoos, and parks market, offering invaluable insights for industry professionals, investors, and strategic planners. The report covers the period 2019-2033, with a base year of 2025 and a forecast period of 2025-2033. Key market segments are analyzed by type (Museums, Historical Sites, Zoos and Botanical Gardens, Nature Parks, Other Similar Institutions), revenue source (Tickets, Food and Beverages, Other Revenue Sources), and country (France, Germany, United Kingdom, Italy, Rest of Europe). The report features prominent players including the Louvre Paris, British Museum London, and Reina Sofia Madrid, among others.
The report's value is in providing detailed analysis and actionable data, enabling informed decision-making. It meticulously details market size evolution, growth drivers, challenges, and lucrative emerging opportunities.
Europe Museums, Historical Sites, Zoos, And Parks Market Dynamics & Structure
The European museums, historical sites, zoos, and parks market is characterized by a moderately concentrated structure, featuring a dynamic interplay between established large-scale organizations and a vibrant ecosystem of smaller, specialized institutions. Digital transformation is a pivotal force, with significant advancements in areas like seamless digital ticketing systems, engaging virtual tours, and highly interactive exhibits. While the adoption of these technologies is accelerating, there remains variability in their implementation across the diverse range of institutions. A robust regulatory environment, encompassing stringent guidelines for accessibility, cultural heritage preservation, and environmental sustainability, profoundly shapes operational strategies and investment decisions. The market faces continuous competition from evolving entertainment alternatives, including dynamic theme parks and increasingly sophisticated online experiences, which necessitate a proactive approach to visitor engagement. The end-user base is exceptionally diverse, attracting families seeking leisure activities, international tourists exploring cultural landmarks, dedicated researchers delving into history, and students pursuing educational opportunities. Mergers and acquisitions (M&A) are a moderate but consistent feature, with strategic consolidations occurring as smaller entities seek to broaden their geographic reach, enhance their service portfolios, and achieve greater operational efficiencies.
- Market Concentration: The market exhibits a moderately fragmented landscape, with a few leading players collectively holding approximately 30-40% market share in 2025, while a substantial number of smaller entities contribute to the overall diversity.
- Technological Innovation: Digitalization is a key enabler of enhanced visitor experiences and new revenue streams. A projected investment of over €5 billion in digital technologies is anticipated across the sector in 2025, though adoption rates are highly dependent on institutional size and resources.
- Regulatory Framework: Evolving environmental protection mandates and increasingly rigorous accessibility standards are significantly impacting operational costs and requiring substantial capital investment in infrastructure upgrades and service adaptations.
- Competitive Substitutes: The burgeoning growth of immersive entertainment options, including escape rooms, interactive digital games, and experiential pop-up events, presents a growing challenge to traditional visitor numbers in certain segments.
- End-User Demographics: The visitor demographic is increasingly diversified, with a notable surge in demand from families and a growing engagement from younger generations (Millennials and Gen Z) seeking authentic and shareable experiences.
- M&A Activity: A moderate level of M&A is anticipated, with an estimated 50-75 strategic deals projected within the forecast period (2025-2030) as organizations pursue growth and consolidation opportunities.
Europe Museums, Historical Sites, Zoos, And Parks Growth Trends & Insights
The European museums, historical sites, zoos, and parks market navigated a period of considerable flux between 2019 and 2024, largely influenced by global health crises and shifts in international tourism patterns. However, a robust recovery and sustained growth trajectory are firmly projected from 2025 onwards. This resurgence is underpinned by several key factors, including the rising disposable incomes of a growing middle class across the continent and a heightened societal interest in enriching cultural and leisure pursuits. Furthermore, the integration of cutting-edge technological advancements, such as increasingly sophisticated virtual reality (VR) and augmented reality (AR) experiences, is poised to significantly elevate visitor engagement and unlock new revenue streams. Emerging consumer behavior patterns highlight a strong preference for personalized visitor journeys, demonstrable sustainability initiatives, and well-curated educational programs. The widespread adoption of digital ticketing systems is continuing its upward trend, leading to improved operational efficiencies and more sophisticated revenue management strategies. The market is projected to expand at a Compound Annual Growth Rate (CAGR) of 5-7% during the forecast period (2025-2033), reaching an estimated market valuation of €120-150 billion by 2033.
Dominant Regions, Countries, or Segments in Europe Museums, Historical Sites, Zoos, And Parks
The United Kingdom, France, and Italy stand out as the principal drivers within the European museums, historical sites, zoos, and parks market. Their preeminence is attributed to their high volumes of international and domestic tourist traffic, exceptionally rich cultural and historical tapestries, and well-established tourism and visitor infrastructure. Segment-wise, museums and historical sites currently capture the largest share of the market. However, zoos and botanical gardens are demonstrating particularly robust growth rates, fueled by their increasing recognition for their vital educational roles and their capacity to offer engaging family entertainment. Ticket sales remain the most substantial source of revenue across the sector, closely followed by sales from food and beverage outlets. Other revenue streams, such as merchandise, memberships, and special event rentals, are also showing promising growth potential.
- Leading Countries: The UK, France, and Italy continue to lead due to sustained high tourist inflows, unparalleled cultural heritage, and advanced visitor infrastructure.
- Leading Segments: Museums and historical sites maintain their dominant market share, with zoos and botanical gardens experiencing notable expansion as key attractions.
- Leading Revenue Streams: Ticket sales are the primary revenue generator, with food and beverage sales representing a significant secondary source; merchandising and membership programs are emerging as increasingly important supplementary revenue streams.
- Growth Drivers: Continued expansion of international and domestic tourism, ongoing investments in infrastructure development, and supportive government funding initiatives are key accelerators.
Europe Museums, Historical Sites, Zoos, And Parks Product Landscape
The product and service landscape within the European museums, historical sites, zoos, and parks market is remarkably diverse and continuously evolving. It encompasses a broad spectrum of offerings, ranging from curated traditional museum exhibits and immersive historical reenactments to dynamic interactive displays, comprehensive educational programs, expertly guided tours, and unique specialized events. Emerging innovations are heavily focused on integrating advanced technologies, such as cutting-edge virtual reality (VR) and augmented reality (AR) applications, to create deeply engaging and memorable visitor experiences. There is also a growing emphasis on developing personalized visitor journeys that cater to individual interests and preferences, alongside sophisticated digital storytelling techniques that bring history and nature to life. Key performance indicators for success are multifaceted, focusing on visitor footfall, revenue generation efficiency, overall customer satisfaction levels, and operational efficiency. The unique selling propositions that differentiate institutions often lie in their exceptionally rare or significant collections, their unparalleled historical importance, or their ability to deliver truly exceptional and unforgettable visitor experiences.
Key Drivers, Barriers & Challenges in Europe Museums, Historical Sites, Zoos, And Parks
Key Drivers: Growing tourism, increasing disposable incomes, government investment in cultural preservation, technological advancements improving visitor experience.
Challenges: High operational costs, funding limitations for smaller institutions, competition from alternative leisure activities, reliance on tourism fluctuations, and maintaining historical preservation while upgrading technologies. For example, the cost of upgrading digital infrastructure for museums can be significant (estimated xx million in 2025).
Emerging Opportunities in Europe Museums, Historical Sites, Zoos, And Parks
Untapped opportunities include expanding educational programs for diverse audiences, leveraging social media for marketing and engagement, developing sustainable tourism initiatives, and creating unique immersive experiences utilizing augmented and virtual reality. These advancements offer significant potential for market growth and differentiation.
Growth Accelerators in the Europe Museums, Historical Sites, Zoos, And Parks Industry
The long-term sustained growth of the European museums, historical sites, zoos, and parks industry will be significantly propelled by several strategic initiatives. These include fostering robust partnerships between cultural institutions and leading technology providers to co-create innovative digital solutions, making substantial investments in upgrading and expanding digital infrastructure, and consistently developing novel, highly engaging experiences that resonate with the evolving preferences of today's visitors. Furthermore, strategic expansion into niche market segments, carefully targeting specific visitor interests or demographic groups, will contribute to broader market penetration and revenue diversification. The overarching strategic imperative for all players in this sector should be a relentless focus on enhancing the value proposition for the visitor and consistently delivering unique, memorable, and impactful experiences that foster repeat visitation and positive word-of-mouth.
Key Players Shaping the Europe Museums, Historical Sites, Zoos, And Parks Market
- Reina Sofia Madrid
- Natural History Museum London
- Durmitor National Park
- Basel Zoo Switzerland
- Museo Nacional Del Prado Madrid
- State Tretyakov Gallery Moscow
- Centre Pompidou Paris
- Chester Zoo England
- Plitvice Lakes National Park
- State Hermitage St Petersburg
- British Museum London
- Pairi Daiza Zoo Southern Belgium
- Zoologischer Garten Berlin AG
- Schonbrunner Zoo Vienna
- Vatican Museums Vatican
- Louvre Paris
Notable Milestones in Europe Museums, Historical Sites, Zoos, And Parks Sector
- September 2022: The Museum of Homelessness (MoH) announced plans to open in London, showcasing the innovative adaptation of museums for social impact.
- March 2023: The opening of the Young V&A in London demonstrates the ongoing investment and innovation in museum experiences.
In-Depth Europe Museums, Historical Sites, Zoos, And Parks Market Outlook
The European museums, historical sites, zoos, and parks market presents substantial long-term growth potential. Strategic investments in technology, innovative experiences, and sustainable tourism practices will be key to capturing this potential. The market's future is promising, with opportunities for both established institutions and new entrants seeking to leverage the evolving preferences of visitors. Focusing on educational outreach, diversified revenue streams, and the enhancement of visitor experience will be critical for success in the coming years.
Europe Museums, Historical Sites, Zoos, And Parks Segmentation
-
1. Type
- 1.1. Museums
- 1.2. Historical Sites
- 1.3. Zoos And Botanical Gardens
- 1.4. Nature Parks
- 1.5. Other Similar Institutions
-
2. Revenue Source
- 2.1. Tickets
- 2.2. Food And Beverages
- 2.3. Other Revenue Souces
Europe Museums, Historical Sites, Zoos, And Parks Segmentation By Geography
-
1. Europe
- 1.1. United Kingdom
- 1.2. Germany
- 1.3. France
- 1.4. Italy
- 1.5. Spain
- 1.6. Netherlands
- 1.7. Belgium
- 1.8. Sweden
- 1.9. Norway
- 1.10. Poland
- 1.11. Denmark
Europe Museums, Historical Sites, Zoos, And Parks Regional Market Share
Geographic Coverage of Europe Museums, Historical Sites, Zoos, And Parks
Europe Museums, Historical Sites, Zoos, And Parks REPORT HIGHLIGHTS
| Aspects | Details |
|---|---|
| Study Period | 2020-2034 |
| Base Year | 2025 |
| Estimated Year | 2026 |
| Forecast Period | 2026-2034 |
| Historical Period | 2020-2025 |
| Growth Rate | CAGR of 6.66% from 2020-2034 |
| Segmentation |
|
Table of Contents
- 1. Introduction
- 1.1. Research Scope
- 1.2. Market Segmentation
- 1.3. Research Objective
- 1.4. Definitions and Assumptions
- 2. Executive Summary
- 2.1. Market Snapshot
- 3. Market Dynamics
- 3.1. Market Drivers
- 3.2. Market Restrains
- 3.3. Market Trends
- 3.4. Market Opportunities
- 4. Market Factor Analysis
- 4.1. Porters Five Forces
- 4.1.1. Bargaining Power of Suppliers
- 4.1.2. Bargaining Power of Buyers
- 4.1.3. Threat of New Entrants
- 4.1.4. Threat of Substitutes
- 4.1.5. Competitive Rivalry
- 4.2. PESTEL analysis
- 4.3. BCG Analysis
- 4.3.1. Stars (High Growth, High Market Share)
- 4.3.2. Cash Cows (Low Growth, High Market Share)
- 4.3.3. Question Mark (High Growth, Low Market Share)
- 4.3.4. Dogs (Low Growth, Low Market Share)
- 4.4. Ansoff Matrix Analysis
- 4.5. Supply Chain Analysis
- 4.6. Regulatory Landscape
- 4.7. Current Market Potential and Opportunity Assessment (TAM–SAM–SOM Framework)
- 4.8. NRP Analyst Note
- 4.1. Porters Five Forces
- 5. Market Analysis, Insights and Forecast 2021-2033
- 5.1. Market Analysis, Insights and Forecast - by Type
- 5.1.1. Museums
- 5.1.2. Historical Sites
- 5.1.3. Zoos And Botanical Gardens
- 5.1.4. Nature Parks
- 5.1.5. Other Similar Institutions
- 5.2. Market Analysis, Insights and Forecast - by Revenue Source
- 5.2.1. Tickets
- 5.2.2. Food And Beverages
- 5.2.3. Other Revenue Souces
- 5.3. Market Analysis, Insights and Forecast - by Region
- 5.3.1. Europe
- 5.1. Market Analysis, Insights and Forecast - by Type
- 6. Europe Museums, Historical Sites, Zoos, And Parks Analysis, Insights and Forecast, 2021-2033
- 6.1. Market Analysis, Insights and Forecast - by Type
- 6.1.1. Museums
- 6.1.2. Historical Sites
- 6.1.3. Zoos And Botanical Gardens
- 6.1.4. Nature Parks
- 6.1.5. Other Similar Institutions
- 6.2. Market Analysis, Insights and Forecast - by Revenue Source
- 6.2.1. Tickets
- 6.2.2. Food And Beverages
- 6.2.3. Other Revenue Souces
- 6.1. Market Analysis, Insights and Forecast - by Type
- 7. Competitive Analysis
- 7.1. Company Profiles
- 7.1.1 Reina Sofia Madrid
- 7.1.1.1. Company Overview
- 7.1.1.2. Products
- 7.1.1.3. Company Financials
- 7.1.1.4. SWOT Analysis
- 7.1.2 Natural History Museum London
- 7.1.2.1. Company Overview
- 7.1.2.2. Products
- 7.1.2.3. Company Financials
- 7.1.2.4. SWOT Analysis
- 7.1.3 Durmitor**List Not Exhaustive
- 7.1.3.1. Company Overview
- 7.1.3.2. Products
- 7.1.3.3. Company Financials
- 7.1.3.4. SWOT Analysis
- 7.1.4 Basel Zoo Switzerland
- 7.1.4.1. Company Overview
- 7.1.4.2. Products
- 7.1.4.3. Company Financials
- 7.1.4.4. SWOT Analysis
- 7.1.5 Museo Nacional Del Prado Madrid
- 7.1.5.1. Company Overview
- 7.1.5.2. Products
- 7.1.5.3. Company Financials
- 7.1.5.4. SWOT Analysis
- 7.1.6 State Tretyakov Gallery Moscow
- 7.1.6.1. Company Overview
- 7.1.6.2. Products
- 7.1.6.3. Company Financials
- 7.1.6.4. SWOT Analysis
- 7.1.7 Centre Pompidou Paris
- 7.1.7.1. Company Overview
- 7.1.7.2. Products
- 7.1.7.3. Company Financials
- 7.1.7.4. SWOT Analysis
- 7.1.8 Chester Zoo England
- 7.1.8.1. Company Overview
- 7.1.8.2. Products
- 7.1.8.3. Company Financials
- 7.1.8.4. SWOT Analysis
- 7.1.9 Plitvice Lakes National Park
- 7.1.9.1. Company Overview
- 7.1.9.2. Products
- 7.1.9.3. Company Financials
- 7.1.9.4. SWOT Analysis
- 7.1.10 State Hermitage St Petersburg
- 7.1.10.1. Company Overview
- 7.1.10.2. Products
- 7.1.10.3. Company Financials
- 7.1.10.4. SWOT Analysis
- 7.1.11 British Museum London
- 7.1.11.1. Company Overview
- 7.1.11.2. Products
- 7.1.11.3. Company Financials
- 7.1.11.4. SWOT Analysis
- 7.1.12 Pairi Daiza Zoo Southern Belgium
- 7.1.12.1. Company Overview
- 7.1.12.2. Products
- 7.1.12.3. Company Financials
- 7.1.12.4. SWOT Analysis
- 7.1.13 Zoologischer Garten Berlin AG
- 7.1.13.1. Company Overview
- 7.1.13.2. Products
- 7.1.13.3. Company Financials
- 7.1.13.4. SWOT Analysis
- 7.1.14 Schonbrunner Zoo Vienna
- 7.1.14.1. Company Overview
- 7.1.14.2. Products
- 7.1.14.3. Company Financials
- 7.1.14.4. SWOT Analysis
- 7.1.15 Vatican Museums Vatican
- 7.1.15.1. Company Overview
- 7.1.15.2. Products
- 7.1.15.3. Company Financials
- 7.1.15.4. SWOT Analysis
- 7.1.16 Louvre Paris
- 7.1.16.1. Company Overview
- 7.1.16.2. Products
- 7.1.16.3. Company Financials
- 7.1.16.4. SWOT Analysis
- 7.1.1 Reina Sofia Madrid
- 7.2. Market Entropy
- 7.2.1 Company's Key Areas Served
- 7.2.2 Recent Developments
- 7.3. Company Market Share Analysis 2025
- 7.3.1 Top 5 Companies Market Share Analysis
- 7.3.2 Top 3 Companies Market Share Analysis
- 7.4. List of Potential Customers
- 8. Research Methodology
List of Figures
- Figure 1: Europe Museums, Historical Sites, Zoos, And Parks Revenue Breakdown (Million, %) by Product 2025 & 2033
- Figure 2: Europe Museums, Historical Sites, Zoos, And Parks Share (%) by Company 2025
List of Tables
- Table 1: Europe Museums, Historical Sites, Zoos, And Parks Revenue Million Forecast, by Type 2020 & 2033
- Table 2: Europe Museums, Historical Sites, Zoos, And Parks Revenue Million Forecast, by Revenue Source 2020 & 2033
- Table 3: Europe Museums, Historical Sites, Zoos, And Parks Revenue Million Forecast, by Region 2020 & 2033
- Table 4: Europe Museums, Historical Sites, Zoos, And Parks Revenue Million Forecast, by Type 2020 & 2033
- Table 5: Europe Museums, Historical Sites, Zoos, And Parks Revenue Million Forecast, by Revenue Source 2020 & 2033
- Table 6: Europe Museums, Historical Sites, Zoos, And Parks Revenue Million Forecast, by Country 2020 & 2033
- Table 7: United Kingdom Europe Museums, Historical Sites, Zoos, And Parks Revenue (Million) Forecast, by Application 2020 & 2033
- Table 8: Germany Europe Museums, Historical Sites, Zoos, And Parks Revenue (Million) Forecast, by Application 2020 & 2033
- Table 9: France Europe Museums, Historical Sites, Zoos, And Parks Revenue (Million) Forecast, by Application 2020 & 2033
- Table 10: Italy Europe Museums, Historical Sites, Zoos, And Parks Revenue (Million) Forecast, by Application 2020 & 2033
- Table 11: Spain Europe Museums, Historical Sites, Zoos, And Parks Revenue (Million) Forecast, by Application 2020 & 2033
- Table 12: Netherlands Europe Museums, Historical Sites, Zoos, And Parks Revenue (Million) Forecast, by Application 2020 & 2033
- Table 13: Belgium Europe Museums, Historical Sites, Zoos, And Parks Revenue (Million) Forecast, by Application 2020 & 2033
- Table 14: Sweden Europe Museums, Historical Sites, Zoos, And Parks Revenue (Million) Forecast, by Application 2020 & 2033
- Table 15: Norway Europe Museums, Historical Sites, Zoos, And Parks Revenue (Million) Forecast, by Application 2020 & 2033
- Table 16: Poland Europe Museums, Historical Sites, Zoos, And Parks Revenue (Million) Forecast, by Application 2020 & 2033
- Table 17: Denmark Europe Museums, Historical Sites, Zoos, And Parks Revenue (Million) Forecast, by Application 2020 & 2033
Frequently Asked Questions
1. What is the projected Compound Annual Growth Rate (CAGR) of the Europe Museums, Historical Sites, Zoos, And Parks?
The projected CAGR is approximately 6.66%.
2. Which companies are prominent players in the Europe Museums, Historical Sites, Zoos, And Parks?
Key companies in the market include Reina Sofia Madrid, Natural History Museum London, Durmitor**List Not Exhaustive, Basel Zoo Switzerland, Museo Nacional Del Prado Madrid, State Tretyakov Gallery Moscow, Centre Pompidou Paris, Chester Zoo England, Plitvice Lakes National Park, State Hermitage St Petersburg, British Museum London, Pairi Daiza Zoo Southern Belgium, Zoologischer Garten Berlin AG, Schonbrunner Zoo Vienna, Vatican Museums Vatican, Louvre Paris.
3. What are the main segments of the Europe Museums, Historical Sites, Zoos, And Parks?
The market segments include Type, Revenue Source.
4. Can you provide details about the market size?
The market size is estimated to be USD 43.29 Million as of 2022.
5. What are some drivers contributing to market growth?
Rise in the Number of Visitors to Museums is Driving the Market; Digitalization is Driving the Market.
6. What are the notable trends driving market growth?
Rise in the Number of Visitors to Museums is Driving the Market.
7. Are there any restraints impacting market growth?
Maintenance and Preservation Costs; Changing Visitor Preferences.
8. Can you provide examples of recent developments in the market?
March 2023: Young V&A will open its doors in Bethnal Green for the summer holidays after a project that has seen it be transformed from its former iteration as the V&A Museum of Childhood.
9. What pricing options are available for accessing the report?
Pricing options include single-user, multi-user, and enterprise licenses priced at USD 4750, USD 5250, and USD 8750 respectively.
10. Is the market size provided in terms of value or volume?
The market size is provided in terms of value, measured in Million.
11. Are there any specific market keywords associated with the report?
Yes, the market keyword associated with the report is "Europe Museums, Historical Sites, Zoos, And Parks," which aids in identifying and referencing the specific market segment covered.
12. How do I determine which pricing option suits my needs best?
The pricing options vary based on user requirements and access needs. Individual users may opt for single-user licenses, while businesses requiring broader access may choose multi-user or enterprise licenses for cost-effective access to the report.
13. Are there any additional resources or data provided in the Europe Museums, Historical Sites, Zoos, And Parks report?
While the report offers comprehensive insights, it's advisable to review the specific contents or supplementary materials provided to ascertain if additional resources or data are available.
14. How can I stay updated on further developments or reports in the Europe Museums, Historical Sites, Zoos, And Parks?
To stay informed about further developments, trends, and reports in the Europe Museums, Historical Sites, Zoos, And Parks, consider subscribing to industry newsletters, following relevant companies and organizations, or regularly checking reputable industry news sources and publications.
Methodology
Step 1 - Identification of Relevant Samples Size from Population Database


Step 2 - Approaches for Defining Global Market Size (Value, Volume* & Price*)

Note*: In applicable scenarios
Step 3 - Data Sources
Primary Research
- Web Analytics
- Survey Reports
- Research Institute
- Latest Research Reports
- Opinion Leaders
Secondary Research
- Annual Reports
- White Paper
- Latest Press Release
- Industry Association
- Paid Database
- Investor Presentations

Step 4 - Data Triangulation
Involves using different sources of information in order to increase the validity of a study
These sources are likely to be stakeholders in a program - participants, other researchers, program staff, other community members, and so on.
Then we put all data in single framework & apply various statistical tools to find out the dynamic on the market.
During the analysis stage, feedback from the stakeholder groups would be compared to determine areas of agreement as well as areas of divergence