

Key Insights
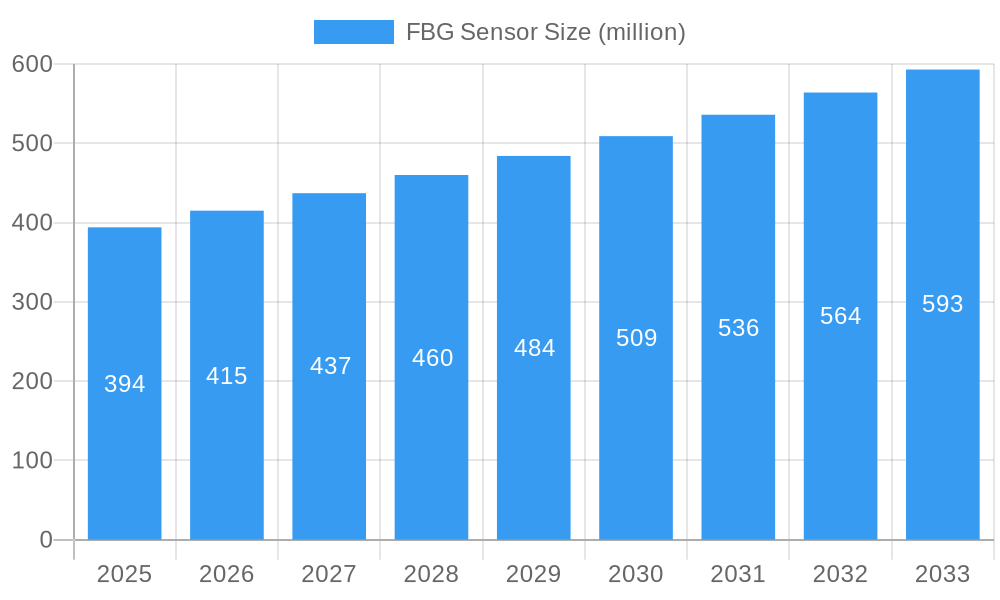
The Fiber Bragg Grating (FBG) Sensor market is projected to experience significant expansion, reaching a market size of 298.4 million by 2024, with a projected Compound Annual Growth Rate (CAGR) of 7.4% from 2024 to 2033. This robust growth is propelled by increasing demand for precise, reliable, and cost-effective sensing solutions across critical sectors such as aerospace, automotive, oil & gas, and healthcare. Technological advancements, including enhanced sensitivity, miniaturization, and the development of multiplexed systems, are key drivers. FBG sensors offer inherent advantages like immunity to electromagnetic interference, resistance to harsh environments, and multi-parameter measurement capabilities, making them increasingly attractive for demanding applications. The proliferation of smart infrastructure and Industry 4.0 initiatives further presents substantial opportunities for FBG sensor integration in real-time monitoring and data acquisition systems.
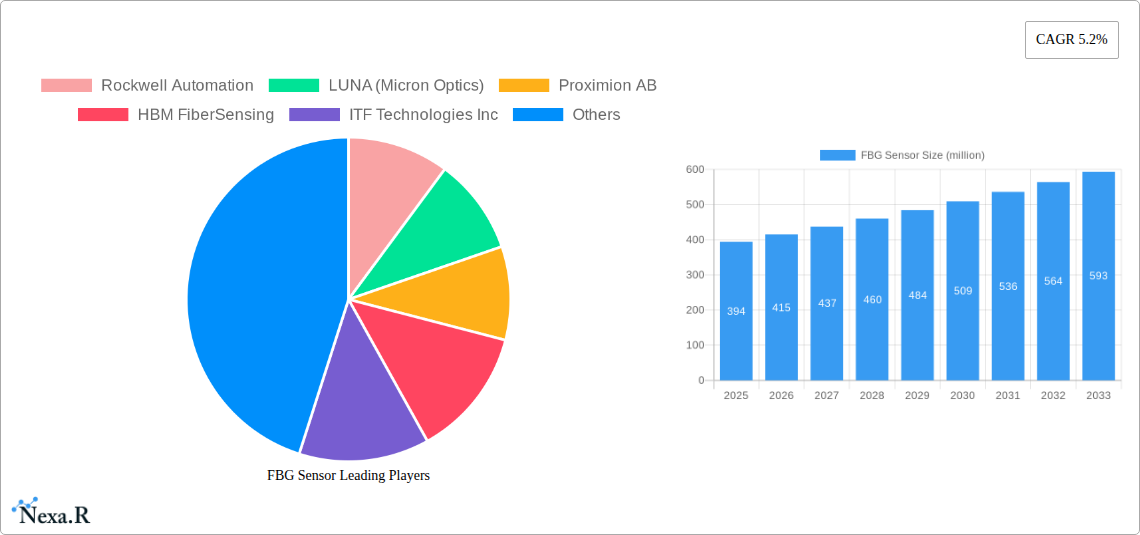
FBG Sensor Market Size (In Million)
While the market outlook is positive, challenges such as high initial investment costs and the need for specialized expertise in installation and maintenance may temper widespread adoption. However, ongoing innovation and economies of scale are expected to gradually mitigate these barriers. The competitive landscape features a diverse array of players, including Rockwell Automation and Luna (Micron Optics), engaged in strategic partnerships, mergers, acquisitions, and continuous product development to secure market share. The inherent advantages and diverse applications of FBG sensors position them for sustained growth and deeper market penetration.
FBG Sensor Company Market Share
This report delivers a comprehensive analysis of the FBG Sensor market, detailing dynamics, growth trends, regional influence, product offerings, key participants, and future projections. The analysis covers the period from 2019 to 2033, with 2024 as the base and estimated year. The forecast period is from 2024-2033, and the historical period spans 2019-2023. This research is invaluable for industry professionals, investors, and researchers seeking to understand and leverage opportunities within this evolving market. The market is valued at 298.4 million in 2024 and is projected to reach substantial figures by 2033.
FBG Sensor Market Dynamics & Structure
The FBG sensor market is characterized by moderate concentration, with key players like Rockwell Automation, LUNA (Micron Optics), and HBM FiberSensing holding significant market share (xx% combined in 2025). Technological innovation, particularly in areas like high-temperature sensing and improved signal processing, is a major growth driver. Stringent regulatory frameworks in certain industries (e.g., aerospace) influence adoption rates. Competitive substitutes, such as other fiber optic sensors and traditional sensor technologies, pose challenges. The end-user demographics are diverse, spanning infrastructure, aerospace, automotive, and healthcare. M&A activity has been relatively low in recent years (xx deals between 2019-2024), with a focus on consolidating expertise and expanding product portfolios. Innovation barriers include high R&D costs and the need for specialized expertise.
- Market Concentration: Moderately concentrated, with top 3 players holding xx% market share in 2025.
- Technological Innovation: Significant advancements in high-temperature sensing and signal processing.
- Regulatory Landscape: Stringent regulations in specific industries (aerospace, oil & gas).
- Competitive Substitutes: Pressure from alternative sensor technologies (e.g., strain gauges).
- End-User Demographics: Diverse, including infrastructure, automotive, and healthcare.
- M&A Activity: Low volume (xx deals 2019-2024), focusing on technological expansion.
FBG Sensor Growth Trends & Insights
The FBG sensor market experienced a CAGR of xx% during the historical period (2019-2024), driven by increasing demand from infrastructure monitoring and the automotive industry. Market penetration is currently at xx% in key segments. Technological disruptions, such as the introduction of miniaturized sensors and improved data analytics capabilities, are accelerating growth. Consumer behavior shifts towards smart infrastructure and advanced manufacturing are further bolstering market expansion. The forecast period (2025-2033) projects a CAGR of xx%, reflecting sustained demand and technological advancements. The adoption rate is expected to significantly increase, reaching xx% market penetration by 2033.
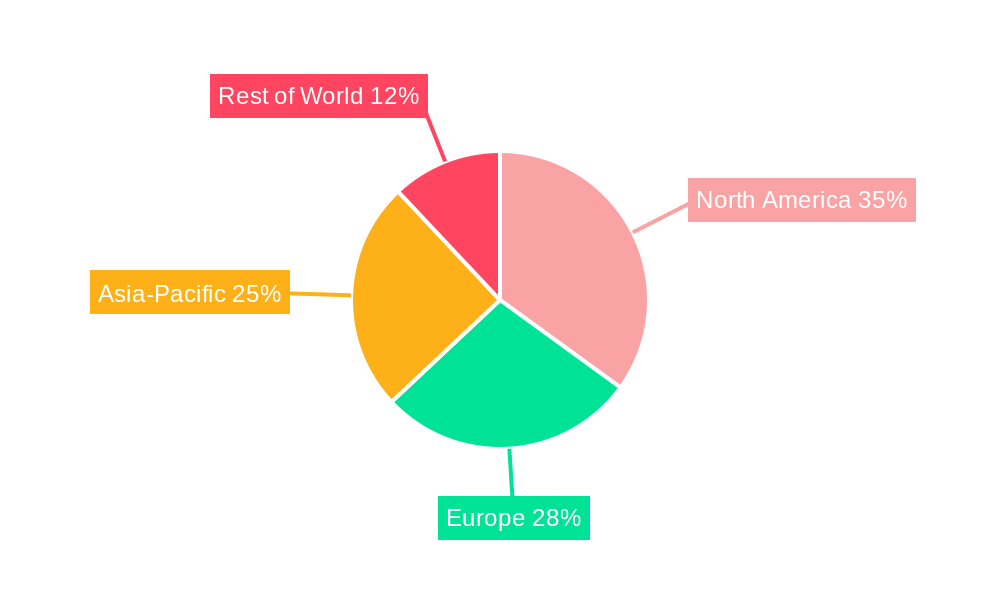
Dominant Regions, Countries, or Segments in FBG Sensor
North America currently holds the largest market share (xx% in 2025) due to robust infrastructure development and a strong focus on advanced manufacturing. Europe follows closely, driven by increasing investments in renewable energy and transportation infrastructure. Asia-Pacific is expected to exhibit the fastest growth rate (xx% CAGR during 2025-2033) fueled by rapid urbanization and industrialization. Specific countries like the US, Germany, China, and Japan are key contributors.
- North America: Largest market share (xx% in 2025), driven by advanced manufacturing.
- Europe: Strong growth due to renewable energy and infrastructure investments.
- Asia-Pacific: Fastest-growing region, fueled by rapid urbanization and industrialization.
- Key Countries: US, Germany, China, Japan.
FBG Sensor Product Landscape
FBG sensors offer a range of advantages including high accuracy, durability, and multiplexing capabilities. Recent product innovations have focused on miniaturization, enhanced sensitivity, and improved temperature tolerance. Applications extend across various sectors, including structural health monitoring, pressure sensing, and strain measurement. Unique selling propositions include real-time data acquisition and remote monitoring capabilities. Technological advancements continue to drive improvements in sensor performance and cost-effectiveness.
Key Drivers, Barriers & Challenges in FBG Sensor
Key Drivers:
- Increasing demand for structural health monitoring in infrastructure projects.
- Growing adoption of FBG sensors in the automotive and aerospace industries.
- Advancements in sensor technology, including miniaturization and improved sensitivity.
- Government initiatives promoting the use of smart infrastructure.
Key Challenges:
- High initial investment costs for implementing FBG sensor systems.
- Complex installation procedures requiring specialized expertise.
- Competition from alternative sensor technologies with lower costs.
- Supply chain disruptions impacting sensor availability and pricing. This resulted in a xx% increase in sensor costs in 2022.
Emerging Opportunities in FBG Sensor
- Expanding applications in healthcare, particularly in biomedical sensing and diagnostics.
- Growing demand for smart agriculture solutions, including soil moisture monitoring and precision irrigation.
- Development of advanced sensor networks for large-scale infrastructure monitoring.
- Increasing adoption in oil & gas exploration and production for pipeline monitoring.
Growth Accelerators in the FBG Sensor Industry
Technological breakthroughs in fiber optic sensing technologies and data analytics are pivotal. Strategic partnerships between sensor manufacturers and system integrators facilitate market expansion. Expansion into new applications and markets, like the Internet of Things (IoT), ensures sustained growth.
Key Players Shaping the FBG Sensor Market
- Rockwell Automation
- LUNA (Micron Optics)
- Proximion AB
- HBM FiberSensing
- ITF Technologies Inc
- NKT Photonics
- FISO Technologies
- Omron
- FBGS Technologies
- Keyence
- Omnisens
- WUTOS
- Bandweaver
- Smart Fibres Limited
- Sensornet
Notable Milestones in FBG Sensor Sector
- 2020: Introduction of a new high-temperature FBG sensor by HBM FiberSensing.
- 2021: Strategic partnership between Rockwell Automation and LUNA for integrated sensor solutions.
- 2022: Launch of a miniaturized FBG sensor by ITF Technologies.
- 2023: Acquisition of a smaller sensor company by Omron, expanding its product portfolio.
- 2024: Significant investment in R&D by NKT Photonics for advanced FBG sensor development.
In-Depth FBG Sensor Market Outlook
The FBG sensor market is poised for significant growth over the next decade, driven by continuous technological innovation and expanding applications across diverse industries. Strategic partnerships, market expansion into emerging economies, and the development of advanced sensor networks will further accelerate market growth. Significant opportunities exist in sectors such as smart cities, renewable energy, and healthcare, presenting lucrative prospects for key players and new entrants.
FBG Sensor Segmentation
-
1. Application
- 1.1. Civil Engineering
- 1.2. Transportation
- 1.3. Energy & Utility
- 1.4. Military
- 1.5. Others
-
2. Types
- 2.1. Point FPG
- 2.2. Distributed FPG
FBG Sensor Segmentation By Geography
-
1. North America
- 1.1. United States
- 1.2. Canada
- 1.3. Mexico
-
2. South America
- 2.1. Brazil
- 2.2. Argentina
- 2.3. Rest of South America
-
3. Europe
- 3.1. United Kingdom
- 3.2. Germany
- 3.3. France
- 3.4. Italy
- 3.5. Spain
- 3.6. Russia
- 3.7. Benelux
- 3.8. Nordics
- 3.9. Rest of Europe
-
4. Middle East & Africa
- 4.1. Turkey
- 4.2. Israel
- 4.3. GCC
- 4.4. North Africa
- 4.5. South Africa
- 4.6. Rest of Middle East & Africa
-
5. Asia Pacific
- 5.1. China
- 5.2. India
- 5.3. Japan
- 5.4. South Korea
- 5.5. ASEAN
- 5.6. Oceania
- 5.7. Rest of Asia Pacific
FBG Sensor Regional Market Share
Geographic Coverage of FBG Sensor
FBG Sensor REPORT HIGHLIGHTS
| Aspects | Details |
|---|---|
| Study Period | 2020-2034 |
| Base Year | 2025 |
| Estimated Year | 2026 |
| Forecast Period | 2026-2034 |
| Historical Period | 2020-2025 |
| Growth Rate | CAGR of 7.4% from 2020-2034 |
| Segmentation |
|
Table of Contents
- 1. Introduction
- 1.1. Research Scope
- 1.2. Market Segmentation
- 1.3. Research Objective
- 1.4. Definitions and Assumptions
- 2. Executive Summary
- 2.1. Market Snapshot
- 3. Market Dynamics
- 3.1. Market Drivers
- 3.2. Market Restrains
- 3.3. Market Trends
- 3.4. Market Opportunities
- 4. Market Factor Analysis
- 4.1. Porters Five Forces
- 4.1.1. Bargaining Power of Suppliers
- 4.1.2. Bargaining Power of Buyers
- 4.1.3. Threat of New Entrants
- 4.1.4. Threat of Substitutes
- 4.1.5. Competitive Rivalry
- 4.2. PESTEL analysis
- 4.3. BCG Analysis
- 4.3.1. Stars (High Growth, High Market Share)
- 4.3.2. Cash Cows (Low Growth, High Market Share)
- 4.3.3. Question Mark (High Growth, Low Market Share)
- 4.3.4. Dogs (Low Growth, Low Market Share)
- 4.4. Ansoff Matrix Analysis
- 4.5. Supply Chain Analysis
- 4.6. Regulatory Landscape
- 4.7. Current Market Potential and Opportunity Assessment (TAM–SAM–SOM Framework)
- 4.8. NRP Analyst Note
- 4.1. Porters Five Forces
- 5. Market Analysis, Insights and Forecast 2021-2033
- 5.1. Market Analysis, Insights and Forecast - by Application
- 5.1.1. Civil Engineering
- 5.1.2. Transportation
- 5.1.3. Energy & Utility
- 5.1.4. Military
- 5.1.5. Others
- 5.2. Market Analysis, Insights and Forecast - by Types
- 5.2.1. Point FPG
- 5.2.2. Distributed FPG
- 5.3. Market Analysis, Insights and Forecast - by Region
- 5.3.1. North America
- 5.3.2. South America
- 5.3.3. Europe
- 5.3.4. Middle East & Africa
- 5.3.5. Asia Pacific
- 5.1. Market Analysis, Insights and Forecast - by Application
- 6. Global FBG Sensor Analysis, Insights and Forecast, 2021-2033
- 6.1. Market Analysis, Insights and Forecast - by Application
- 6.1.1. Civil Engineering
- 6.1.2. Transportation
- 6.1.3. Energy & Utility
- 6.1.4. Military
- 6.1.5. Others
- 6.2. Market Analysis, Insights and Forecast - by Types
- 6.2.1. Point FPG
- 6.2.2. Distributed FPG
- 6.1. Market Analysis, Insights and Forecast - by Application
- 7. North America FBG Sensor Analysis, Insights and Forecast, 2020-2032
- 7.1. Market Analysis, Insights and Forecast - by Application
- 7.1.1. Civil Engineering
- 7.1.2. Transportation
- 7.1.3. Energy & Utility
- 7.1.4. Military
- 7.1.5. Others
- 7.2. Market Analysis, Insights and Forecast - by Types
- 7.2.1. Point FPG
- 7.2.2. Distributed FPG
- 7.1. Market Analysis, Insights and Forecast - by Application
- 8. South America FBG Sensor Analysis, Insights and Forecast, 2020-2032
- 8.1. Market Analysis, Insights and Forecast - by Application
- 8.1.1. Civil Engineering
- 8.1.2. Transportation
- 8.1.3. Energy & Utility
- 8.1.4. Military
- 8.1.5. Others
- 8.2. Market Analysis, Insights and Forecast - by Types
- 8.2.1. Point FPG
- 8.2.2. Distributed FPG
- 8.1. Market Analysis, Insights and Forecast - by Application
- 9. Europe FBG Sensor Analysis, Insights and Forecast, 2020-2032
- 9.1. Market Analysis, Insights and Forecast - by Application
- 9.1.1. Civil Engineering
- 9.1.2. Transportation
- 9.1.3. Energy & Utility
- 9.1.4. Military
- 9.1.5. Others
- 9.2. Market Analysis, Insights and Forecast - by Types
- 9.2.1. Point FPG
- 9.2.2. Distributed FPG
- 9.1. Market Analysis, Insights and Forecast - by Application
- 10. Middle East & Africa FBG Sensor Analysis, Insights and Forecast, 2020-2032
- 10.1. Market Analysis, Insights and Forecast - by Application
- 10.1.1. Civil Engineering
- 10.1.2. Transportation
- 10.1.3. Energy & Utility
- 10.1.4. Military
- 10.1.5. Others
- 10.2. Market Analysis, Insights and Forecast - by Types
- 10.2.1. Point FPG
- 10.2.2. Distributed FPG
- 10.1. Market Analysis, Insights and Forecast - by Application
- 11. Asia Pacific FBG Sensor Analysis, Insights and Forecast, 2020-2032
- 11.1. Market Analysis, Insights and Forecast - by Application
- 11.1.1. Civil Engineering
- 11.1.2. Transportation
- 11.1.3. Energy & Utility
- 11.1.4. Military
- 11.1.5. Others
- 11.2. Market Analysis, Insights and Forecast - by Types
- 11.2.1. Point FPG
- 11.2.2. Distributed FPG
- 11.1. Market Analysis, Insights and Forecast - by Application
- 12. Competitive Analysis
- 12.1. Company Profiles
- 12.1.1 Rockwell Automation
- 12.1.1.1. Company Overview
- 12.1.1.2. Products
- 12.1.1.3. Company Financials
- 12.1.1.4. SWOT Analysis
- 12.1.2 LUNA (Micron Optics)
- 12.1.2.1. Company Overview
- 12.1.2.2. Products
- 12.1.2.3. Company Financials
- 12.1.2.4. SWOT Analysis
- 12.1.3 Proximion AB
- 12.1.3.1. Company Overview
- 12.1.3.2. Products
- 12.1.3.3. Company Financials
- 12.1.3.4. SWOT Analysis
- 12.1.4 HBM FiberSensing
- 12.1.4.1. Company Overview
- 12.1.4.2. Products
- 12.1.4.3. Company Financials
- 12.1.4.4. SWOT Analysis
- 12.1.5 ITF Technologies Inc
- 12.1.5.1. Company Overview
- 12.1.5.2. Products
- 12.1.5.3. Company Financials
- 12.1.5.4. SWOT Analysis
- 12.1.6 NKT Photonics
- 12.1.6.1. Company Overview
- 12.1.6.2. Products
- 12.1.6.3. Company Financials
- 12.1.6.4. SWOT Analysis
- 12.1.7 FISO Technologies
- 12.1.7.1. Company Overview
- 12.1.7.2. Products
- 12.1.7.3. Company Financials
- 12.1.7.4. SWOT Analysis
- 12.1.8 Omron
- 12.1.8.1. Company Overview
- 12.1.8.2. Products
- 12.1.8.3. Company Financials
- 12.1.8.4. SWOT Analysis
- 12.1.9 FBGS Technologies
- 12.1.9.1. Company Overview
- 12.1.9.2. Products
- 12.1.9.3. Company Financials
- 12.1.9.4. SWOT Analysis
- 12.1.10 Keyence
- 12.1.10.1. Company Overview
- 12.1.10.2. Products
- 12.1.10.3. Company Financials
- 12.1.10.4. SWOT Analysis
- 12.1.11 Omnisens
- 12.1.11.1. Company Overview
- 12.1.11.2. Products
- 12.1.11.3. Company Financials
- 12.1.11.4. SWOT Analysis
- 12.1.12 WUTOS
- 12.1.12.1. Company Overview
- 12.1.12.2. Products
- 12.1.12.3. Company Financials
- 12.1.12.4. SWOT Analysis
- 12.1.13 Bandweaver
- 12.1.13.1. Company Overview
- 12.1.13.2. Products
- 12.1.13.3. Company Financials
- 12.1.13.4. SWOT Analysis
- 12.1.14 Smart Fibres Limited
- 12.1.14.1. Company Overview
- 12.1.14.2. Products
- 12.1.14.3. Company Financials
- 12.1.14.4. SWOT Analysis
- 12.1.15 Sensornet
- 12.1.15.1. Company Overview
- 12.1.15.2. Products
- 12.1.15.3. Company Financials
- 12.1.15.4. SWOT Analysis
- 12.1.1 Rockwell Automation
- 12.2. Market Entropy
- 12.2.1 Company's Key Areas Served
- 12.2.2 Recent Developments
- 12.3. Company Market Share Analysis 2025
- 12.3.1 Top 5 Companies Market Share Analysis
- 12.3.2 Top 3 Companies Market Share Analysis
- 12.4. List of Potential Customers
- 13. Research Methodology
List of Figures
- Figure 1: Global FBG Sensor Revenue Breakdown (million, %) by Region 2025 & 2033
- Figure 2: Global FBG Sensor Volume Breakdown (K, %) by Region 2025 & 2033
- Figure 3: North America FBG Sensor Revenue (million), by Application 2025 & 2033
- Figure 4: North America FBG Sensor Volume (K), by Application 2025 & 2033
- Figure 5: North America FBG Sensor Revenue Share (%), by Application 2025 & 2033
- Figure 6: North America FBG Sensor Volume Share (%), by Application 2025 & 2033
- Figure 7: North America FBG Sensor Revenue (million), by Types 2025 & 2033
- Figure 8: North America FBG Sensor Volume (K), by Types 2025 & 2033
- Figure 9: North America FBG Sensor Revenue Share (%), by Types 2025 & 2033
- Figure 10: North America FBG Sensor Volume Share (%), by Types 2025 & 2033
- Figure 11: North America FBG Sensor Revenue (million), by Country 2025 & 2033
- Figure 12: North America FBG Sensor Volume (K), by Country 2025 & 2033
- Figure 13: North America FBG Sensor Revenue Share (%), by Country 2025 & 2033
- Figure 14: North America FBG Sensor Volume Share (%), by Country 2025 & 2033
- Figure 15: South America FBG Sensor Revenue (million), by Application 2025 & 2033
- Figure 16: South America FBG Sensor Volume (K), by Application 2025 & 2033
- Figure 17: South America FBG Sensor Revenue Share (%), by Application 2025 & 2033
- Figure 18: South America FBG Sensor Volume Share (%), by Application 2025 & 2033
- Figure 19: South America FBG Sensor Revenue (million), by Types 2025 & 2033
- Figure 20: South America FBG Sensor Volume (K), by Types 2025 & 2033
- Figure 21: South America FBG Sensor Revenue Share (%), by Types 2025 & 2033
- Figure 22: South America FBG Sensor Volume Share (%), by Types 2025 & 2033
- Figure 23: South America FBG Sensor Revenue (million), by Country 2025 & 2033
- Figure 24: South America FBG Sensor Volume (K), by Country 2025 & 2033
- Figure 25: South America FBG Sensor Revenue Share (%), by Country 2025 & 2033
- Figure 26: South America FBG Sensor Volume Share (%), by Country 2025 & 2033
- Figure 27: Europe FBG Sensor Revenue (million), by Application 2025 & 2033
- Figure 28: Europe FBG Sensor Volume (K), by Application 2025 & 2033
- Figure 29: Europe FBG Sensor Revenue Share (%), by Application 2025 & 2033
- Figure 30: Europe FBG Sensor Volume Share (%), by Application 2025 & 2033
- Figure 31: Europe FBG Sensor Revenue (million), by Types 2025 & 2033
- Figure 32: Europe FBG Sensor Volume (K), by Types 2025 & 2033
- Figure 33: Europe FBG Sensor Revenue Share (%), by Types 2025 & 2033
- Figure 34: Europe FBG Sensor Volume Share (%), by Types 2025 & 2033
- Figure 35: Europe FBG Sensor Revenue (million), by Country 2025 & 2033
- Figure 36: Europe FBG Sensor Volume (K), by Country 2025 & 2033
- Figure 37: Europe FBG Sensor Revenue Share (%), by Country 2025 & 2033
- Figure 38: Europe FBG Sensor Volume Share (%), by Country 2025 & 2033
- Figure 39: Middle East & Africa FBG Sensor Revenue (million), by Application 2025 & 2033
- Figure 40: Middle East & Africa FBG Sensor Volume (K), by Application 2025 & 2033
- Figure 41: Middle East & Africa FBG Sensor Revenue Share (%), by Application 2025 & 2033
- Figure 42: Middle East & Africa FBG Sensor Volume Share (%), by Application 2025 & 2033
- Figure 43: Middle East & Africa FBG Sensor Revenue (million), by Types 2025 & 2033
- Figure 44: Middle East & Africa FBG Sensor Volume (K), by Types 2025 & 2033
- Figure 45: Middle East & Africa FBG Sensor Revenue Share (%), by Types 2025 & 2033
- Figure 46: Middle East & Africa FBG Sensor Volume Share (%), by Types 2025 & 2033
- Figure 47: Middle East & Africa FBG Sensor Revenue (million), by Country 2025 & 2033
- Figure 48: Middle East & Africa FBG Sensor Volume (K), by Country 2025 & 2033
- Figure 49: Middle East & Africa FBG Sensor Revenue Share (%), by Country 2025 & 2033
- Figure 50: Middle East & Africa FBG Sensor Volume Share (%), by Country 2025 & 2033
- Figure 51: Asia Pacific FBG Sensor Revenue (million), by Application 2025 & 2033
- Figure 52: Asia Pacific FBG Sensor Volume (K), by Application 2025 & 2033
- Figure 53: Asia Pacific FBG Sensor Revenue Share (%), by Application 2025 & 2033
- Figure 54: Asia Pacific FBG Sensor Volume Share (%), by Application 2025 & 2033
- Figure 55: Asia Pacific FBG Sensor Revenue (million), by Types 2025 & 2033
- Figure 56: Asia Pacific FBG Sensor Volume (K), by Types 2025 & 2033
- Figure 57: Asia Pacific FBG Sensor Revenue Share (%), by Types 2025 & 2033
- Figure 58: Asia Pacific FBG Sensor Volume Share (%), by Types 2025 & 2033
- Figure 59: Asia Pacific FBG Sensor Revenue (million), by Country 2025 & 2033
- Figure 60: Asia Pacific FBG Sensor Volume (K), by Country 2025 & 2033
- Figure 61: Asia Pacific FBG Sensor Revenue Share (%), by Country 2025 & 2033
- Figure 62: Asia Pacific FBG Sensor Volume Share (%), by Country 2025 & 2033
List of Tables
- Table 1: Global FBG Sensor Revenue million Forecast, by Application 2020 & 2033
- Table 2: Global FBG Sensor Volume K Forecast, by Application 2020 & 2033
- Table 3: Global FBG Sensor Revenue million Forecast, by Types 2020 & 2033
- Table 4: Global FBG Sensor Volume K Forecast, by Types 2020 & 2033
- Table 5: Global FBG Sensor Revenue million Forecast, by Region 2020 & 2033
- Table 6: Global FBG Sensor Volume K Forecast, by Region 2020 & 2033
- Table 7: Global FBG Sensor Revenue million Forecast, by Application 2020 & 2033
- Table 8: Global FBG Sensor Volume K Forecast, by Application 2020 & 2033
- Table 9: Global FBG Sensor Revenue million Forecast, by Types 2020 & 2033
- Table 10: Global FBG Sensor Volume K Forecast, by Types 2020 & 2033
- Table 11: Global FBG Sensor Revenue million Forecast, by Country 2020 & 2033
- Table 12: Global FBG Sensor Volume K Forecast, by Country 2020 & 2033
- Table 13: United States FBG Sensor Revenue (million) Forecast, by Application 2020 & 2033
- Table 14: United States FBG Sensor Volume (K) Forecast, by Application 2020 & 2033
- Table 15: Canada FBG Sensor Revenue (million) Forecast, by Application 2020 & 2033
- Table 16: Canada FBG Sensor Volume (K) Forecast, by Application 2020 & 2033
- Table 17: Mexico FBG Sensor Revenue (million) Forecast, by Application 2020 & 2033
- Table 18: Mexico FBG Sensor Volume (K) Forecast, by Application 2020 & 2033
- Table 19: Global FBG Sensor Revenue million Forecast, by Application 2020 & 2033
- Table 20: Global FBG Sensor Volume K Forecast, by Application 2020 & 2033
- Table 21: Global FBG Sensor Revenue million Forecast, by Types 2020 & 2033
- Table 22: Global FBG Sensor Volume K Forecast, by Types 2020 & 2033
- Table 23: Global FBG Sensor Revenue million Forecast, by Country 2020 & 2033
- Table 24: Global FBG Sensor Volume K Forecast, by Country 2020 & 2033
- Table 25: Brazil FBG Sensor Revenue (million) Forecast, by Application 2020 & 2033
- Table 26: Brazil FBG Sensor Volume (K) Forecast, by Application 2020 & 2033
- Table 27: Argentina FBG Sensor Revenue (million) Forecast, by Application 2020 & 2033
- Table 28: Argentina FBG Sensor Volume (K) Forecast, by Application 2020 & 2033
- Table 29: Rest of South America FBG Sensor Revenue (million) Forecast, by Application 2020 & 2033
- Table 30: Rest of South America FBG Sensor Volume (K) Forecast, by Application 2020 & 2033
- Table 31: Global FBG Sensor Revenue million Forecast, by Application 2020 & 2033
- Table 32: Global FBG Sensor Volume K Forecast, by Application 2020 & 2033
- Table 33: Global FBG Sensor Revenue million Forecast, by Types 2020 & 2033
- Table 34: Global FBG Sensor Volume K Forecast, by Types 2020 & 2033
- Table 35: Global FBG Sensor Revenue million Forecast, by Country 2020 & 2033
- Table 36: Global FBG Sensor Volume K Forecast, by Country 2020 & 2033
- Table 37: United Kingdom FBG Sensor Revenue (million) Forecast, by Application 2020 & 2033
- Table 38: United Kingdom FBG Sensor Volume (K) Forecast, by Application 2020 & 2033
- Table 39: Germany FBG Sensor Revenue (million) Forecast, by Application 2020 & 2033
- Table 40: Germany FBG Sensor Volume (K) Forecast, by Application 2020 & 2033
- Table 41: France FBG Sensor Revenue (million) Forecast, by Application 2020 & 2033
- Table 42: France FBG Sensor Volume (K) Forecast, by Application 2020 & 2033
- Table 43: Italy FBG Sensor Revenue (million) Forecast, by Application 2020 & 2033
- Table 44: Italy FBG Sensor Volume (K) Forecast, by Application 2020 & 2033
- Table 45: Spain FBG Sensor Revenue (million) Forecast, by Application 2020 & 2033
- Table 46: Spain FBG Sensor Volume (K) Forecast, by Application 2020 & 2033
- Table 47: Russia FBG Sensor Revenue (million) Forecast, by Application 2020 & 2033
- Table 48: Russia FBG Sensor Volume (K) Forecast, by Application 2020 & 2033
- Table 49: Benelux FBG Sensor Revenue (million) Forecast, by Application 2020 & 2033
- Table 50: Benelux FBG Sensor Volume (K) Forecast, by Application 2020 & 2033
- Table 51: Nordics FBG Sensor Revenue (million) Forecast, by Application 2020 & 2033
- Table 52: Nordics FBG Sensor Volume (K) Forecast, by Application 2020 & 2033
- Table 53: Rest of Europe FBG Sensor Revenue (million) Forecast, by Application 2020 & 2033
- Table 54: Rest of Europe FBG Sensor Volume (K) Forecast, by Application 2020 & 2033
- Table 55: Global FBG Sensor Revenue million Forecast, by Application 2020 & 2033
- Table 56: Global FBG Sensor Volume K Forecast, by Application 2020 & 2033
- Table 57: Global FBG Sensor Revenue million Forecast, by Types 2020 & 2033
- Table 58: Global FBG Sensor Volume K Forecast, by Types 2020 & 2033
- Table 59: Global FBG Sensor Revenue million Forecast, by Country 2020 & 2033
- Table 60: Global FBG Sensor Volume K Forecast, by Country 2020 & 2033
- Table 61: Turkey FBG Sensor Revenue (million) Forecast, by Application 2020 & 2033
- Table 62: Turkey FBG Sensor Volume (K) Forecast, by Application 2020 & 2033
- Table 63: Israel FBG Sensor Revenue (million) Forecast, by Application 2020 & 2033
- Table 64: Israel FBG Sensor Volume (K) Forecast, by Application 2020 & 2033
- Table 65: GCC FBG Sensor Revenue (million) Forecast, by Application 2020 & 2033
- Table 66: GCC FBG Sensor Volume (K) Forecast, by Application 2020 & 2033
- Table 67: North Africa FBG Sensor Revenue (million) Forecast, by Application 2020 & 2033
- Table 68: North Africa FBG Sensor Volume (K) Forecast, by Application 2020 & 2033
- Table 69: South Africa FBG Sensor Revenue (million) Forecast, by Application 2020 & 2033
- Table 70: South Africa FBG Sensor Volume (K) Forecast, by Application 2020 & 2033
- Table 71: Rest of Middle East & Africa FBG Sensor Revenue (million) Forecast, by Application 2020 & 2033
- Table 72: Rest of Middle East & Africa FBG Sensor Volume (K) Forecast, by Application 2020 & 2033
- Table 73: Global FBG Sensor Revenue million Forecast, by Application 2020 & 2033
- Table 74: Global FBG Sensor Volume K Forecast, by Application 2020 & 2033
- Table 75: Global FBG Sensor Revenue million Forecast, by Types 2020 & 2033
- Table 76: Global FBG Sensor Volume K Forecast, by Types 2020 & 2033
- Table 77: Global FBG Sensor Revenue million Forecast, by Country 2020 & 2033
- Table 78: Global FBG Sensor Volume K Forecast, by Country 2020 & 2033
- Table 79: China FBG Sensor Revenue (million) Forecast, by Application 2020 & 2033
- Table 80: China FBG Sensor Volume (K) Forecast, by Application 2020 & 2033
- Table 81: India FBG Sensor Revenue (million) Forecast, by Application 2020 & 2033
- Table 82: India FBG Sensor Volume (K) Forecast, by Application 2020 & 2033
- Table 83: Japan FBG Sensor Revenue (million) Forecast, by Application 2020 & 2033
- Table 84: Japan FBG Sensor Volume (K) Forecast, by Application 2020 & 2033
- Table 85: South Korea FBG Sensor Revenue (million) Forecast, by Application 2020 & 2033
- Table 86: South Korea FBG Sensor Volume (K) Forecast, by Application 2020 & 2033
- Table 87: ASEAN FBG Sensor Revenue (million) Forecast, by Application 2020 & 2033
- Table 88: ASEAN FBG Sensor Volume (K) Forecast, by Application 2020 & 2033
- Table 89: Oceania FBG Sensor Revenue (million) Forecast, by Application 2020 & 2033
- Table 90: Oceania FBG Sensor Volume (K) Forecast, by Application 2020 & 2033
- Table 91: Rest of Asia Pacific FBG Sensor Revenue (million) Forecast, by Application 2020 & 2033
- Table 92: Rest of Asia Pacific FBG Sensor Volume (K) Forecast, by Application 2020 & 2033
Frequently Asked Questions
1. What is the projected Compound Annual Growth Rate (CAGR) of the FBG Sensor?
The projected CAGR is approximately 7.4%.
2. Which companies are prominent players in the FBG Sensor?
Key companies in the market include Rockwell Automation, LUNA (Micron Optics), Proximion AB, HBM FiberSensing, ITF Technologies Inc, NKT Photonics, FISO Technologies, Omron, FBGS Technologies, Keyence, Omnisens, WUTOS, Bandweaver, Smart Fibres Limited, Sensornet.
3. What are the main segments of the FBG Sensor?
The market segments include Application, Types.
4. Can you provide details about the market size?
The market size is estimated to be USD 298.4 million as of 2022.
5. What are some drivers contributing to market growth?
N/A
6. What are the notable trends driving market growth?
N/A
7. Are there any restraints impacting market growth?
N/A
8. Can you provide examples of recent developments in the market?
N/A
9. What pricing options are available for accessing the report?
Pricing options include single-user, multi-user, and enterprise licenses priced at USD 3950.00, USD 5925.00, and USD 7900.00 respectively.
10. Is the market size provided in terms of value or volume?
The market size is provided in terms of value, measured in million and volume, measured in K.
11. Are there any specific market keywords associated with the report?
Yes, the market keyword associated with the report is "FBG Sensor," which aids in identifying and referencing the specific market segment covered.
12. How do I determine which pricing option suits my needs best?
The pricing options vary based on user requirements and access needs. Individual users may opt for single-user licenses, while businesses requiring broader access may choose multi-user or enterprise licenses for cost-effective access to the report.
13. Are there any additional resources or data provided in the FBG Sensor report?
While the report offers comprehensive insights, it's advisable to review the specific contents or supplementary materials provided to ascertain if additional resources or data are available.
14. How can I stay updated on further developments or reports in the FBG Sensor?
To stay informed about further developments, trends, and reports in the FBG Sensor, consider subscribing to industry newsletters, following relevant companies and organizations, or regularly checking reputable industry news sources and publications.
Methodology
Step 1 - Identification of Relevant Samples Size from Population Database


Step 2 - Approaches for Defining Global Market Size (Value, Volume* & Price*)

Note*: In applicable scenarios
Step 3 - Data Sources
Primary Research
- Web Analytics
- Survey Reports
- Research Institute
- Latest Research Reports
- Opinion Leaders
Secondary Research
- Annual Reports
- White Paper
- Latest Press Release
- Industry Association
- Paid Database
- Investor Presentations

Step 4 - Data Triangulation
Involves using different sources of information in order to increase the validity of a study
These sources are likely to be stakeholders in a program - participants, other researchers, program staff, other community members, and so on.
Then we put all data in single framework & apply various statistical tools to find out the dynamic on the market.
During the analysis stage, feedback from the stakeholder groups would be compared to determine areas of agreement as well as areas of divergence