


Key Insights
The Fiber Optic Ethernet Transceiver market is poised for substantial growth, projected to reach $14.7 billion in 2025 with an impressive Compound Annual Growth Rate (CAGR) of 17.5% through 2033. This robust expansion is primarily fueled by the escalating demand for high-speed data transmission across telecommunications and datacom sectors. The relentless increase in internet traffic, driven by cloud computing, video streaming, the Internet of Things (IoT), and the ongoing rollout of 5G networks, necessitates more efficient and faster networking solutions. Fiber optic Ethernet transceivers are critical components enabling these high-bandwidth connections, facilitating seamless data flow for enterprises, data centers, and service providers. The proliferation of data centers globally, coupled with the need for enhanced network infrastructure to support emerging technologies like AI and machine learning, further amplifies the market's upward trajectory. Advancements in transceiver technology, leading to higher speeds, lower power consumption, and increased port density, are also significant drivers.
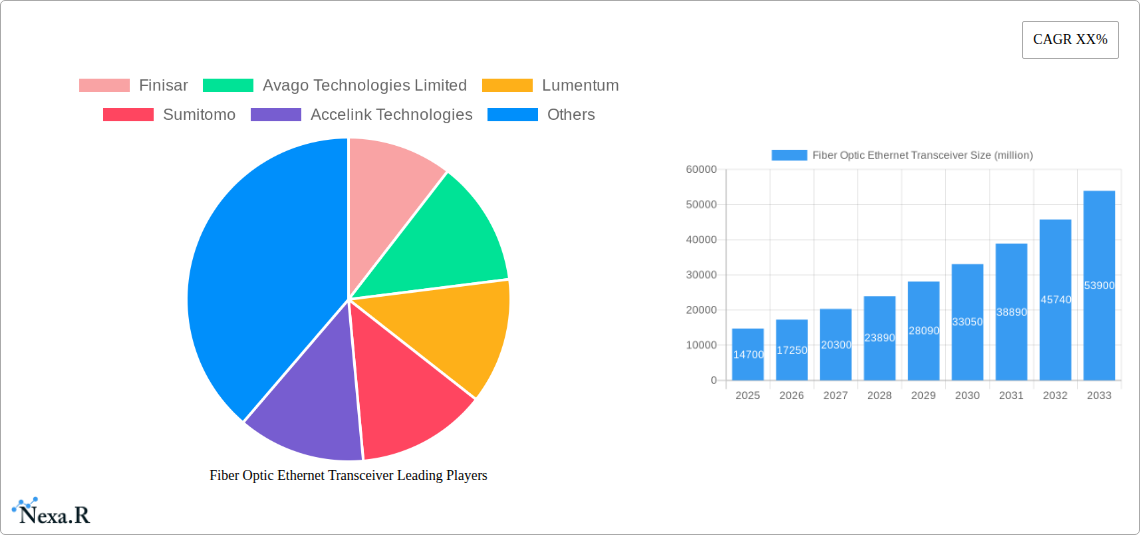
Fiber Optic Ethernet Transceiver Market Size (In Billion)

The market's growth is further propelled by the diverse range of applications and the continuous evolution of transceiver types. Key segments include SFP, SFP+, QSFP/QSFP+, XFP, and CXP, each catering to specific speed and density requirements within various network architectures. The widespread adoption of these transceivers in telecom infrastructure, backbone networks, and enterprise data centers underscores their crucial role. While the market demonstrates immense potential, certain factors could influence its growth trajectory. Increasing competition among key players like Finisar, Avago Technologies Limited, Lumentum, Sumitomo, and Huawei could lead to price pressures. Furthermore, the initial capital expenditure for high-speed optical networking equipment, although decreasing, might pose a consideration for some organizations. However, the fundamental need for superior connectivity in an increasingly data-driven world strongly suggests that these challenges will be overcome, allowing the market to achieve its projected growth milestones.
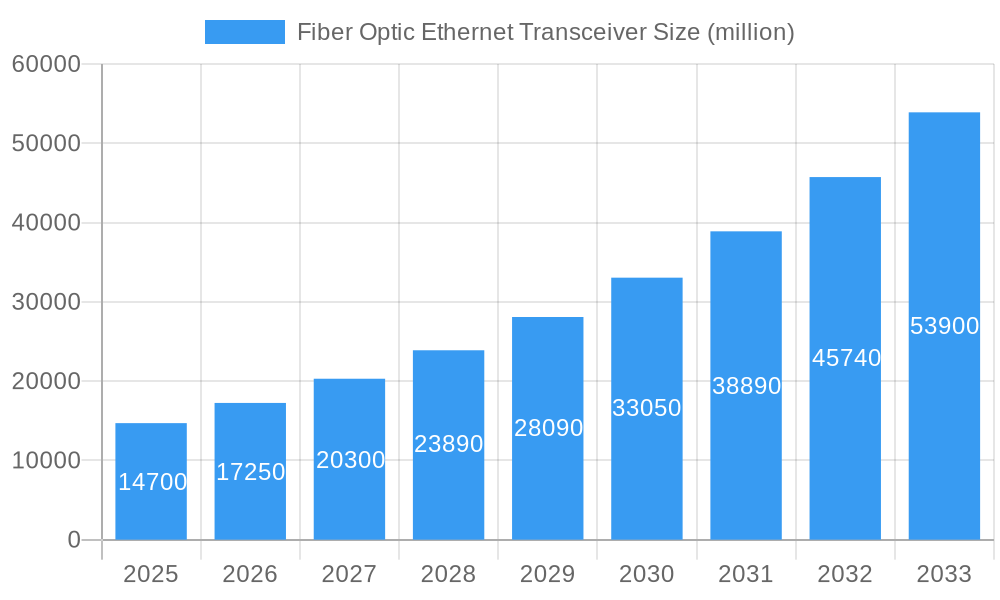
Fiber Optic Ethernet Transceiver Company Market Share
Fiber Optic Ethernet Transceiver Market Dynamics & Structure
The global Fiber Optic Ethernet Transceiver market exhibits a moderately concentrated structure, with key players like Finisar, Avago Technologies Limited, Lumentum, Sumitomo, and Accelink Technologies holding significant market shares. Technological innovation is the primary driver, propelled by the ever-increasing demand for higher bandwidth and lower latency in Telecom and Datacom applications. Emerging standards and the continuous evolution of transceiver technologies, such as SFP+, QSFP/QSFP+, are central to this innovation landscape. Regulatory frameworks, while generally supportive of infrastructure development, can introduce compliance requirements that influence product design and market entry. Competitive product substitutes, though limited within the direct transceiver space, include advancements in direct attach copper (DAC) cables for shorter reach applications, posing a minor challenge. End-user demographics are increasingly skewed towards hyperscale data centers and expanding telecommunication networks, requiring robust and cost-effective solutions. Mergers and acquisitions (M&A) trends are observed as companies aim to consolidate market positions, acquire critical technologies, and expand their product portfolios. For instance, the acquisition of Finisar by Coherent Inc. (formerly Lumentum's fiber optic components business was also a significant part of the broader optics landscape, though separate entities) reshaped the competitive terrain.
- Market Concentration: Moderately concentrated with a few dominant players.
- Technological Innovation Drivers: Demand for higher bandwidth, lower latency, and emerging transceiver standards.
- Regulatory Frameworks: Supportive of infrastructure but with compliance considerations.
- Competitive Product Substitutes: Direct Attach Copper (DAC) cables for short-reach applications.
- End-User Demographics: Hyperscale data centers, telecommunication networks, enterprise networks.
- M&A Trends: Consolidation for market share, technology acquisition, and portfolio expansion.
Fiber Optic Ethernet Transceiver Growth Trends & Insights
The global Fiber Optic Ethernet Transceiver market is poised for robust expansion, driven by the insatiable global demand for data and the relentless evolution of digital infrastructure. The study period of 2019–2033, with a base year of 2025, paints a picture of sustained and accelerating growth. In the historical period of 2019–2024, the market witnessed significant adoption driven by 5G network rollouts and the burgeoning cloud computing sector. The estimated year of 2025 is projected to see a market size of approximately $18.5 billion, with a projected Compound Annual Growth Rate (CAGR) of 15.7% during the forecast period of 2025–2033. This impressive growth is fueled by several key factors. Firstly, the ever-increasing volume of data generated by mobile devices, IoT applications, and enterprise operations necessitates faster and more efficient data transmission, directly benefiting the fiber optic transceiver market. Secondly, the ongoing deployment and upgrading of telecommunication networks, particularly the expansion of 5G and the anticipated rise of 6G, require higher-speed transceivers to support increased data throughput and reduced latency. Datacom applications, including the expansion of data centers and enterprise network upgrades, are also substantial contributors. The development of next-generation data centers, driven by AI and machine learning workloads, demands cutting-edge transceiver technologies like QSFP-DD and OSFP to handle the immense data traffic. Consumer behavior shifts towards high-definition streaming, online gaming, and immersive virtual reality experiences further amplify the need for enhanced network capabilities, translating into higher demand for advanced optical transceivers. Technological disruptions, such as the advancement of coherent optics and silicon photonics, are enabling the creation of more compact, power-efficient, and cost-effective transceivers, further accelerating adoption rates. Market penetration is expected to deepen across both established and emerging economies as fiber optic infrastructure becomes more widespread and affordable. The transition from lower-speed transceivers like SFP and SFP+ to higher-density and higher-speed form factors such as QSFP/QSFP+ and CXP is a defining trend, reflecting the industry's pursuit of ever-increasing performance.
Dominant Regions, Countries, or Segments in Fiber Optic Ethernet Transceiver
The global Fiber Optic Ethernet Transceiver market is experiencing significant growth across various segments and regions, with North America and Asia-Pacific emerging as dominant forces. Within the Application segment, Datacom is currently a leading driver, fueled by the exponential growth of data centers, cloud computing, and enterprise network modernization. The sheer volume of data processed and stored within these facilities necessitates a constant upgrade and expansion of their network infrastructure, making high-speed fiber optic transceivers indispensable. The Telecom segment, while currently holding a substantial share, is poised for even greater acceleration with the ongoing global rollout of 5G networks and the foundational work for future 6G deployments. These next-generation wireless technologies demand significantly higher bandwidth and lower latency, directly translating to increased adoption of advanced fiber optic transceivers.
In terms of Types, QSFP/QSFP+ transceivers represent a significant growth area, accounting for a substantial market share and experiencing rapid adoption due to their higher port density and bandwidth capabilities (100Gbps, 200Gbps, and 400Gbps). These are crucial for high-performance networking in data centers and core telecom infrastructure. While SFP and SFP+ remain foundational for many enterprise and access networks, the trend is clearly towards higher speeds. XFP and CXP are more specialized, catering to specific high-speed interconnects, with CXP being particularly relevant for extremely high-bandwidth, short-reach applications.
Geographically, North America and Asia-Pacific are leading the market. North America's dominance is attributed to its mature digital infrastructure, the presence of major hyperscale cloud providers, and significant investments in R&D and advanced networking technologies. Countries like the United States, with its vast data center ecosystem and ongoing 5G expansion, are key contributors. Asia-Pacific, on the other hand, is demonstrating the fastest growth trajectory. This is driven by massive investments in telecommunications infrastructure in countries like China, India, and South Korea, the rapid adoption of 5G, and the increasing digitalization of economies across the region. Government initiatives promoting digital transformation and the expansion of internet accessibility are further bolstering market growth. The region's large manufacturing base also positions it as a significant producer of fiber optic components.
- Dominant Application Segment: Datacom, driven by data centers, cloud computing, and enterprise networks.
- Emerging Application Segment: Telecom, driven by 5G and future 6G deployments.
- Dominant Transceiver Type: QSFP/QSFP+, with rapid adoption for high-density, high-bandwidth applications.
- Leading Geographic Regions: North America and Asia-Pacific, with Asia-Pacific showing the fastest growth.
- Key Drivers in Asia-Pacific: Government digital initiatives, 5G rollout, manufacturing capabilities.
- Key Drivers in North America: Mature digital infrastructure, hyperscale cloud providers, advanced networking R&D.
Fiber Optic Ethernet Transceiver Product Landscape
The fiber optic Ethernet transceiver product landscape is characterized by rapid innovation and a relentless pursuit of higher speeds and greater efficiency. Manufacturers are continuously developing transceivers with enhanced performance metrics, including increased data rates (from 10Gbps up to 800Gbps and beyond), reduced power consumption, and extended reach capabilities. Key product innovations include miniaturized form factors like SFP-DD and OSFP, enabling higher port density in switches and routers, and advanced modulation techniques to maximize spectral efficiency. Applications span the full spectrum of modern networking needs, from hyperscale data center interconnects and 5G mobile backhaul to enterprise campus networks and telecommunications infrastructure. Unique selling propositions often revolve around cost-effectiveness per gigabit, superior thermal management, and compliance with stringent industry standards such as IEEE and MSA specifications. Technological advancements in areas like silicon photonics are paving the way for integrated, cost-efficient transceiver solutions.
Key Drivers, Barriers & Challenges in Fiber Optic Ethernet Transceiver
Key Drivers:
- Explosive Data Growth: The continuous surge in data traffic from cloud computing, AI, IoT, and streaming services necessitates higher bandwidth and faster transmission speeds, directly driving demand for advanced fiber optic Ethernet transceivers.
- 5G Network Expansion: The global deployment of 5G infrastructure requires a significant increase in the number of high-speed optical links, from base stations to core networks.
- Data Center Modernization: The ongoing expansion and upgrading of data centers, particularly hyperscale facilities, to support increasing computational demands and cloud services, fuels the need for high-density, high-speed transceivers like QSFP/QSFP+.
- Technological Advancements: Innovations in silicon photonics, advanced modulation techniques, and miniaturized form factors are enabling more cost-effective, power-efficient, and higher-performance transceivers.
Barriers & Challenges:
- Supply Chain Disruptions: Geopolitical factors, raw material shortages, and manufacturing complexities can lead to supply chain volatility and impact product availability and pricing.
- Intense Competition & Price Pressure: The market is highly competitive, leading to continuous price erosion, which can squeeze profit margins for manufacturers.
- Talent Shortage: A lack of skilled engineers and technicians in specialized areas like optical design and manufacturing can hinder innovation and production.
- Rapid Technological Obsolescence: The fast-paced nature of technological development means that newer, higher-speed transceivers can quickly render older models obsolete, requiring continuous investment in R&D and manufacturing upgrades.
- Regulatory Hurdles: Compliance with various international standards and certifications can add complexity and cost to product development and market entry.
Emerging Opportunities in Fiber Optic Ethernet Transceiver
Emerging opportunities within the fiber optic Ethernet transceiver market are centered around the growing demand for ultra-high-speed interconnects and specialized applications. The development and deployment of 400GbE, 800GbE, and future terabit Ethernet solutions present a significant growth avenue as data centers and service providers push the boundaries of network capacity. The increasing adoption of AI and machine learning workloads requires specialized, high-performance transceivers capable of handling massive data transfers between GPUs and servers. Furthermore, the expansion of edge computing infrastructure creates opportunities for compact, power-efficient, and robust transceivers suitable for decentralized network deployments. The integration of coherent optics into shorter-reach applications, traditionally the domain of direct detection, also opens up new possibilities for increased bandwidth and improved signal integrity.
Growth Accelerators in the Fiber Optic Ethernet Transceiver Industry
Growth in the fiber optic Ethernet transceiver industry is being significantly accelerated by several pivotal factors. The continuous evolution of network speeds, driven by the demands of 5G, AI, and data-intensive applications, acts as a primary catalyst. Companies are investing heavily in R&D to develop next-generation transceivers that meet these escalating bandwidth requirements. Strategic partnerships and collaborations between transceiver manufacturers and equipment vendors are crucial for co-developing solutions and ensuring interoperability, thereby streamlining market adoption. Furthermore, the ongoing global expansion of fiber optic infrastructure into previously underserved regions, coupled with government initiatives promoting digitalization, opens up new market frontiers and drives demand for a wider range of transceiver products.
Key Players Shaping the Fiber Optic Ethernet Transceiver Market
- Finisar
- Avago Technologies Limited
- Lumentum
- Sumitomo
- Accelink Technologies
- Fujitsu
- Cisco
- Alcatel-Lucent
- NeoPhotonics
- Source Photonics
- Ciena
- Molex
- Huawei
- Infinera
- ACON
- ATOP
- ColorChip
Notable Milestones in Fiber Optic Ethernet Transceiver Sector
- 2019: Significant advancements in 400GbE transceiver technology, with increased availability and adoption for data center interconnects.
- 2020: Increased focus on supply chain resilience and diversification due to global disruptions, leading to strategic investments in manufacturing capabilities.
- 2021: Growth in the adoption of QSFP-DD and OSFP form factors for higher port density and bandwidth in next-generation switches.
- 2022: Advancements in silicon photonics leading to more integrated and cost-effective transceiver solutions.
- 2023: Increased demand for high-speed transceivers driven by the burgeoning AI and machine learning sectors.
- 2024: Early developments and standardization efforts for 800GbE transceivers gain momentum.
In-Depth Fiber Optic Ethernet Transceiver Market Outlook
The fiber optic Ethernet transceiver market is set for a period of sustained and dynamic growth, driven by an unyielding demand for higher bandwidth and faster data transmission. The ongoing global rollout of 5G networks, coupled with the insatiable appetite of hyperscale data centers for increased capacity, forms a strong foundation for market expansion. Innovations in areas like silicon photonics and advanced modulation techniques will continue to drive down costs and improve performance, making high-speed optical connectivity more accessible. Emerging applications in AI, edge computing, and the metaverse are expected to further accelerate this trend. Strategic partnerships and a focus on supply chain robustness will be critical for navigating the evolving landscape. The future outlook is one of continuous technological advancement, increasing market penetration across diverse applications, and a persistent pursuit of higher speeds and greater efficiency in data communication.
Fiber Optic Ethernet Transceiver Segmentation
-
1. Application
- 1.1. Telecom
- 1.2. Datacom
-
2. Types
- 2.1. SFP
- 2.2. SFP+
- 2.3. QSFP/QSFP+
- 2.4. XFP
- 2.5. CXP
Fiber Optic Ethernet Transceiver Segmentation By Geography
-
1. North America
- 1.1. United States
- 1.2. Canada
- 1.3. Mexico
-
2. South America
- 2.1. Brazil
- 2.2. Argentina
- 2.3. Rest of South America
-
3. Europe
- 3.1. United Kingdom
- 3.2. Germany
- 3.3. France
- 3.4. Italy
- 3.5. Spain
- 3.6. Russia
- 3.7. Benelux
- 3.8. Nordics
- 3.9. Rest of Europe
-
4. Middle East & Africa
- 4.1. Turkey
- 4.2. Israel
- 4.3. GCC
- 4.4. North Africa
- 4.5. South Africa
- 4.6. Rest of Middle East & Africa
-
5. Asia Pacific
- 5.1. China
- 5.2. India
- 5.3. Japan
- 5.4. South Korea
- 5.5. ASEAN
- 5.6. Oceania
- 5.7. Rest of Asia Pacific
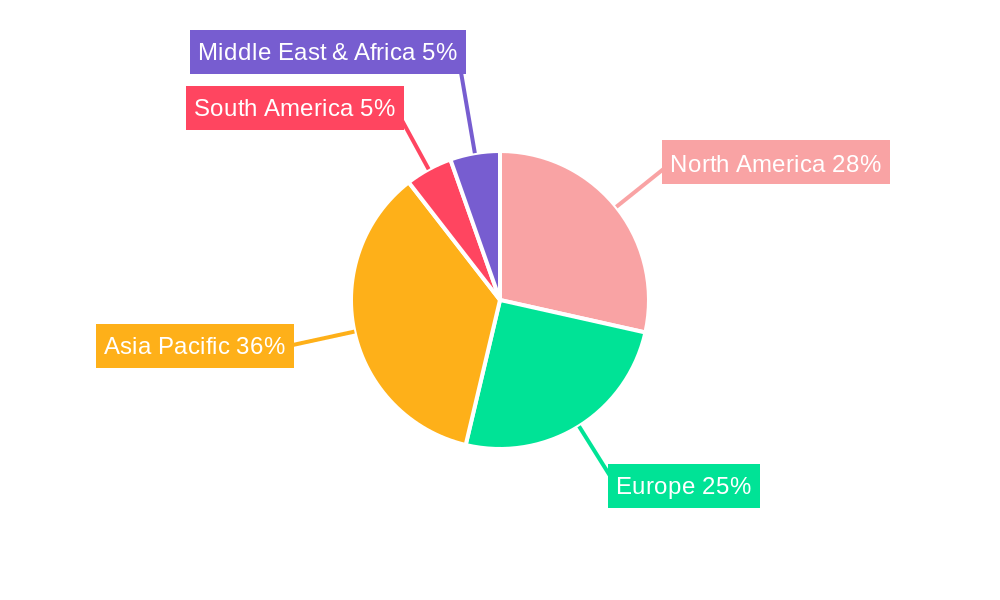
Fiber Optic Ethernet Transceiver Regional Market Share
Geographic Coverage of Fiber Optic Ethernet Transceiver
Fiber Optic Ethernet Transceiver REPORT HIGHLIGHTS
| Aspects | Details |
|---|---|
| Study Period | 2020-2034 |
| Base Year | 2025 |
| Estimated Year | 2026 |
| Forecast Period | 2026-2034 |
| Historical Period | 2020-2025 |
| Growth Rate | CAGR of 17% from 2020-2034 |
| Segmentation |
|
Table of Contents
- 1. Introduction
- 1.1. Research Scope
- 1.2. Market Segmentation
- 1.3. Research Objective
- 1.4. Definitions and Assumptions
- 2. Executive Summary
- 2.1. Market Snapshot
- 3. Market Dynamics
- 3.1. Market Drivers
- 3.2. Market Restrains
- 3.3. Market Trends
- 3.4. Market Opportunities
- 4. Market Factor Analysis
- 4.1. Porters Five Forces
- 4.1.1. Bargaining Power of Suppliers
- 4.1.2. Bargaining Power of Buyers
- 4.1.3. Threat of New Entrants
- 4.1.4. Threat of Substitutes
- 4.1.5. Competitive Rivalry
- 4.2. PESTEL analysis
- 4.3. BCG Analysis
- 4.3.1. Stars (High Growth, High Market Share)
- 4.3.2. Cash Cows (Low Growth, High Market Share)
- 4.3.3. Question Mark (High Growth, Low Market Share)
- 4.3.4. Dogs (Low Growth, Low Market Share)
- 4.4. Ansoff Matrix Analysis
- 4.5. Supply Chain Analysis
- 4.6. Regulatory Landscape
- 4.7. Current Market Potential and Opportunity Assessment (TAM–SAM–SOM Framework)
- 4.8. NRP Analyst Note
- 4.1. Porters Five Forces
- 5. Market Analysis, Insights and Forecast 2021-2033
- 5.1. Market Analysis, Insights and Forecast - by Application
- 5.1.1. Telecom
- 5.1.2. Datacom
- 5.2. Market Analysis, Insights and Forecast - by Types
- 5.2.1. SFP
- 5.2.2. SFP+
- 5.2.3. QSFP/QSFP+
- 5.2.4. XFP
- 5.2.5. CXP
- 5.3. Market Analysis, Insights and Forecast - by Region
- 5.3.1. North America
- 5.3.2. South America
- 5.3.3. Europe
- 5.3.4. Middle East & Africa
- 5.3.5. Asia Pacific
- 5.1. Market Analysis, Insights and Forecast - by Application
- 6. Global Fiber Optic Ethernet Transceiver Analysis, Insights and Forecast, 2021-2033
- 6.1. Market Analysis, Insights and Forecast - by Application
- 6.1.1. Telecom
- 6.1.2. Datacom
- 6.2. Market Analysis, Insights and Forecast - by Types
- 6.2.1. SFP
- 6.2.2. SFP+
- 6.2.3. QSFP/QSFP+
- 6.2.4. XFP
- 6.2.5. CXP
- 6.1. Market Analysis, Insights and Forecast - by Application
- 7. North America Fiber Optic Ethernet Transceiver Analysis, Insights and Forecast, 2020-2032
- 7.1. Market Analysis, Insights and Forecast - by Application
- 7.1.1. Telecom
- 7.1.2. Datacom
- 7.2. Market Analysis, Insights and Forecast - by Types
- 7.2.1. SFP
- 7.2.2. SFP+
- 7.2.3. QSFP/QSFP+
- 7.2.4. XFP
- 7.2.5. CXP
- 7.1. Market Analysis, Insights and Forecast - by Application
- 8. South America Fiber Optic Ethernet Transceiver Analysis, Insights and Forecast, 2020-2032
- 8.1. Market Analysis, Insights and Forecast - by Application
- 8.1.1. Telecom
- 8.1.2. Datacom
- 8.2. Market Analysis, Insights and Forecast - by Types
- 8.2.1. SFP
- 8.2.2. SFP+
- 8.2.3. QSFP/QSFP+
- 8.2.4. XFP
- 8.2.5. CXP
- 8.1. Market Analysis, Insights and Forecast - by Application
- 9. Europe Fiber Optic Ethernet Transceiver Analysis, Insights and Forecast, 2020-2032
- 9.1. Market Analysis, Insights and Forecast - by Application
- 9.1.1. Telecom
- 9.1.2. Datacom
- 9.2. Market Analysis, Insights and Forecast - by Types
- 9.2.1. SFP
- 9.2.2. SFP+
- 9.2.3. QSFP/QSFP+
- 9.2.4. XFP
- 9.2.5. CXP
- 9.1. Market Analysis, Insights and Forecast - by Application
- 10. Middle East & Africa Fiber Optic Ethernet Transceiver Analysis, Insights and Forecast, 2020-2032
- 10.1. Market Analysis, Insights and Forecast - by Application
- 10.1.1. Telecom
- 10.1.2. Datacom
- 10.2. Market Analysis, Insights and Forecast - by Types
- 10.2.1. SFP
- 10.2.2. SFP+
- 10.2.3. QSFP/QSFP+
- 10.2.4. XFP
- 10.2.5. CXP
- 10.1. Market Analysis, Insights and Forecast - by Application
- 11. Asia Pacific Fiber Optic Ethernet Transceiver Analysis, Insights and Forecast, 2020-2032
- 11.1. Market Analysis, Insights and Forecast - by Application
- 11.1.1. Telecom
- 11.1.2. Datacom
- 11.2. Market Analysis, Insights and Forecast - by Types
- 11.2.1. SFP
- 11.2.2. SFP+
- 11.2.3. QSFP/QSFP+
- 11.2.4. XFP
- 11.2.5. CXP
- 11.1. Market Analysis, Insights and Forecast - by Application
- 12. Competitive Analysis
- 12.1. Company Profiles
- 12.1.1 Finisar
- 12.1.1.1. Company Overview
- 12.1.1.2. Products
- 12.1.1.3. Company Financials
- 12.1.1.4. SWOT Analysis
- 12.1.2 Avago Technologies Limited
- 12.1.2.1. Company Overview
- 12.1.2.2. Products
- 12.1.2.3. Company Financials
- 12.1.2.4. SWOT Analysis
- 12.1.3 Lumentum
- 12.1.3.1. Company Overview
- 12.1.3.2. Products
- 12.1.3.3. Company Financials
- 12.1.3.4. SWOT Analysis
- 12.1.4 Sumitomo
- 12.1.4.1. Company Overview
- 12.1.4.2. Products
- 12.1.4.3. Company Financials
- 12.1.4.4. SWOT Analysis
- 12.1.5 Accelink Technologies
- 12.1.5.1. Company Overview
- 12.1.5.2. Products
- 12.1.5.3. Company Financials
- 12.1.5.4. SWOT Analysis
- 12.1.6 Fujitsu
- 12.1.6.1. Company Overview
- 12.1.6.2. Products
- 12.1.6.3. Company Financials
- 12.1.6.4. SWOT Analysis
- 12.1.7 Cisco
- 12.1.7.1. Company Overview
- 12.1.7.2. Products
- 12.1.7.3. Company Financials
- 12.1.7.4. SWOT Analysis
- 12.1.8 Alcatel-Lucent
- 12.1.8.1. Company Overview
- 12.1.8.2. Products
- 12.1.8.3. Company Financials
- 12.1.8.4. SWOT Analysis
- 12.1.9 NeoPhotonics
- 12.1.9.1. Company Overview
- 12.1.9.2. Products
- 12.1.9.3. Company Financials
- 12.1.9.4. SWOT Analysis
- 12.1.10 Source Photonics
- 12.1.10.1. Company Overview
- 12.1.10.2. Products
- 12.1.10.3. Company Financials
- 12.1.10.4. SWOT Analysis
- 12.1.11 Ciena
- 12.1.11.1. Company Overview
- 12.1.11.2. Products
- 12.1.11.3. Company Financials
- 12.1.11.4. SWOT Analysis
- 12.1.12 Molex
- 12.1.12.1. Company Overview
- 12.1.12.2. Products
- 12.1.12.3. Company Financials
- 12.1.12.4. SWOT Analysis
- 12.1.13 Huawei
- 12.1.13.1. Company Overview
- 12.1.13.2. Products
- 12.1.13.3. Company Financials
- 12.1.13.4. SWOT Analysis
- 12.1.14 Infinera
- 12.1.14.1. Company Overview
- 12.1.14.2. Products
- 12.1.14.3. Company Financials
- 12.1.14.4. SWOT Analysis
- 12.1.15 ACON
- 12.1.15.1. Company Overview
- 12.1.15.2. Products
- 12.1.15.3. Company Financials
- 12.1.15.4. SWOT Analysis
- 12.1.16 ATOP
- 12.1.16.1. Company Overview
- 12.1.16.2. Products
- 12.1.16.3. Company Financials
- 12.1.16.4. SWOT Analysis
- 12.1.17 ColorChip
- 12.1.17.1. Company Overview
- 12.1.17.2. Products
- 12.1.17.3. Company Financials
- 12.1.17.4. SWOT Analysis
- 12.1.1 Finisar
- 12.2. Market Entropy
- 12.2.1 Company's Key Areas Served
- 12.2.2 Recent Developments
- 12.3. Company Market Share Analysis 2025
- 12.3.1 Top 5 Companies Market Share Analysis
- 12.3.2 Top 3 Companies Market Share Analysis
- 12.4. List of Potential Customers
- 13. Research Methodology
List of Figures
- Figure 1: Global Fiber Optic Ethernet Transceiver Revenue Breakdown (billion, %) by Region 2025 & 2033
- Figure 2: Global Fiber Optic Ethernet Transceiver Volume Breakdown (K, %) by Region 2025 & 2033
- Figure 3: North America Fiber Optic Ethernet Transceiver Revenue (billion), by Application 2025 & 2033
- Figure 4: North America Fiber Optic Ethernet Transceiver Volume (K), by Application 2025 & 2033
- Figure 5: North America Fiber Optic Ethernet Transceiver Revenue Share (%), by Application 2025 & 2033
- Figure 6: North America Fiber Optic Ethernet Transceiver Volume Share (%), by Application 2025 & 2033
- Figure 7: North America Fiber Optic Ethernet Transceiver Revenue (billion), by Types 2025 & 2033
- Figure 8: North America Fiber Optic Ethernet Transceiver Volume (K), by Types 2025 & 2033
- Figure 9: North America Fiber Optic Ethernet Transceiver Revenue Share (%), by Types 2025 & 2033
- Figure 10: North America Fiber Optic Ethernet Transceiver Volume Share (%), by Types 2025 & 2033
- Figure 11: North America Fiber Optic Ethernet Transceiver Revenue (billion), by Country 2025 & 2033
- Figure 12: North America Fiber Optic Ethernet Transceiver Volume (K), by Country 2025 & 2033
- Figure 13: North America Fiber Optic Ethernet Transceiver Revenue Share (%), by Country 2025 & 2033
- Figure 14: North America Fiber Optic Ethernet Transceiver Volume Share (%), by Country 2025 & 2033
- Figure 15: South America Fiber Optic Ethernet Transceiver Revenue (billion), by Application 2025 & 2033
- Figure 16: South America Fiber Optic Ethernet Transceiver Volume (K), by Application 2025 & 2033
- Figure 17: South America Fiber Optic Ethernet Transceiver Revenue Share (%), by Application 2025 & 2033
- Figure 18: South America Fiber Optic Ethernet Transceiver Volume Share (%), by Application 2025 & 2033
- Figure 19: South America Fiber Optic Ethernet Transceiver Revenue (billion), by Types 2025 & 2033
- Figure 20: South America Fiber Optic Ethernet Transceiver Volume (K), by Types 2025 & 2033
- Figure 21: South America Fiber Optic Ethernet Transceiver Revenue Share (%), by Types 2025 & 2033
- Figure 22: South America Fiber Optic Ethernet Transceiver Volume Share (%), by Types 2025 & 2033
- Figure 23: South America Fiber Optic Ethernet Transceiver Revenue (billion), by Country 2025 & 2033
- Figure 24: South America Fiber Optic Ethernet Transceiver Volume (K), by Country 2025 & 2033
- Figure 25: South America Fiber Optic Ethernet Transceiver Revenue Share (%), by Country 2025 & 2033
- Figure 26: South America Fiber Optic Ethernet Transceiver Volume Share (%), by Country 2025 & 2033
- Figure 27: Europe Fiber Optic Ethernet Transceiver Revenue (billion), by Application 2025 & 2033
- Figure 28: Europe Fiber Optic Ethernet Transceiver Volume (K), by Application 2025 & 2033
- Figure 29: Europe Fiber Optic Ethernet Transceiver Revenue Share (%), by Application 2025 & 2033
- Figure 30: Europe Fiber Optic Ethernet Transceiver Volume Share (%), by Application 2025 & 2033
- Figure 31: Europe Fiber Optic Ethernet Transceiver Revenue (billion), by Types 2025 & 2033
- Figure 32: Europe Fiber Optic Ethernet Transceiver Volume (K), by Types 2025 & 2033
- Figure 33: Europe Fiber Optic Ethernet Transceiver Revenue Share (%), by Types 2025 & 2033
- Figure 34: Europe Fiber Optic Ethernet Transceiver Volume Share (%), by Types 2025 & 2033
- Figure 35: Europe Fiber Optic Ethernet Transceiver Revenue (billion), by Country 2025 & 2033
- Figure 36: Europe Fiber Optic Ethernet Transceiver Volume (K), by Country 2025 & 2033
- Figure 37: Europe Fiber Optic Ethernet Transceiver Revenue Share (%), by Country 2025 & 2033
- Figure 38: Europe Fiber Optic Ethernet Transceiver Volume Share (%), by Country 2025 & 2033
- Figure 39: Middle East & Africa Fiber Optic Ethernet Transceiver Revenue (billion), by Application 2025 & 2033
- Figure 40: Middle East & Africa Fiber Optic Ethernet Transceiver Volume (K), by Application 2025 & 2033
- Figure 41: Middle East & Africa Fiber Optic Ethernet Transceiver Revenue Share (%), by Application 2025 & 2033
- Figure 42: Middle East & Africa Fiber Optic Ethernet Transceiver Volume Share (%), by Application 2025 & 2033
- Figure 43: Middle East & Africa Fiber Optic Ethernet Transceiver Revenue (billion), by Types 2025 & 2033
- Figure 44: Middle East & Africa Fiber Optic Ethernet Transceiver Volume (K), by Types 2025 & 2033
- Figure 45: Middle East & Africa Fiber Optic Ethernet Transceiver Revenue Share (%), by Types 2025 & 2033
- Figure 46: Middle East & Africa Fiber Optic Ethernet Transceiver Volume Share (%), by Types 2025 & 2033
- Figure 47: Middle East & Africa Fiber Optic Ethernet Transceiver Revenue (billion), by Country 2025 & 2033
- Figure 48: Middle East & Africa Fiber Optic Ethernet Transceiver Volume (K), by Country 2025 & 2033
- Figure 49: Middle East & Africa Fiber Optic Ethernet Transceiver Revenue Share (%), by Country 2025 & 2033
- Figure 50: Middle East & Africa Fiber Optic Ethernet Transceiver Volume Share (%), by Country 2025 & 2033
- Figure 51: Asia Pacific Fiber Optic Ethernet Transceiver Revenue (billion), by Application 2025 & 2033
- Figure 52: Asia Pacific Fiber Optic Ethernet Transceiver Volume (K), by Application 2025 & 2033
- Figure 53: Asia Pacific Fiber Optic Ethernet Transceiver Revenue Share (%), by Application 2025 & 2033
- Figure 54: Asia Pacific Fiber Optic Ethernet Transceiver Volume Share (%), by Application 2025 & 2033
- Figure 55: Asia Pacific Fiber Optic Ethernet Transceiver Revenue (billion), by Types 2025 & 2033
- Figure 56: Asia Pacific Fiber Optic Ethernet Transceiver Volume (K), by Types 2025 & 2033
- Figure 57: Asia Pacific Fiber Optic Ethernet Transceiver Revenue Share (%), by Types 2025 & 2033
- Figure 58: Asia Pacific Fiber Optic Ethernet Transceiver Volume Share (%), by Types 2025 & 2033
- Figure 59: Asia Pacific Fiber Optic Ethernet Transceiver Revenue (billion), by Country 2025 & 2033
- Figure 60: Asia Pacific Fiber Optic Ethernet Transceiver Volume (K), by Country 2025 & 2033
- Figure 61: Asia Pacific Fiber Optic Ethernet Transceiver Revenue Share (%), by Country 2025 & 2033
- Figure 62: Asia Pacific Fiber Optic Ethernet Transceiver Volume Share (%), by Country 2025 & 2033
List of Tables
- Table 1: Global Fiber Optic Ethernet Transceiver Revenue billion Forecast, by Application 2020 & 2033
- Table 2: Global Fiber Optic Ethernet Transceiver Volume K Forecast, by Application 2020 & 2033
- Table 3: Global Fiber Optic Ethernet Transceiver Revenue billion Forecast, by Types 2020 & 2033
- Table 4: Global Fiber Optic Ethernet Transceiver Volume K Forecast, by Types 2020 & 2033
- Table 5: Global Fiber Optic Ethernet Transceiver Revenue billion Forecast, by Region 2020 & 2033
- Table 6: Global Fiber Optic Ethernet Transceiver Volume K Forecast, by Region 2020 & 2033
- Table 7: Global Fiber Optic Ethernet Transceiver Revenue billion Forecast, by Application 2020 & 2033
- Table 8: Global Fiber Optic Ethernet Transceiver Volume K Forecast, by Application 2020 & 2033
- Table 9: Global Fiber Optic Ethernet Transceiver Revenue billion Forecast, by Types 2020 & 2033
- Table 10: Global Fiber Optic Ethernet Transceiver Volume K Forecast, by Types 2020 & 2033
- Table 11: Global Fiber Optic Ethernet Transceiver Revenue billion Forecast, by Country 2020 & 2033
- Table 12: Global Fiber Optic Ethernet Transceiver Volume K Forecast, by Country 2020 & 2033
- Table 13: United States Fiber Optic Ethernet Transceiver Revenue (billion) Forecast, by Application 2020 & 2033
- Table 14: United States Fiber Optic Ethernet Transceiver Volume (K) Forecast, by Application 2020 & 2033
- Table 15: Canada Fiber Optic Ethernet Transceiver Revenue (billion) Forecast, by Application 2020 & 2033
- Table 16: Canada Fiber Optic Ethernet Transceiver Volume (K) Forecast, by Application 2020 & 2033
- Table 17: Mexico Fiber Optic Ethernet Transceiver Revenue (billion) Forecast, by Application 2020 & 2033
- Table 18: Mexico Fiber Optic Ethernet Transceiver Volume (K) Forecast, by Application 2020 & 2033
- Table 19: Global Fiber Optic Ethernet Transceiver Revenue billion Forecast, by Application 2020 & 2033
- Table 20: Global Fiber Optic Ethernet Transceiver Volume K Forecast, by Application 2020 & 2033
- Table 21: Global Fiber Optic Ethernet Transceiver Revenue billion Forecast, by Types 2020 & 2033
- Table 22: Global Fiber Optic Ethernet Transceiver Volume K Forecast, by Types 2020 & 2033
- Table 23: Global Fiber Optic Ethernet Transceiver Revenue billion Forecast, by Country 2020 & 2033
- Table 24: Global Fiber Optic Ethernet Transceiver Volume K Forecast, by Country 2020 & 2033
- Table 25: Brazil Fiber Optic Ethernet Transceiver Revenue (billion) Forecast, by Application 2020 & 2033
- Table 26: Brazil Fiber Optic Ethernet Transceiver Volume (K) Forecast, by Application 2020 & 2033
- Table 27: Argentina Fiber Optic Ethernet Transceiver Revenue (billion) Forecast, by Application 2020 & 2033
- Table 28: Argentina Fiber Optic Ethernet Transceiver Volume (K) Forecast, by Application 2020 & 2033
- Table 29: Rest of South America Fiber Optic Ethernet Transceiver Revenue (billion) Forecast, by Application 2020 & 2033
- Table 30: Rest of South America Fiber Optic Ethernet Transceiver Volume (K) Forecast, by Application 2020 & 2033
- Table 31: Global Fiber Optic Ethernet Transceiver Revenue billion Forecast, by Application 2020 & 2033
- Table 32: Global Fiber Optic Ethernet Transceiver Volume K Forecast, by Application 2020 & 2033
- Table 33: Global Fiber Optic Ethernet Transceiver Revenue billion Forecast, by Types 2020 & 2033
- Table 34: Global Fiber Optic Ethernet Transceiver Volume K Forecast, by Types 2020 & 2033
- Table 35: Global Fiber Optic Ethernet Transceiver Revenue billion Forecast, by Country 2020 & 2033
- Table 36: Global Fiber Optic Ethernet Transceiver Volume K Forecast, by Country 2020 & 2033
- Table 37: United Kingdom Fiber Optic Ethernet Transceiver Revenue (billion) Forecast, by Application 2020 & 2033
- Table 38: United Kingdom Fiber Optic Ethernet Transceiver Volume (K) Forecast, by Application 2020 & 2033
- Table 39: Germany Fiber Optic Ethernet Transceiver Revenue (billion) Forecast, by Application 2020 & 2033
- Table 40: Germany Fiber Optic Ethernet Transceiver Volume (K) Forecast, by Application 2020 & 2033
- Table 41: France Fiber Optic Ethernet Transceiver Revenue (billion) Forecast, by Application 2020 & 2033
- Table 42: France Fiber Optic Ethernet Transceiver Volume (K) Forecast, by Application 2020 & 2033
- Table 43: Italy Fiber Optic Ethernet Transceiver Revenue (billion) Forecast, by Application 2020 & 2033
- Table 44: Italy Fiber Optic Ethernet Transceiver Volume (K) Forecast, by Application 2020 & 2033
- Table 45: Spain Fiber Optic Ethernet Transceiver Revenue (billion) Forecast, by Application 2020 & 2033
- Table 46: Spain Fiber Optic Ethernet Transceiver Volume (K) Forecast, by Application 2020 & 2033
- Table 47: Russia Fiber Optic Ethernet Transceiver Revenue (billion) Forecast, by Application 2020 & 2033
- Table 48: Russia Fiber Optic Ethernet Transceiver Volume (K) Forecast, by Application 2020 & 2033
- Table 49: Benelux Fiber Optic Ethernet Transceiver Revenue (billion) Forecast, by Application 2020 & 2033
- Table 50: Benelux Fiber Optic Ethernet Transceiver Volume (K) Forecast, by Application 2020 & 2033
- Table 51: Nordics Fiber Optic Ethernet Transceiver Revenue (billion) Forecast, by Application 2020 & 2033
- Table 52: Nordics Fiber Optic Ethernet Transceiver Volume (K) Forecast, by Application 2020 & 2033
- Table 53: Rest of Europe Fiber Optic Ethernet Transceiver Revenue (billion) Forecast, by Application 2020 & 2033
- Table 54: Rest of Europe Fiber Optic Ethernet Transceiver Volume (K) Forecast, by Application 2020 & 2033
- Table 55: Global Fiber Optic Ethernet Transceiver Revenue billion Forecast, by Application 2020 & 2033
- Table 56: Global Fiber Optic Ethernet Transceiver Volume K Forecast, by Application 2020 & 2033
- Table 57: Global Fiber Optic Ethernet Transceiver Revenue billion Forecast, by Types 2020 & 2033
- Table 58: Global Fiber Optic Ethernet Transceiver Volume K Forecast, by Types 2020 & 2033
- Table 59: Global Fiber Optic Ethernet Transceiver Revenue billion Forecast, by Country 2020 & 2033
- Table 60: Global Fiber Optic Ethernet Transceiver Volume K Forecast, by Country 2020 & 2033
- Table 61: Turkey Fiber Optic Ethernet Transceiver Revenue (billion) Forecast, by Application 2020 & 2033
- Table 62: Turkey Fiber Optic Ethernet Transceiver Volume (K) Forecast, by Application 2020 & 2033
- Table 63: Israel Fiber Optic Ethernet Transceiver Revenue (billion) Forecast, by Application 2020 & 2033
- Table 64: Israel Fiber Optic Ethernet Transceiver Volume (K) Forecast, by Application 2020 & 2033
- Table 65: GCC Fiber Optic Ethernet Transceiver Revenue (billion) Forecast, by Application 2020 & 2033
- Table 66: GCC Fiber Optic Ethernet Transceiver Volume (K) Forecast, by Application 2020 & 2033
- Table 67: North Africa Fiber Optic Ethernet Transceiver Revenue (billion) Forecast, by Application 2020 & 2033
- Table 68: North Africa Fiber Optic Ethernet Transceiver Volume (K) Forecast, by Application 2020 & 2033
- Table 69: South Africa Fiber Optic Ethernet Transceiver Revenue (billion) Forecast, by Application 2020 & 2033
- Table 70: South Africa Fiber Optic Ethernet Transceiver Volume (K) Forecast, by Application 2020 & 2033
- Table 71: Rest of Middle East & Africa Fiber Optic Ethernet Transceiver Revenue (billion) Forecast, by Application 2020 & 2033
- Table 72: Rest of Middle East & Africa Fiber Optic Ethernet Transceiver Volume (K) Forecast, by Application 2020 & 2033
- Table 73: Global Fiber Optic Ethernet Transceiver Revenue billion Forecast, by Application 2020 & 2033
- Table 74: Global Fiber Optic Ethernet Transceiver Volume K Forecast, by Application 2020 & 2033
- Table 75: Global Fiber Optic Ethernet Transceiver Revenue billion Forecast, by Types 2020 & 2033
- Table 76: Global Fiber Optic Ethernet Transceiver Volume K Forecast, by Types 2020 & 2033
- Table 77: Global Fiber Optic Ethernet Transceiver Revenue billion Forecast, by Country 2020 & 2033
- Table 78: Global Fiber Optic Ethernet Transceiver Volume K Forecast, by Country 2020 & 2033
- Table 79: China Fiber Optic Ethernet Transceiver Revenue (billion) Forecast, by Application 2020 & 2033
- Table 80: China Fiber Optic Ethernet Transceiver Volume (K) Forecast, by Application 2020 & 2033
- Table 81: India Fiber Optic Ethernet Transceiver Revenue (billion) Forecast, by Application 2020 & 2033
- Table 82: India Fiber Optic Ethernet Transceiver Volume (K) Forecast, by Application 2020 & 2033
- Table 83: Japan Fiber Optic Ethernet Transceiver Revenue (billion) Forecast, by Application 2020 & 2033
- Table 84: Japan Fiber Optic Ethernet Transceiver Volume (K) Forecast, by Application 2020 & 2033
- Table 85: South Korea Fiber Optic Ethernet Transceiver Revenue (billion) Forecast, by Application 2020 & 2033
- Table 86: South Korea Fiber Optic Ethernet Transceiver Volume (K) Forecast, by Application 2020 & 2033
- Table 87: ASEAN Fiber Optic Ethernet Transceiver Revenue (billion) Forecast, by Application 2020 & 2033
- Table 88: ASEAN Fiber Optic Ethernet Transceiver Volume (K) Forecast, by Application 2020 & 2033
- Table 89: Oceania Fiber Optic Ethernet Transceiver Revenue (billion) Forecast, by Application 2020 & 2033
- Table 90: Oceania Fiber Optic Ethernet Transceiver Volume (K) Forecast, by Application 2020 & 2033
- Table 91: Rest of Asia Pacific Fiber Optic Ethernet Transceiver Revenue (billion) Forecast, by Application 2020 & 2033
- Table 92: Rest of Asia Pacific Fiber Optic Ethernet Transceiver Volume (K) Forecast, by Application 2020 & 2033
Frequently Asked Questions
1. What is the projected Compound Annual Growth Rate (CAGR) of the Fiber Optic Ethernet Transceiver?
The projected CAGR is approximately 17%.
2. Which companies are prominent players in the Fiber Optic Ethernet Transceiver?
Key companies in the market include Finisar, Avago Technologies Limited, Lumentum, Sumitomo, Accelink Technologies, Fujitsu, Cisco, Alcatel-Lucent, NeoPhotonics, Source Photonics, Ciena, Molex, Huawei, Infinera, ACON, ATOP, ColorChip.
3. What are the main segments of the Fiber Optic Ethernet Transceiver?
The market segments include Application, Types.
4. Can you provide details about the market size?
The market size is estimated to be USD 15.6 billion as of 2022.
5. What are some drivers contributing to market growth?
N/A
6. What are the notable trends driving market growth?
N/A
7. Are there any restraints impacting market growth?
N/A
8. Can you provide examples of recent developments in the market?
N/A
9. What pricing options are available for accessing the report?
Pricing options include single-user, multi-user, and enterprise licenses priced at USD 3950.00, USD 5925.00, and USD 7900.00 respectively.
10. Is the market size provided in terms of value or volume?
The market size is provided in terms of value, measured in billion and volume, measured in K.
11. Are there any specific market keywords associated with the report?
Yes, the market keyword associated with the report is "Fiber Optic Ethernet Transceiver," which aids in identifying and referencing the specific market segment covered.
12. How do I determine which pricing option suits my needs best?
The pricing options vary based on user requirements and access needs. Individual users may opt for single-user licenses, while businesses requiring broader access may choose multi-user or enterprise licenses for cost-effective access to the report.
13. Are there any additional resources or data provided in the Fiber Optic Ethernet Transceiver report?
While the report offers comprehensive insights, it's advisable to review the specific contents or supplementary materials provided to ascertain if additional resources or data are available.
14. How can I stay updated on further developments or reports in the Fiber Optic Ethernet Transceiver?
To stay informed about further developments, trends, and reports in the Fiber Optic Ethernet Transceiver, consider subscribing to industry newsletters, following relevant companies and organizations, or regularly checking reputable industry news sources and publications.
Methodology
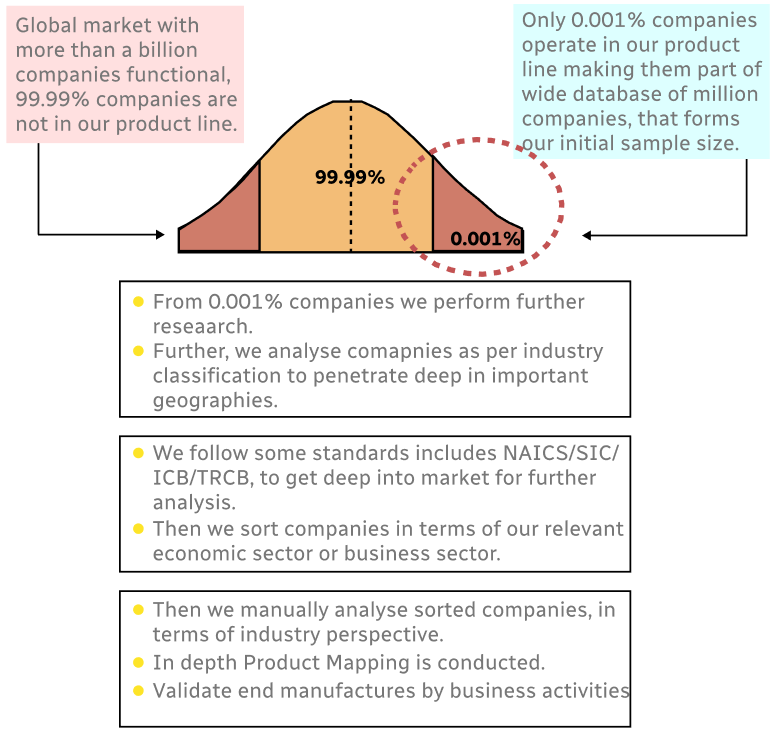
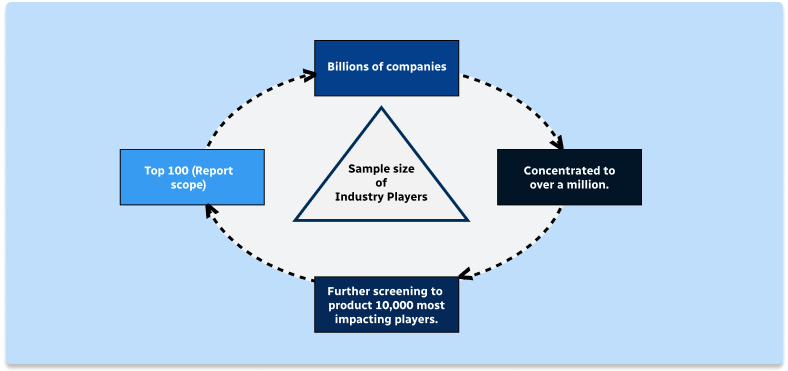
Step 1 - Identification of Relevant Samples Size from Population Database
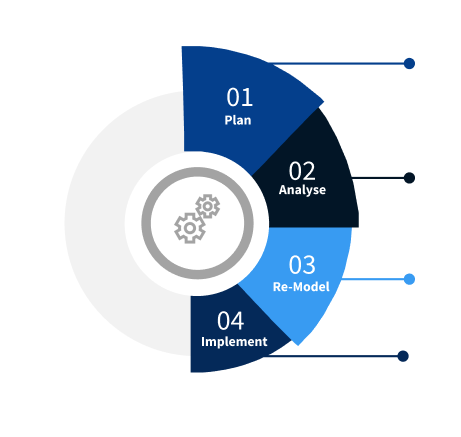
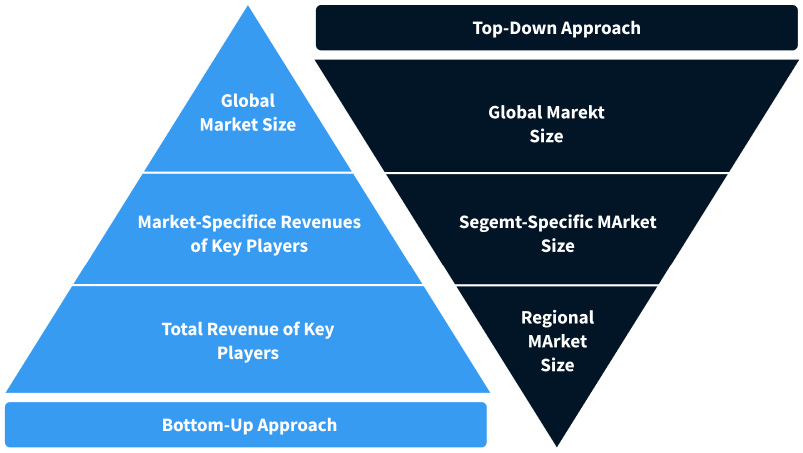
Step 2 - Approaches for Defining Global Market Size (Value, Volume* & Price*)
Note*: In applicable scenarios
Step 3 - Data Sources
Primary Research
- Web Analytics
- Survey Reports
- Research Institute
- Latest Research Reports
- Opinion Leaders
Secondary Research
- Annual Reports
- White Paper
- Latest Press Release
- Industry Association
- Paid Database
- Investor Presentations
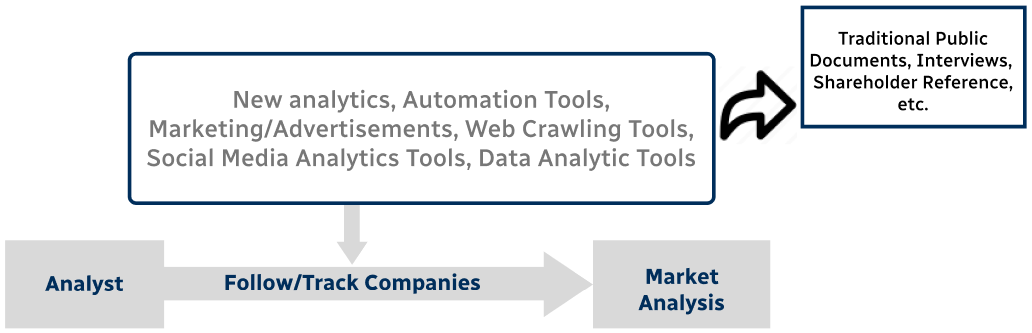
Step 4 - Data Triangulation
Involves using different sources of information in order to increase the validity of a study
These sources are likely to be stakeholders in a program - participants, other researchers, program staff, other community members, and so on.
Then we put all data in single framework & apply various statistical tools to find out the dynamic on the market.
During the analysis stage, feedback from the stakeholder groups would be compared to determine areas of agreement as well as areas of divergence