

Key Insights
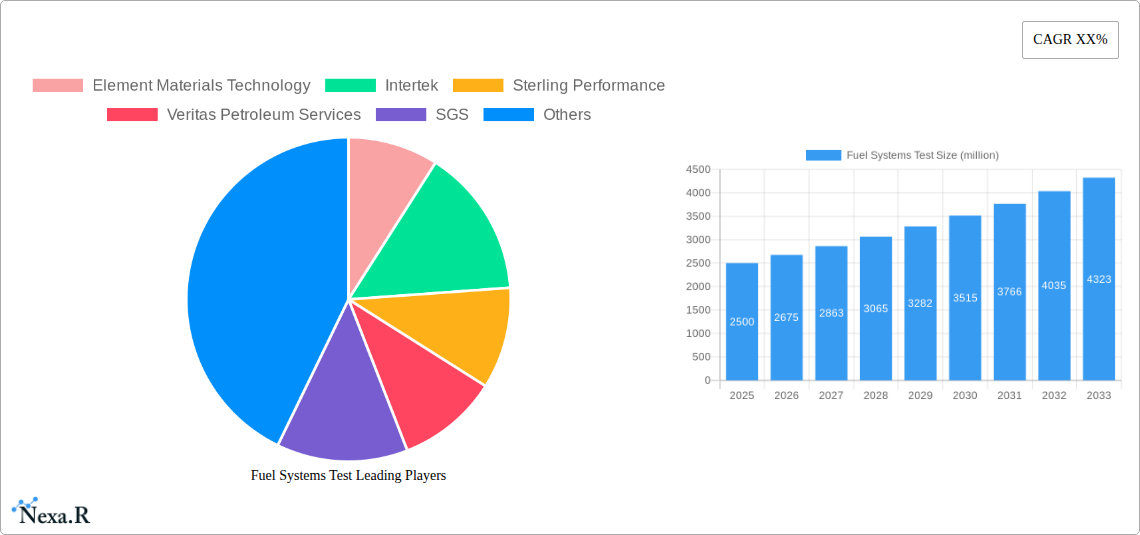
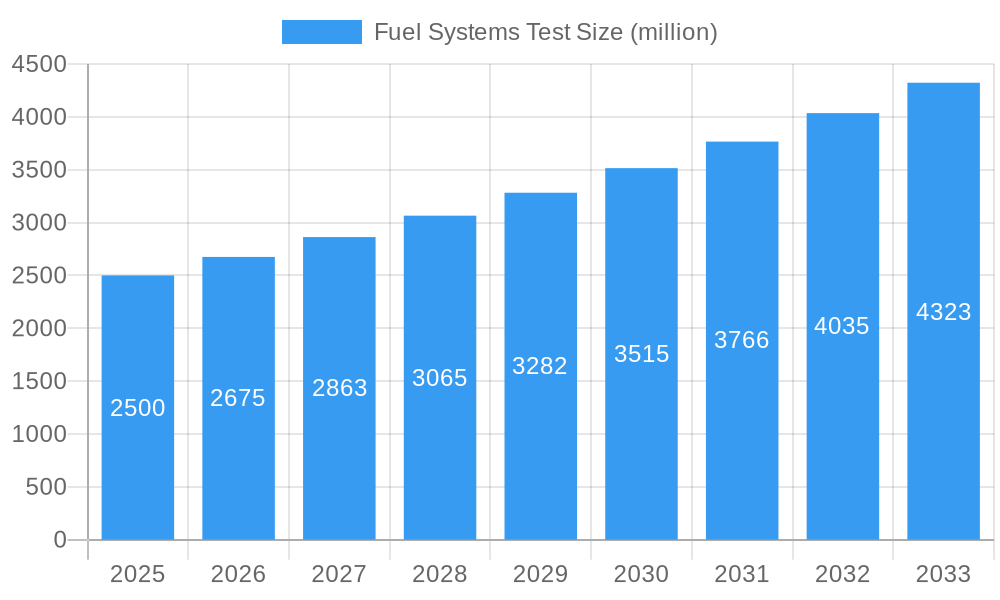
The fuel systems testing market is experiencing robust growth, driven by stringent emission regulations globally and the increasing demand for fuel-efficient vehicles. The market, estimated at $2.5 billion in 2025, is projected to achieve a Compound Annual Growth Rate (CAGR) of 7% from 2025 to 2033, reaching approximately $4.2 billion by 2033. This expansion is fueled by several key factors. Firstly, the automotive industry's relentless pursuit of improved fuel economy and reduced emissions necessitates rigorous testing and validation of fuel systems. Secondly, the increasing adoption of alternative fuels, such as biofuels and hydrogen, is creating a demand for specialized testing procedures and equipment. Furthermore, advancements in testing technologies, including sophisticated simulation software and automated testing systems, are enhancing efficiency and accuracy, driving market growth. Key players like Element Materials Technology, Intertek, and SGS are strategically investing in research and development, expanding their service offerings, and acquiring smaller companies to solidify their market positions.
Fuel Systems Test Market Size (In Billion)
The market's growth trajectory isn't without challenges. Constraints include the high cost of advanced testing equipment and the complexity of testing procedures, which can pose barriers for smaller companies. Furthermore, fluctuations in fuel prices and economic downturns can affect the demand for testing services. However, the long-term outlook remains positive, driven by continuous technological innovation and the ever-increasing need for reliable and efficient fuel systems. Segmentation within the market is likely driven by fuel type (gasoline, diesel, alternative fuels), vehicle type (passenger cars, commercial vehicles), and testing method (emission testing, performance testing, durability testing). Regional growth will vary, with North America and Europe expected to maintain strong market shares due to established automotive industries and stricter environmental regulations.
Fuel Systems Test Company Market Share
Fuel Systems Test Market Report: 2019-2033
This comprehensive report provides a detailed analysis of the Fuel Systems Test market, encompassing market dynamics, growth trends, regional performance, product landscape, key players, and future outlook. The study period covers 2019-2033, with 2025 as the base and estimated year. This report is invaluable for industry professionals, investors, and strategic decision-makers seeking to understand and capitalize on opportunities within this dynamic sector. The parent market is Automotive Testing and the child market is Fuel System Testing.
Fuel Systems Test Market Dynamics & Structure
The Fuel Systems Test market is characterized by moderate concentration, with key players like Element Materials Technology, Intertek, and SGS holding significant market share. Technological innovation, driven by stricter emission regulations and the demand for improved fuel efficiency, is a key driver. Regulatory frameworks, such as those related to vehicle emissions and safety, significantly influence market growth. Competitive substitutes, including alternative fuel technologies, pose a challenge. End-user demographics, primarily automotive manufacturers and fuel suppliers, shape market demand. M&A activity has been moderate, with approximately xx deals recorded between 2019 and 2024, representing a total value of xx million.
- Market Concentration: Moderately concentrated, with top 5 players holding approximately 60% market share in 2025.
- Technological Innovation: Stringent emission standards and demand for alternative fuels drive innovation in testing methodologies.
- Regulatory Frameworks: Compliance with environmental regulations and safety standards is crucial and impacts market growth.
- Competitive Substitutes: Advancements in alternative fuels and propulsion systems present competitive challenges.
- End-User Demographics: Automotive manufacturers and fuel suppliers are primary end-users.
- M&A Trends: Moderate M&A activity with xx deals valued at xx million USD recorded between 2019-2024.
Fuel Systems Test Growth Trends & Insights
The Fuel Systems Test market experienced steady growth during the historical period (2019-2024), with a CAGR of xx%. The market size reached xx million in 2024. This growth is attributed to increasing vehicle production, stringent emission regulations, and rising demand for advanced fuel systems. Technological disruptions, such as the adoption of electric and hybrid vehicles, are expected to reshape the market in the forecast period (2025-2033). However, this disruption is expected to initially impact fuel testing for conventional vehicles, before growing in electric and hybrid vehicle testing. Market penetration of advanced testing technologies is projected to reach xx% by 2033. Consumer behavior shifts towards environmentally friendly vehicles are also influencing market growth. The forecast period is expected to yield a CAGR of xx%, reaching a market size of xx million by 2033.
Dominant Regions, Countries, or Segments in Fuel Systems Test
North America currently dominates the Fuel Systems Test market, holding approximately 35% of the global market share in 2025, driven by a large automotive manufacturing base and stringent emission regulations. Europe holds the second position with a xx% market share, followed by Asia-Pacific with xx%. The strong presence of automotive giants and supportive government policies contribute to North America's dominance.
- North America: Large automotive manufacturing base, stringent emission standards, and robust infrastructure support market growth.
- Europe: Significant automotive industry, supportive regulatory environment, and focus on fuel efficiency.
- Asia-Pacific: Rapidly expanding automotive sector and increasing demand for fuel-efficient vehicles.
Fuel Systems Test Product Landscape
The Fuel Systems Test market offers a range of products and services, including emission testing, fuel quality analysis, and component durability testing. Recent innovations include automated testing systems, advanced analytical techniques, and portable testing units that enhance efficiency and accuracy. These products offer unique selling propositions such as reduced testing times, improved data analysis, and enhanced mobility. Technological advancements focus on improving precision, reducing testing time, and lowering overall costs.
Key Drivers, Barriers & Challenges in Fuel Systems Test
Key Drivers:
- Stringent emission regulations worldwide are driving the demand for accurate and reliable fuel system testing.
- The growing adoption of advanced fuel technologies and alternative fuels fuels market expansion.
- Increased focus on vehicle fuel efficiency and performance necessitates comprehensive testing.
Challenges and Restraints:
- High initial investment costs associated with advanced testing equipment.
- The complexity of testing procedures and the need for skilled personnel.
- Potential supply chain disruptions impacting the availability of testing equipment and materials.
Emerging Opportunities in Fuel Systems Test
- The rise of electric and hybrid vehicles presents significant opportunities for testing related to battery systems, charging infrastructure, and hybrid powertrains.
- The growing demand for biofuels and other alternative fuels creates opportunities for specialized testing services.
- Expansion into emerging markets with developing automotive industries offers significant growth potential.
Growth Accelerators in the Fuel Systems Test Industry
Technological breakthroughs in testing methodologies, such as the development of faster and more accurate analytical techniques, are significantly accelerating market growth. Strategic partnerships between testing companies and automotive manufacturers facilitate the development and adoption of new testing technologies. The expansion of testing services into emerging markets is also driving market growth.
Key Players Shaping the Fuel Systems Test Market
- Element Materials Technology
- Intertek
- Sterling Performance
- Veritas Petroleum Services
- SGS
- Fastlane Autocare
- Comco Canada
- ECL Group
- Alaska Fuel Systems
- The Goodyear Tire & Rubber Company
Notable Milestones in Fuel Systems Test Sector
- 2021 (Q3): Intertek launched a new automated fuel testing system, significantly reducing testing time.
- 2022 (Q1): Element Materials Technology acquired a smaller testing facility, expanding its geographic reach.
- 2023 (Q2): SGS introduced a new emission testing standard compliant with the latest regulations.
In-Depth Fuel Systems Test Market Outlook
The Fuel Systems Test market is poised for continued growth in the forecast period, driven by technological advancements, supportive government policies, and the expanding global automotive industry. Strategic opportunities lie in developing innovative testing solutions for electric vehicles, alternative fuels, and connected vehicle technologies. This expanding market creates ample room for both established players and new entrants to innovate and capitalize on the growing demand for advanced fuel system testing solutions.
Fuel Systems Test Segmentation
-
1. Application
- 1.1. Aviation
- 1.2. Automobile
-
2. Types
- 2.1. Pre-factory Test
- 2.2. Inspection After Use
Fuel Systems Test Segmentation By Geography
-
1. North America
- 1.1. United States
- 1.2. Canada
- 1.3. Mexico
-
2. South America
- 2.1. Brazil
- 2.2. Argentina
- 2.3. Rest of South America
-
3. Europe
- 3.1. United Kingdom
- 3.2. Germany
- 3.3. France
- 3.4. Italy
- 3.5. Spain
- 3.6. Russia
- 3.7. Benelux
- 3.8. Nordics
- 3.9. Rest of Europe
-
4. Middle East & Africa
- 4.1. Turkey
- 4.2. Israel
- 4.3. GCC
- 4.4. North Africa
- 4.5. South Africa
- 4.6. Rest of Middle East & Africa
-
5. Asia Pacific
- 5.1. China
- 5.2. India
- 5.3. Japan
- 5.4. South Korea
- 5.5. ASEAN
- 5.6. Oceania
- 5.7. Rest of Asia Pacific

Fuel Systems Test Regional Market Share
Geographic Coverage of Fuel Systems Test
Fuel Systems Test REPORT HIGHLIGHTS
| Aspects | Details |
|---|---|
| Study Period | 2020-2034 |
| Base Year | 2025 |
| Estimated Year | 2026 |
| Forecast Period | 2026-2034 |
| Historical Period | 2020-2025 |
| Growth Rate | CAGR of 6.5% from 2020-2034 |
| Segmentation |
|
Table of Contents
- 1. Introduction
- 1.1. Research Scope
- 1.2. Market Segmentation
- 1.3. Research Objective
- 1.4. Definitions and Assumptions
- 2. Executive Summary
- 2.1. Market Snapshot
- 3. Market Dynamics
- 3.1. Market Drivers
- 3.2. Market Restrains
- 3.3. Market Trends
- 3.4. Market Opportunities
- 4. Market Factor Analysis
- 4.1. Porters Five Forces
- 4.1.1. Bargaining Power of Suppliers
- 4.1.2. Bargaining Power of Buyers
- 4.1.3. Threat of New Entrants
- 4.1.4. Threat of Substitutes
- 4.1.5. Competitive Rivalry
- 4.2. PESTEL analysis
- 4.3. BCG Analysis
- 4.3.1. Stars (High Growth, High Market Share)
- 4.3.2. Cash Cows (Low Growth, High Market Share)
- 4.3.3. Question Mark (High Growth, Low Market Share)
- 4.3.4. Dogs (Low Growth, Low Market Share)
- 4.4. Ansoff Matrix Analysis
- 4.5. Supply Chain Analysis
- 4.6. Regulatory Landscape
- 4.7. Current Market Potential and Opportunity Assessment (TAM–SAM–SOM Framework)
- 4.8. NRP Analyst Note
- 4.1. Porters Five Forces
- 5. Market Analysis, Insights and Forecast 2021-2033
- 5.1. Market Analysis, Insights and Forecast - by Application
- 5.1.1. Aviation
- 5.1.2. Automobile
- 5.2. Market Analysis, Insights and Forecast - by Types
- 5.2.1. Pre-factory Test
- 5.2.2. Inspection After Use
- 5.3. Market Analysis, Insights and Forecast - by Region
- 5.3.1. North America
- 5.3.2. South America
- 5.3.3. Europe
- 5.3.4. Middle East & Africa
- 5.3.5. Asia Pacific
- 5.1. Market Analysis, Insights and Forecast - by Application
- 6. Global Fuel Systems Test Analysis, Insights and Forecast, 2021-2033
- 6.1. Market Analysis, Insights and Forecast - by Application
- 6.1.1. Aviation
- 6.1.2. Automobile
- 6.2. Market Analysis, Insights and Forecast - by Types
- 6.2.1. Pre-factory Test
- 6.2.2. Inspection After Use
- 6.1. Market Analysis, Insights and Forecast - by Application
- 7. North America Fuel Systems Test Analysis, Insights and Forecast, 2020-2032
- 7.1. Market Analysis, Insights and Forecast - by Application
- 7.1.1. Aviation
- 7.1.2. Automobile
- 7.2. Market Analysis, Insights and Forecast - by Types
- 7.2.1. Pre-factory Test
- 7.2.2. Inspection After Use
- 7.1. Market Analysis, Insights and Forecast - by Application
- 8. South America Fuel Systems Test Analysis, Insights and Forecast, 2020-2032
- 8.1. Market Analysis, Insights and Forecast - by Application
- 8.1.1. Aviation
- 8.1.2. Automobile
- 8.2. Market Analysis, Insights and Forecast - by Types
- 8.2.1. Pre-factory Test
- 8.2.2. Inspection After Use
- 8.1. Market Analysis, Insights and Forecast - by Application
- 9. Europe Fuel Systems Test Analysis, Insights and Forecast, 2020-2032
- 9.1. Market Analysis, Insights and Forecast - by Application
- 9.1.1. Aviation
- 9.1.2. Automobile
- 9.2. Market Analysis, Insights and Forecast - by Types
- 9.2.1. Pre-factory Test
- 9.2.2. Inspection After Use
- 9.1. Market Analysis, Insights and Forecast - by Application
- 10. Middle East & Africa Fuel Systems Test Analysis, Insights and Forecast, 2020-2032
- 10.1. Market Analysis, Insights and Forecast - by Application
- 10.1.1. Aviation
- 10.1.2. Automobile
- 10.2. Market Analysis, Insights and Forecast - by Types
- 10.2.1. Pre-factory Test
- 10.2.2. Inspection After Use
- 10.1. Market Analysis, Insights and Forecast - by Application
- 11. Asia Pacific Fuel Systems Test Analysis, Insights and Forecast, 2020-2032
- 11.1. Market Analysis, Insights and Forecast - by Application
- 11.1.1. Aviation
- 11.1.2. Automobile
- 11.2. Market Analysis, Insights and Forecast - by Types
- 11.2.1. Pre-factory Test
- 11.2.2. Inspection After Use
- 11.1. Market Analysis, Insights and Forecast - by Application
- 12. Competitive Analysis
- 12.1. Company Profiles
- 12.1.1 Element Materials Technology
- 12.1.1.1. Company Overview
- 12.1.1.2. Products
- 12.1.1.3. Company Financials
- 12.1.1.4. SWOT Analysis
- 12.1.2 Intertek
- 12.1.2.1. Company Overview
- 12.1.2.2. Products
- 12.1.2.3. Company Financials
- 12.1.2.4. SWOT Analysis
- 12.1.3 Sterling Performance
- 12.1.3.1. Company Overview
- 12.1.3.2. Products
- 12.1.3.3. Company Financials
- 12.1.3.4. SWOT Analysis
- 12.1.4 Veritas Petroleum Services
- 12.1.4.1. Company Overview
- 12.1.4.2. Products
- 12.1.4.3. Company Financials
- 12.1.4.4. SWOT Analysis
- 12.1.5 SGS
- 12.1.5.1. Company Overview
- 12.1.5.2. Products
- 12.1.5.3. Company Financials
- 12.1.5.4. SWOT Analysis
- 12.1.6 Fastlane Autocare
- 12.1.6.1. Company Overview
- 12.1.6.2. Products
- 12.1.6.3. Company Financials
- 12.1.6.4. SWOT Analysis
- 12.1.7 Comco Canada
- 12.1.7.1. Company Overview
- 12.1.7.2. Products
- 12.1.7.3. Company Financials
- 12.1.7.4. SWOT Analysis
- 12.1.8 ECL Group
- 12.1.8.1. Company Overview
- 12.1.8.2. Products
- 12.1.8.3. Company Financials
- 12.1.8.4. SWOT Analysis
- 12.1.9 Alaska Fuel Systems
- 12.1.9.1. Company Overview
- 12.1.9.2. Products
- 12.1.9.3. Company Financials
- 12.1.9.4. SWOT Analysis
- 12.1.10 The Goodyear Tire & Rubber Company
- 12.1.10.1. Company Overview
- 12.1.10.2. Products
- 12.1.10.3. Company Financials
- 12.1.10.4. SWOT Analysis
- 12.1.1 Element Materials Technology
- 12.2. Market Entropy
- 12.2.1 Company's Key Areas Served
- 12.2.2 Recent Developments
- 12.3. Company Market Share Analysis 2025
- 12.3.1 Top 5 Companies Market Share Analysis
- 12.3.2 Top 3 Companies Market Share Analysis
- 12.4. List of Potential Customers
- 13. Research Methodology
List of Figures
- Figure 1: Global Fuel Systems Test Revenue Breakdown (billion, %) by Region 2025 & 2033
- Figure 2: North America Fuel Systems Test Revenue (billion), by Application 2025 & 2033
- Figure 3: North America Fuel Systems Test Revenue Share (%), by Application 2025 & 2033
- Figure 4: North America Fuel Systems Test Revenue (billion), by Types 2025 & 2033
- Figure 5: North America Fuel Systems Test Revenue Share (%), by Types 2025 & 2033
- Figure 6: North America Fuel Systems Test Revenue (billion), by Country 2025 & 2033
- Figure 7: North America Fuel Systems Test Revenue Share (%), by Country 2025 & 2033
- Figure 8: South America Fuel Systems Test Revenue (billion), by Application 2025 & 2033
- Figure 9: South America Fuel Systems Test Revenue Share (%), by Application 2025 & 2033
- Figure 10: South America Fuel Systems Test Revenue (billion), by Types 2025 & 2033
- Figure 11: South America Fuel Systems Test Revenue Share (%), by Types 2025 & 2033
- Figure 12: South America Fuel Systems Test Revenue (billion), by Country 2025 & 2033
- Figure 13: South America Fuel Systems Test Revenue Share (%), by Country 2025 & 2033
- Figure 14: Europe Fuel Systems Test Revenue (billion), by Application 2025 & 2033
- Figure 15: Europe Fuel Systems Test Revenue Share (%), by Application 2025 & 2033
- Figure 16: Europe Fuel Systems Test Revenue (billion), by Types 2025 & 2033
- Figure 17: Europe Fuel Systems Test Revenue Share (%), by Types 2025 & 2033
- Figure 18: Europe Fuel Systems Test Revenue (billion), by Country 2025 & 2033
- Figure 19: Europe Fuel Systems Test Revenue Share (%), by Country 2025 & 2033
- Figure 20: Middle East & Africa Fuel Systems Test Revenue (billion), by Application 2025 & 2033
- Figure 21: Middle East & Africa Fuel Systems Test Revenue Share (%), by Application 2025 & 2033
- Figure 22: Middle East & Africa Fuel Systems Test Revenue (billion), by Types 2025 & 2033
- Figure 23: Middle East & Africa Fuel Systems Test Revenue Share (%), by Types 2025 & 2033
- Figure 24: Middle East & Africa Fuel Systems Test Revenue (billion), by Country 2025 & 2033
- Figure 25: Middle East & Africa Fuel Systems Test Revenue Share (%), by Country 2025 & 2033
- Figure 26: Asia Pacific Fuel Systems Test Revenue (billion), by Application 2025 & 2033
- Figure 27: Asia Pacific Fuel Systems Test Revenue Share (%), by Application 2025 & 2033
- Figure 28: Asia Pacific Fuel Systems Test Revenue (billion), by Types 2025 & 2033
- Figure 29: Asia Pacific Fuel Systems Test Revenue Share (%), by Types 2025 & 2033
- Figure 30: Asia Pacific Fuel Systems Test Revenue (billion), by Country 2025 & 2033
- Figure 31: Asia Pacific Fuel Systems Test Revenue Share (%), by Country 2025 & 2033
List of Tables
- Table 1: Global Fuel Systems Test Revenue billion Forecast, by Application 2020 & 2033
- Table 2: Global Fuel Systems Test Revenue billion Forecast, by Types 2020 & 2033
- Table 3: Global Fuel Systems Test Revenue billion Forecast, by Region 2020 & 2033
- Table 4: Global Fuel Systems Test Revenue billion Forecast, by Application 2020 & 2033
- Table 5: Global Fuel Systems Test Revenue billion Forecast, by Types 2020 & 2033
- Table 6: Global Fuel Systems Test Revenue billion Forecast, by Country 2020 & 2033
- Table 7: United States Fuel Systems Test Revenue (billion) Forecast, by Application 2020 & 2033
- Table 8: Canada Fuel Systems Test Revenue (billion) Forecast, by Application 2020 & 2033
- Table 9: Mexico Fuel Systems Test Revenue (billion) Forecast, by Application 2020 & 2033
- Table 10: Global Fuel Systems Test Revenue billion Forecast, by Application 2020 & 2033
- Table 11: Global Fuel Systems Test Revenue billion Forecast, by Types 2020 & 2033
- Table 12: Global Fuel Systems Test Revenue billion Forecast, by Country 2020 & 2033
- Table 13: Brazil Fuel Systems Test Revenue (billion) Forecast, by Application 2020 & 2033
- Table 14: Argentina Fuel Systems Test Revenue (billion) Forecast, by Application 2020 & 2033
- Table 15: Rest of South America Fuel Systems Test Revenue (billion) Forecast, by Application 2020 & 2033
- Table 16: Global Fuel Systems Test Revenue billion Forecast, by Application 2020 & 2033
- Table 17: Global Fuel Systems Test Revenue billion Forecast, by Types 2020 & 2033
- Table 18: Global Fuel Systems Test Revenue billion Forecast, by Country 2020 & 2033
- Table 19: United Kingdom Fuel Systems Test Revenue (billion) Forecast, by Application 2020 & 2033
- Table 20: Germany Fuel Systems Test Revenue (billion) Forecast, by Application 2020 & 2033
- Table 21: France Fuel Systems Test Revenue (billion) Forecast, by Application 2020 & 2033
- Table 22: Italy Fuel Systems Test Revenue (billion) Forecast, by Application 2020 & 2033
- Table 23: Spain Fuel Systems Test Revenue (billion) Forecast, by Application 2020 & 2033
- Table 24: Russia Fuel Systems Test Revenue (billion) Forecast, by Application 2020 & 2033
- Table 25: Benelux Fuel Systems Test Revenue (billion) Forecast, by Application 2020 & 2033
- Table 26: Nordics Fuel Systems Test Revenue (billion) Forecast, by Application 2020 & 2033
- Table 27: Rest of Europe Fuel Systems Test Revenue (billion) Forecast, by Application 2020 & 2033
- Table 28: Global Fuel Systems Test Revenue billion Forecast, by Application 2020 & 2033
- Table 29: Global Fuel Systems Test Revenue billion Forecast, by Types 2020 & 2033
- Table 30: Global Fuel Systems Test Revenue billion Forecast, by Country 2020 & 2033
- Table 31: Turkey Fuel Systems Test Revenue (billion) Forecast, by Application 2020 & 2033
- Table 32: Israel Fuel Systems Test Revenue (billion) Forecast, by Application 2020 & 2033
- Table 33: GCC Fuel Systems Test Revenue (billion) Forecast, by Application 2020 & 2033
- Table 34: North Africa Fuel Systems Test Revenue (billion) Forecast, by Application 2020 & 2033
- Table 35: South Africa Fuel Systems Test Revenue (billion) Forecast, by Application 2020 & 2033
- Table 36: Rest of Middle East & Africa Fuel Systems Test Revenue (billion) Forecast, by Application 2020 & 2033
- Table 37: Global Fuel Systems Test Revenue billion Forecast, by Application 2020 & 2033
- Table 38: Global Fuel Systems Test Revenue billion Forecast, by Types 2020 & 2033
- Table 39: Global Fuel Systems Test Revenue billion Forecast, by Country 2020 & 2033
- Table 40: China Fuel Systems Test Revenue (billion) Forecast, by Application 2020 & 2033
- Table 41: India Fuel Systems Test Revenue (billion) Forecast, by Application 2020 & 2033
- Table 42: Japan Fuel Systems Test Revenue (billion) Forecast, by Application 2020 & 2033
- Table 43: South Korea Fuel Systems Test Revenue (billion) Forecast, by Application 2020 & 2033
- Table 44: ASEAN Fuel Systems Test Revenue (billion) Forecast, by Application 2020 & 2033
- Table 45: Oceania Fuel Systems Test Revenue (billion) Forecast, by Application 2020 & 2033
- Table 46: Rest of Asia Pacific Fuel Systems Test Revenue (billion) Forecast, by Application 2020 & 2033
Frequently Asked Questions
1. What is the projected Compound Annual Growth Rate (CAGR) of the Fuel Systems Test?
The projected CAGR is approximately 6.5%.
2. Which companies are prominent players in the Fuel Systems Test?
Key companies in the market include Element Materials Technology, Intertek, Sterling Performance, Veritas Petroleum Services, SGS, Fastlane Autocare, Comco Canada, ECL Group, Alaska Fuel Systems, The Goodyear Tire & Rubber Company.
3. What are the main segments of the Fuel Systems Test?
The market segments include Application, Types.
4. Can you provide details about the market size?
The market size is estimated to be USD 8.5 billion as of 2022.
5. What are some drivers contributing to market growth?
N/A
6. What are the notable trends driving market growth?
N/A
7. Are there any restraints impacting market growth?
N/A
8. Can you provide examples of recent developments in the market?
N/A
9. What pricing options are available for accessing the report?
Pricing options include single-user, multi-user, and enterprise licenses priced at USD 3350.00, USD 5025.00, and USD 6700.00 respectively.
10. Is the market size provided in terms of value or volume?
The market size is provided in terms of value, measured in billion.
11. Are there any specific market keywords associated with the report?
Yes, the market keyword associated with the report is "Fuel Systems Test," which aids in identifying and referencing the specific market segment covered.
12. How do I determine which pricing option suits my needs best?
The pricing options vary based on user requirements and access needs. Individual users may opt for single-user licenses, while businesses requiring broader access may choose multi-user or enterprise licenses for cost-effective access to the report.
13. Are there any additional resources or data provided in the Fuel Systems Test report?
While the report offers comprehensive insights, it's advisable to review the specific contents or supplementary materials provided to ascertain if additional resources or data are available.
14. How can I stay updated on further developments or reports in the Fuel Systems Test?
To stay informed about further developments, trends, and reports in the Fuel Systems Test, consider subscribing to industry newsletters, following relevant companies and organizations, or regularly checking reputable industry news sources and publications.
Methodology
Step 1 - Identification of Relevant Samples Size from Population Database


Step 2 - Approaches for Defining Global Market Size (Value, Volume* & Price*)

Note*: In applicable scenarios
Step 3 - Data Sources
Primary Research
- Web Analytics
- Survey Reports
- Research Institute
- Latest Research Reports
- Opinion Leaders
Secondary Research
- Annual Reports
- White Paper
- Latest Press Release
- Industry Association
- Paid Database
- Investor Presentations

Step 4 - Data Triangulation
Involves using different sources of information in order to increase the validity of a study
These sources are likely to be stakeholders in a program - participants, other researchers, program staff, other community members, and so on.
Then we put all data in single framework & apply various statistical tools to find out the dynamic on the market.
During the analysis stage, feedback from the stakeholder groups would be compared to determine areas of agreement as well as areas of divergence