

Key Insights
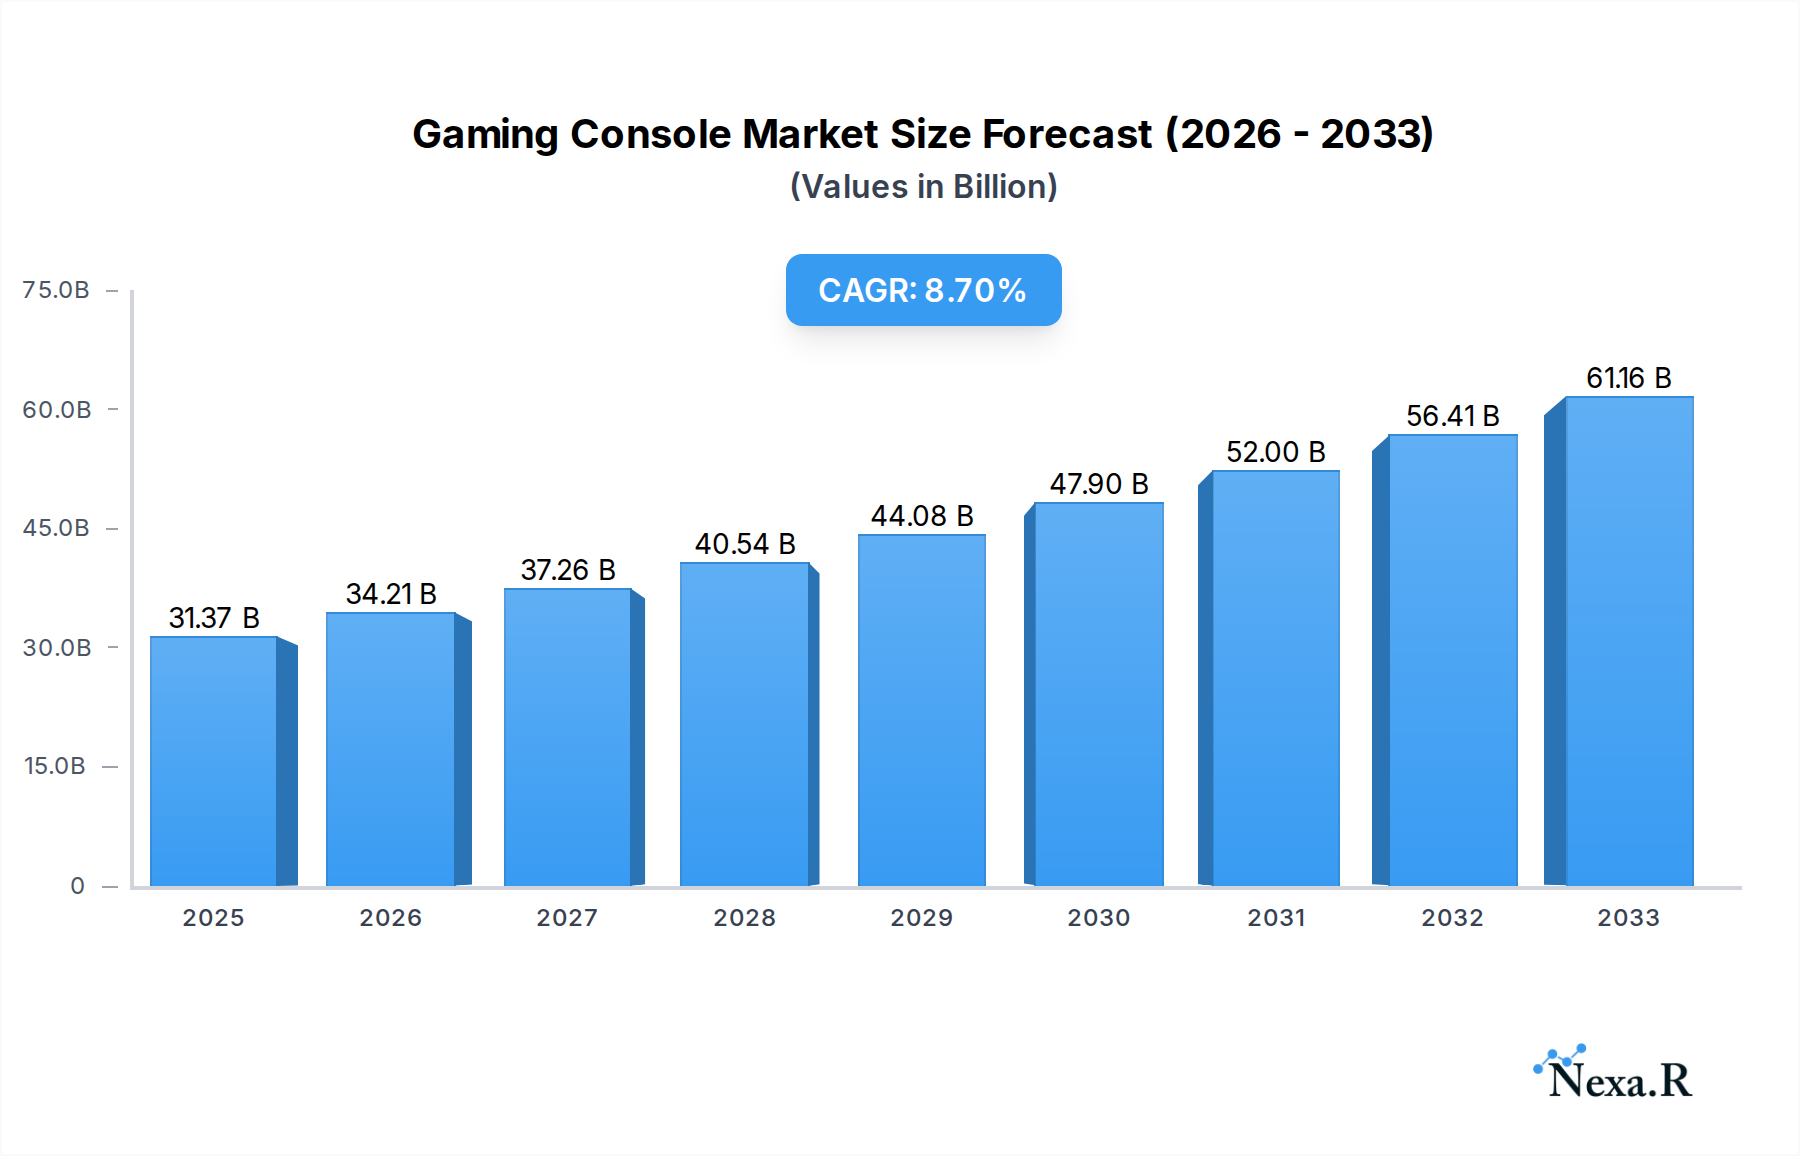
The global gaming console market is poised for robust growth, projected to reach a significant $31.37 billion in 2025, demonstrating a healthy Compound Annual Growth Rate (CAGR) of 8.49% throughout the forecast period of 2025-2033. This expansion is primarily fueled by an increasing global adoption of gaming as a primary form of entertainment, transcending age demographics and geographical boundaries. The proliferation of high-speed internet, coupled with advancements in graphical processing power and immersive gameplay experiences, continues to attract new users and retain existing ones. Key drivers include the development of next-generation consoles offering enhanced performance and exclusive game titles, the growing popularity of esports and competitive gaming, and the increasing integration of cloud gaming services that reduce the need for expensive hardware. Furthermore, the accessibility of gaming consoles for both household and commercial use, ranging from dedicated home consoles to portable handheld devices, caters to a diverse consumer base with varying preferences and lifestyles, solidifying the market's upward trajectory.

Gaming Console Market Size (In Billion)
The gaming console landscape is characterized by evolving consumer preferences and technological innovations. While home consoles like those from Sony, Microsoft, and Nintendo continue to dominate, handheld consoles are experiencing a resurgence, offering flexibility and on-the-go entertainment. The market is also witnessing a growing trend towards digital game distribution and subscription services, which provide recurring revenue streams for manufacturers and offer players a vast library of games at a fixed cost. However, potential restraints such as the high cost of cutting-edge consoles and the increasing competition from mobile gaming and PC gaming platforms could temper growth in certain segments. Geographically, North America and Europe are established strongholds, while the Asia Pacific region, particularly China and India, presents immense untapped potential due to its large, young population and rapidly growing disposable income, indicating significant opportunities for market expansion and innovation in the coming years.
Gaming Console Company Market Share
Gaming Console Market Analysis Report: 2019-2033
This comprehensive report offers an in-depth analysis of the global Gaming Console market, covering historical trends, current dynamics, and future projections. With a focus on industry-leading companies like Sony, Microsoft, and Nintendo, and segments including Household Use and Commercial Use, and types such as Home Console and Handheld Console, this report provides actionable insights for stakeholders. The study period spans from 2019 to 2033, with a base year of 2025 and a forecast period of 2025–2033.
Gaming Console Market Dynamics & Structure
The global Gaming Console market is characterized by a moderate to high level of concentration, with key players like Sony, Microsoft, and Nintendo dominating significant market share. Technological innovation remains a primary driver, with continuous advancements in processing power, graphics rendering, virtual reality (VR), and augmented reality (AR) capabilities shaping product development and consumer adoption. Regulatory frameworks, primarily concerning content ratings and data privacy, have a nuanced impact, ensuring responsible gaming practices while occasionally influencing market access. Competitive product substitutes, including PC gaming and mobile gaming, present a constant challenge, forcing console manufacturers to emphasize unique ecosystem benefits and exclusive content. End-user demographics are expanding, encompassing a wider age range and diverse interests, driven by the increasing accessibility and social aspects of gaming. Mergers and acquisitions (M&A) trends are becoming more prominent as companies seek to acquire intellectual property, talent, and expand their service offerings. For instance, there were an estimated 15 M&A deals in the gaming sector during the historical period of 2019-2024.
- Market Concentration: Dominated by Sony (PlayStation), Microsoft (Xbox), and Nintendo (Switch), with a combined market share estimated at 78% in 2025.
- Technological Innovation Drivers: Advancements in AI for game development, cloud gaming infrastructure, and haptic feedback technologies are crucial.
- Regulatory Frameworks: Evolving regulations around loot boxes and in-game purchases influence monetization strategies.
- Competitive Product Substitutes: High-performance PCs and the ubiquitous smartphone gaming market require consoles to offer distinct value propositions.
- End-User Demographics: Growth in casual gamers and the increasing appeal of esports are broadening the consumer base.
- M&A Trends: Strategic acquisitions of game studios and technology companies to secure exclusive content and future-proof offerings.
Gaming Console Growth Trends & Insights
The global Gaming Console market is projected for robust growth throughout the forecast period. Driven by escalating consumer demand for immersive entertainment experiences and the proliferation of high-speed internet infrastructure, the market is expected to witness a Compound Annual Growth Rate (CAGR) of approximately 7.5% from 2025 to 2033. The market size, which was valued at an estimated $65.2 billion units in the base year of 2025, is anticipated to reach over $110 billion units by 2033. Adoption rates for next-generation consoles are accelerating, fueled by advancements in graphical fidelity, faster loading times, and the integration of subscription services that offer access to extensive game libraries. Technological disruptions, such as the increasing viability of cloud gaming, are transforming how consumers access and play games, potentially blurring the lines between dedicated hardware and service-based platforms. Consumer behavior shifts are also playing a significant role, with a growing preference for social gaming experiences, cooperative play, and the integration of gaming into broader digital lifestyles. The sustained investment in exclusive game titles and the continuous improvement of online multiplayer functionalities are critical in retaining and attracting users. The integration of AI-powered features within consoles and games is also enhancing gameplay realism and personalized experiences, further driving engagement. The penetration of gaming consoles in emerging markets, coupled with the sustained popularity in established regions, underpins this positive growth trajectory.
Dominant Regions, Countries, or Segments in Gaming Console
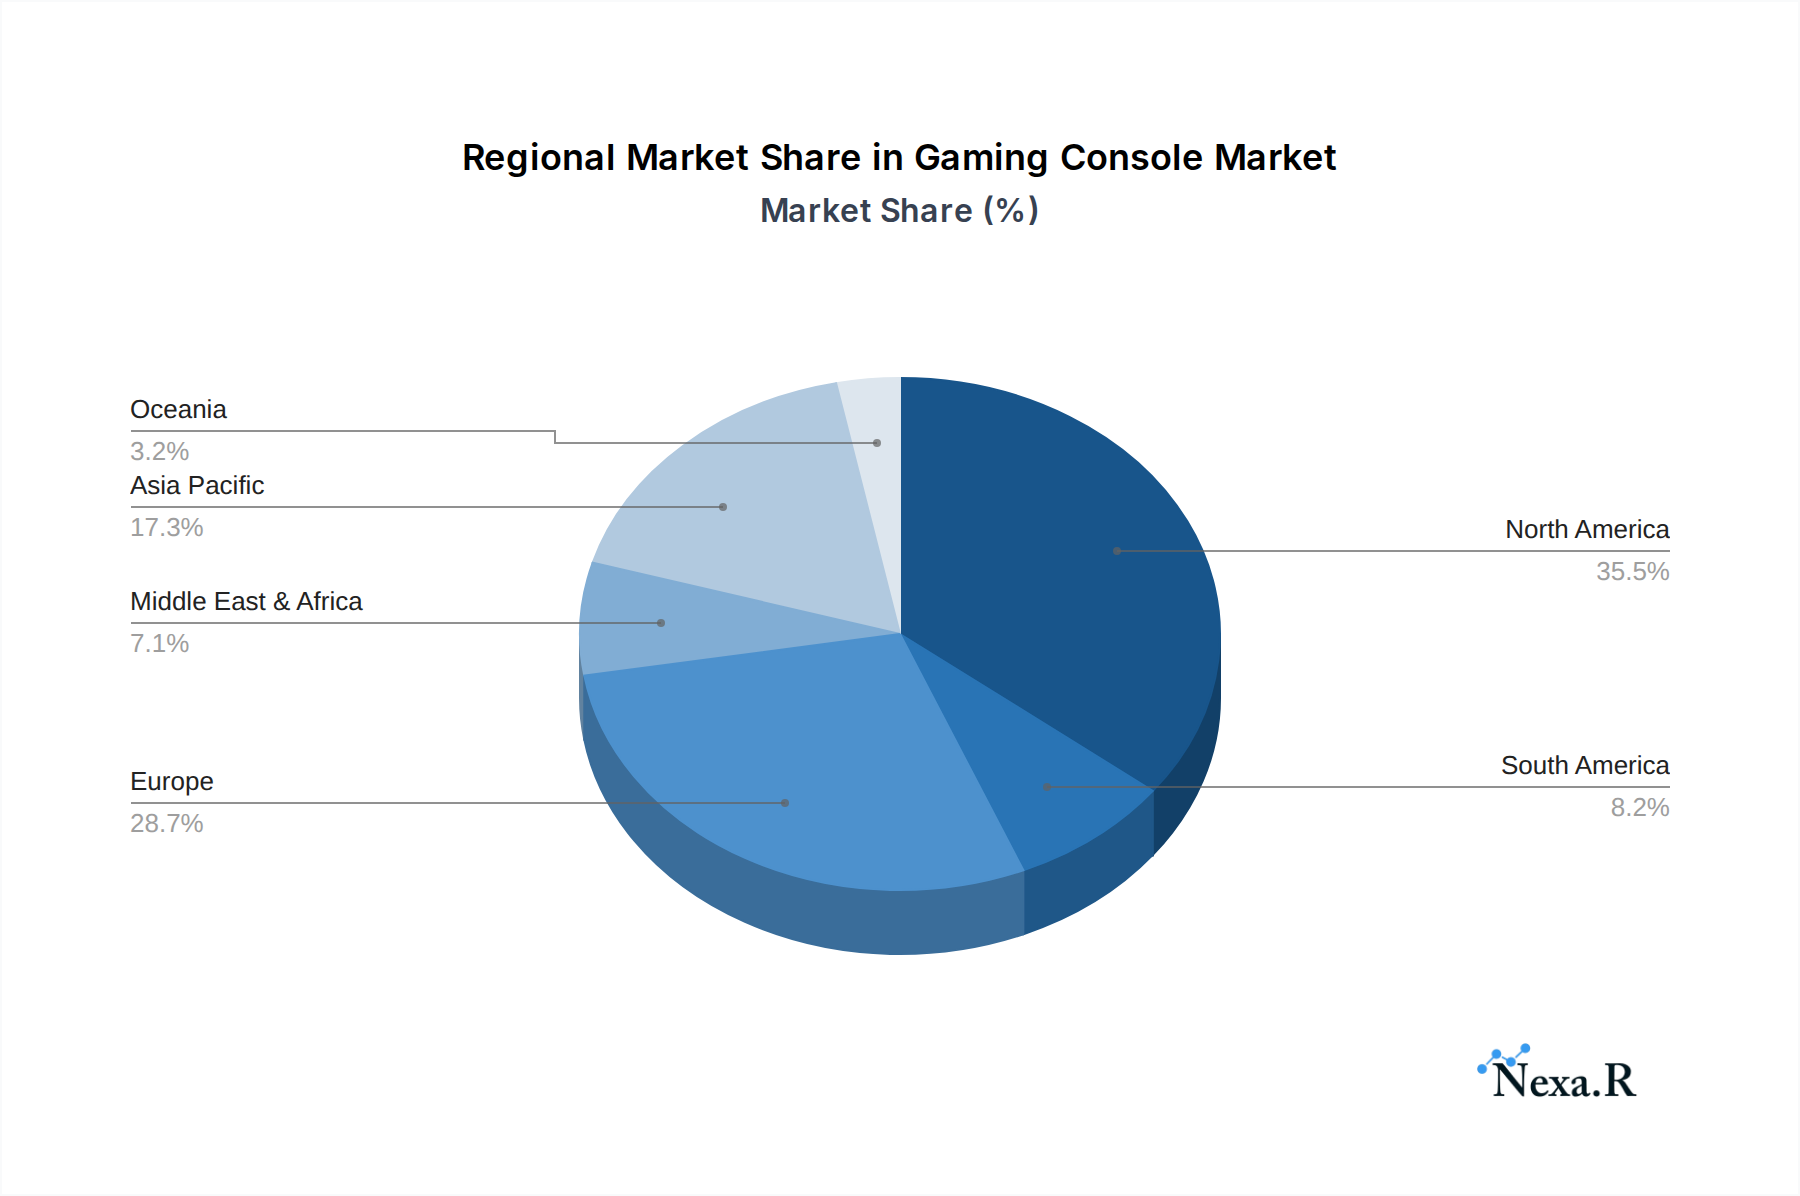
North America currently stands as the dominant region in the global Gaming Console market, driven by a strong culture of gaming, high disposable incomes, and advanced digital infrastructure. The United States, in particular, represents a significant portion of this dominance, with an estimated market share of 35% of the global console market in 2025. The Application segment of Household Use is the primary growth engine, accounting for over 90% of the total market, as consoles are integral to home entertainment systems. Within the Types segment, Home Consoles continue to lead, projected to hold a market share of approximately 70% in 2025, owing to their superior processing power and extensive game libraries. However, Handheld Consoles are experiencing substantial growth, especially in regions with a higher proportion of mobile-first consumers and a demand for portable gaming experiences. Key drivers for North American dominance include substantial R&D investments by leading manufacturers, aggressive marketing campaigns, and a well-established ecosystem of game developers and publishers. Economic policies supporting technological advancement and consumer spending on entertainment further bolster this position. While Asia-Pacific is a rapidly growing market with immense potential, and Europe demonstrates consistent demand, North America's established gaming infrastructure and consumer spending habits currently solidify its leadership. The commercial use of gaming consoles, while smaller in scale, is also a niche growth area, particularly within entertainment venues and VR arcades, contributing to the overall market expansion.
- Leading Region: North America, with the United States as the primary market.
- Key Application Driver: Household Use, representing the core consumer base.
- Dominant Type: Home Consoles, offering high-fidelity gaming experiences.
- Growth Potential: Asia-Pacific presents significant untapped potential for future market expansion.
- Economic Factors: High disposable income and robust digital infrastructure in North America.
Gaming Console Product Landscape
The Gaming Console product landscape is defined by a relentless pursuit of enhanced gaming experiences through cutting-edge technology. Manufacturers are focusing on next-generation hardware, boasting significantly improved CPU and GPU capabilities, ultra-fast SSD storage for near-instantaneous loading times, and advanced cooling systems to sustain peak performance. Ray tracing technology is becoming a standard feature, delivering hyper-realistic lighting, shadows, and reflections. The integration of advanced haptic feedback and adaptive triggers in controllers offers a more tactile and immersive connection to in-game actions. Furthermore, the expansion of digital storefronts and subscription services provides consumers with vast libraries of games, from AAA blockbusters to independent titles, accessible at their fingertips. The seamless integration of online multiplayer, cloud saves, and cross-platform play further enhances the user experience and connectivity.
Key Drivers, Barriers & Challenges in Gaming Console
Key Drivers: The Gaming Console market is propelled by several key drivers. Technological advancements, including increased processing power, improved graphics, and the integration of VR/AR, are central. The expanding digital ecosystem, encompassing online multiplayer, cloud gaming, and subscription services, significantly enhances user engagement and accessibility. Growing global interest in esports and competitive gaming, coupled with increasing disposable incomes in emerging economies, also fuels market expansion.
- Technological Advancements: Enhanced graphics, faster loading, immersive features.
- Digital Ecosystem: Cloud gaming, subscription services, online communities.
- Esports Growth: Increased viewership and participation driving console demand.
- Emerging Markets: Rising disposable incomes and adoption rates.
Barriers & Challenges: Despite strong growth, the industry faces significant barriers and challenges. High manufacturing costs and complex supply chain logistics, particularly for advanced components, can lead to production bottlenecks and price fluctuations. Intense competition from PC and mobile gaming platforms requires continuous innovation and strategic pricing. The increasing cost of game development and the demand for high-quality exclusive content place a substantial financial burden on developers and publishers. Regulatory scrutiny regarding in-game purchases and data privacy also presents ongoing challenges, requiring adherence to evolving legal frameworks.
- Supply Chain Disruptions: Component shortages and logistical complexities.
- Intense Competition: From PC, mobile, and cloud gaming services.
- High Development Costs: For AAA titles and innovative features.
- Regulatory Hurdles: Data privacy, in-game purchase regulations.
Emerging Opportunities in Gaming Console
Emerging opportunities in the Gaming Console sector lie in the continued expansion of cloud gaming services, offering console-like experiences on a wider range of devices and reducing the barrier to entry for new players. The integration of AI in gameplay design and personalization presents a significant avenue for creating more dynamic and engaging experiences. Furthermore, the growing popularity of the metaverse and VR/AR applications opens up new frontiers for immersive gaming and social interaction. The untapped potential in developing regions, coupled with the increasing adoption of gaming as a mainstream entertainment form, offers substantial growth prospects.
Growth Accelerators in the Gaming Console Industry
Several catalysts are accelerating the growth of the Gaming Console industry. Technological breakthroughs, such as advancements in custom silicon design and efficient power management, are enabling more powerful and compact consoles. Strategic partnerships between hardware manufacturers and content creators, including major game studios and independent developers, are crucial for securing exclusive titles and building robust game libraries. Market expansion strategies, focusing on underserved demographics and geographical regions, alongside the development of more affordable entry-level consoles, are also key growth accelerators. The increasing adoption of subscription models like Xbox Game Pass and PlayStation Plus is locking in recurring revenue and fostering ecosystem loyalty.
Key Players Shaping the Gaming Console Market
- Sony
- Microsoft
- Nintendo
Notable Milestones in Gaming Console Sector
- 2019: Launch of Google Stadia, pioneering a new era of cloud gaming.
- November 2020: Release of Sony PlayStation 5 and Microsoft Xbox Series X/S, setting new standards for console performance.
- March 2021: Nintendo Switch surpasses 80 million units sold, demonstrating the enduring appeal of hybrid consoles.
- January 2022: Acquisition of Activision Blizzard by Microsoft, a landmark move in content acquisition.
- June 2023: Introduction of new mid-generation console refreshes or substantial software updates enhancing existing hardware capabilities.
In-Depth Gaming Console Market Outlook
The outlook for the Gaming Console market is exceptionally bright, driven by a confluence of factors that promise sustained and accelerated growth. The ongoing evolution of cloud gaming infrastructure is poised to democratize access to high-fidelity gaming experiences, potentially expanding the market beyond traditional console owners. Continued investment in cutting-edge hardware, coupled with an expanding ecosystem of innovative software and immersive content, will ensure consoles remain at the forefront of home entertainment. Strategic partnerships and a focus on developing engaging user experiences within burgeoning digital worlds will further solidify their market position. The industry's adaptability to emerging technologies and consumer preferences positions it for significant expansion in the coming years, making it a dynamic and lucrative sector.
Gaming Console Segmentation
-
1. Application
- 1.1. Household Use
- 1.2. Commercial Use
-
2. Types
- 2.1. Home Console
- 2.2. Handheld Console
Gaming Console Segmentation By Geography
-
1. North America
- 1.1. United States
- 1.2. Canada
- 1.3. Mexico
-
2. South America
- 2.1. Brazil
- 2.2. Argentina
- 2.3. Rest of South America
-
3. Europe
- 3.1. United Kingdom
- 3.2. Germany
- 3.3. France
- 3.4. Italy
- 3.5. Spain
- 3.6. Russia
- 3.7. Benelux
- 3.8. Nordics
- 3.9. Rest of Europe
-
4. Middle East & Africa
- 4.1. Turkey
- 4.2. Israel
- 4.3. GCC
- 4.4. North Africa
- 4.5. South Africa
- 4.6. Rest of Middle East & Africa
-
5. Asia Pacific
- 5.1. China
- 5.2. India
- 5.3. Japan
- 5.4. South Korea
- 5.5. ASEAN
- 5.6. Oceania
- 5.7. Rest of Asia Pacific
Gaming Console Regional Market Share
Geographic Coverage of Gaming Console
Gaming Console REPORT HIGHLIGHTS
| Aspects | Details |
|---|---|
| Study Period | 2020-2034 |
| Base Year | 2025 |
| Estimated Year | 2026 |
| Forecast Period | 2026-2034 |
| Historical Period | 2020-2025 |
| Growth Rate | CAGR of 8.49% from 2020-2034 |
| Segmentation |
|
Table of Contents
- 1. Introduction
- 1.1. Research Scope
- 1.2. Market Segmentation
- 1.3. Research Objective
- 1.4. Definitions and Assumptions
- 2. Executive Summary
- 2.1. Market Snapshot
- 3. Market Dynamics
- 3.1. Market Drivers
- 3.2. Market Restrains
- 3.3. Market Trends
- 3.4. Market Opportunities
- 4. Market Factor Analysis
- 4.1. Porters Five Forces
- 4.1.1. Bargaining Power of Suppliers
- 4.1.2. Bargaining Power of Buyers
- 4.1.3. Threat of New Entrants
- 4.1.4. Threat of Substitutes
- 4.1.5. Competitive Rivalry
- 4.2. PESTEL analysis
- 4.3. BCG Analysis
- 4.3.1. Stars (High Growth, High Market Share)
- 4.3.2. Cash Cows (Low Growth, High Market Share)
- 4.3.3. Question Mark (High Growth, Low Market Share)
- 4.3.4. Dogs (Low Growth, Low Market Share)
- 4.4. Ansoff Matrix Analysis
- 4.5. Supply Chain Analysis
- 4.6. Regulatory Landscape
- 4.7. Current Market Potential and Opportunity Assessment (TAM–SAM–SOM Framework)
- 4.8. NRP Analyst Note
- 4.1. Porters Five Forces
- 5. Market Analysis, Insights and Forecast 2021-2033
- 5.1. Market Analysis, Insights and Forecast - by Application
- 5.1.1. Household Use
- 5.1.2. Commercial Use
- 5.2. Market Analysis, Insights and Forecast - by Types
- 5.2.1. Home Console
- 5.2.2. Handheld Console
- 5.3. Market Analysis, Insights and Forecast - by Region
- 5.3.1. North America
- 5.3.2. South America
- 5.3.3. Europe
- 5.3.4. Middle East & Africa
- 5.3.5. Asia Pacific
- 5.1. Market Analysis, Insights and Forecast - by Application
- 6. Global Gaming Console Analysis, Insights and Forecast, 2021-2033
- 6.1. Market Analysis, Insights and Forecast - by Application
- 6.1.1. Household Use
- 6.1.2. Commercial Use
- 6.2. Market Analysis, Insights and Forecast - by Types
- 6.2.1. Home Console
- 6.2.2. Handheld Console
- 6.1. Market Analysis, Insights and Forecast - by Application
- 7. North America Gaming Console Analysis, Insights and Forecast, 2020-2032
- 7.1. Market Analysis, Insights and Forecast - by Application
- 7.1.1. Household Use
- 7.1.2. Commercial Use
- 7.2. Market Analysis, Insights and Forecast - by Types
- 7.2.1. Home Console
- 7.2.2. Handheld Console
- 7.1. Market Analysis, Insights and Forecast - by Application
- 8. South America Gaming Console Analysis, Insights and Forecast, 2020-2032
- 8.1. Market Analysis, Insights and Forecast - by Application
- 8.1.1. Household Use
- 8.1.2. Commercial Use
- 8.2. Market Analysis, Insights and Forecast - by Types
- 8.2.1. Home Console
- 8.2.2. Handheld Console
- 8.1. Market Analysis, Insights and Forecast - by Application
- 9. Europe Gaming Console Analysis, Insights and Forecast, 2020-2032
- 9.1. Market Analysis, Insights and Forecast - by Application
- 9.1.1. Household Use
- 9.1.2. Commercial Use
- 9.2. Market Analysis, Insights and Forecast - by Types
- 9.2.1. Home Console
- 9.2.2. Handheld Console
- 9.1. Market Analysis, Insights and Forecast - by Application
- 10. Middle East & Africa Gaming Console Analysis, Insights and Forecast, 2020-2032
- 10.1. Market Analysis, Insights and Forecast - by Application
- 10.1.1. Household Use
- 10.1.2. Commercial Use
- 10.2. Market Analysis, Insights and Forecast - by Types
- 10.2.1. Home Console
- 10.2.2. Handheld Console
- 10.1. Market Analysis, Insights and Forecast - by Application
- 11. Asia Pacific Gaming Console Analysis, Insights and Forecast, 2020-2032
- 11.1. Market Analysis, Insights and Forecast - by Application
- 11.1.1. Household Use
- 11.1.2. Commercial Use
- 11.2. Market Analysis, Insights and Forecast - by Types
- 11.2.1. Home Console
- 11.2.2. Handheld Console
- 11.1. Market Analysis, Insights and Forecast - by Application
- 12. Competitive Analysis
- 12.1. Company Profiles
- 12.1.1 Sony
- 12.1.1.1. Company Overview
- 12.1.1.2. Products
- 12.1.1.3. Company Financials
- 12.1.1.4. SWOT Analysis
- 12.1.2 Microsoft
- 12.1.2.1. Company Overview
- 12.1.2.2. Products
- 12.1.2.3. Company Financials
- 12.1.2.4. SWOT Analysis
- 12.1.3 Nintendo
- 12.1.3.1. Company Overview
- 12.1.3.2. Products
- 12.1.3.3. Company Financials
- 12.1.3.4. SWOT Analysis
- 12.1.1 Sony
- 12.2. Market Entropy
- 12.2.1 Company's Key Areas Served
- 12.2.2 Recent Developments
- 12.3. Company Market Share Analysis 2025
- 12.3.1 Top 5 Companies Market Share Analysis
- 12.3.2 Top 3 Companies Market Share Analysis
- 12.4. List of Potential Customers
- 13. Research Methodology
List of Figures
- Figure 1: Global Gaming Console Revenue Breakdown (billion, %) by Region 2025 & 2033
- Figure 2: Global Gaming Console Volume Breakdown (K, %) by Region 2025 & 2033
- Figure 3: North America Gaming Console Revenue (billion), by Application 2025 & 2033
- Figure 4: North America Gaming Console Volume (K), by Application 2025 & 2033
- Figure 5: North America Gaming Console Revenue Share (%), by Application 2025 & 2033
- Figure 6: North America Gaming Console Volume Share (%), by Application 2025 & 2033
- Figure 7: North America Gaming Console Revenue (billion), by Types 2025 & 2033
- Figure 8: North America Gaming Console Volume (K), by Types 2025 & 2033
- Figure 9: North America Gaming Console Revenue Share (%), by Types 2025 & 2033
- Figure 10: North America Gaming Console Volume Share (%), by Types 2025 & 2033
- Figure 11: North America Gaming Console Revenue (billion), by Country 2025 & 2033
- Figure 12: North America Gaming Console Volume (K), by Country 2025 & 2033
- Figure 13: North America Gaming Console Revenue Share (%), by Country 2025 & 2033
- Figure 14: North America Gaming Console Volume Share (%), by Country 2025 & 2033
- Figure 15: South America Gaming Console Revenue (billion), by Application 2025 & 2033
- Figure 16: South America Gaming Console Volume (K), by Application 2025 & 2033
- Figure 17: South America Gaming Console Revenue Share (%), by Application 2025 & 2033
- Figure 18: South America Gaming Console Volume Share (%), by Application 2025 & 2033
- Figure 19: South America Gaming Console Revenue (billion), by Types 2025 & 2033
- Figure 20: South America Gaming Console Volume (K), by Types 2025 & 2033
- Figure 21: South America Gaming Console Revenue Share (%), by Types 2025 & 2033
- Figure 22: South America Gaming Console Volume Share (%), by Types 2025 & 2033
- Figure 23: South America Gaming Console Revenue (billion), by Country 2025 & 2033
- Figure 24: South America Gaming Console Volume (K), by Country 2025 & 2033
- Figure 25: South America Gaming Console Revenue Share (%), by Country 2025 & 2033
- Figure 26: South America Gaming Console Volume Share (%), by Country 2025 & 2033
- Figure 27: Europe Gaming Console Revenue (billion), by Application 2025 & 2033
- Figure 28: Europe Gaming Console Volume (K), by Application 2025 & 2033
- Figure 29: Europe Gaming Console Revenue Share (%), by Application 2025 & 2033
- Figure 30: Europe Gaming Console Volume Share (%), by Application 2025 & 2033
- Figure 31: Europe Gaming Console Revenue (billion), by Types 2025 & 2033
- Figure 32: Europe Gaming Console Volume (K), by Types 2025 & 2033
- Figure 33: Europe Gaming Console Revenue Share (%), by Types 2025 & 2033
- Figure 34: Europe Gaming Console Volume Share (%), by Types 2025 & 2033
- Figure 35: Europe Gaming Console Revenue (billion), by Country 2025 & 2033
- Figure 36: Europe Gaming Console Volume (K), by Country 2025 & 2033
- Figure 37: Europe Gaming Console Revenue Share (%), by Country 2025 & 2033
- Figure 38: Europe Gaming Console Volume Share (%), by Country 2025 & 2033
- Figure 39: Middle East & Africa Gaming Console Revenue (billion), by Application 2025 & 2033
- Figure 40: Middle East & Africa Gaming Console Volume (K), by Application 2025 & 2033
- Figure 41: Middle East & Africa Gaming Console Revenue Share (%), by Application 2025 & 2033
- Figure 42: Middle East & Africa Gaming Console Volume Share (%), by Application 2025 & 2033
- Figure 43: Middle East & Africa Gaming Console Revenue (billion), by Types 2025 & 2033
- Figure 44: Middle East & Africa Gaming Console Volume (K), by Types 2025 & 2033
- Figure 45: Middle East & Africa Gaming Console Revenue Share (%), by Types 2025 & 2033
- Figure 46: Middle East & Africa Gaming Console Volume Share (%), by Types 2025 & 2033
- Figure 47: Middle East & Africa Gaming Console Revenue (billion), by Country 2025 & 2033
- Figure 48: Middle East & Africa Gaming Console Volume (K), by Country 2025 & 2033
- Figure 49: Middle East & Africa Gaming Console Revenue Share (%), by Country 2025 & 2033
- Figure 50: Middle East & Africa Gaming Console Volume Share (%), by Country 2025 & 2033
- Figure 51: Asia Pacific Gaming Console Revenue (billion), by Application 2025 & 2033
- Figure 52: Asia Pacific Gaming Console Volume (K), by Application 2025 & 2033
- Figure 53: Asia Pacific Gaming Console Revenue Share (%), by Application 2025 & 2033
- Figure 54: Asia Pacific Gaming Console Volume Share (%), by Application 2025 & 2033
- Figure 55: Asia Pacific Gaming Console Revenue (billion), by Types 2025 & 2033
- Figure 56: Asia Pacific Gaming Console Volume (K), by Types 2025 & 2033
- Figure 57: Asia Pacific Gaming Console Revenue Share (%), by Types 2025 & 2033
- Figure 58: Asia Pacific Gaming Console Volume Share (%), by Types 2025 & 2033
- Figure 59: Asia Pacific Gaming Console Revenue (billion), by Country 2025 & 2033
- Figure 60: Asia Pacific Gaming Console Volume (K), by Country 2025 & 2033
- Figure 61: Asia Pacific Gaming Console Revenue Share (%), by Country 2025 & 2033
- Figure 62: Asia Pacific Gaming Console Volume Share (%), by Country 2025 & 2033
List of Tables
- Table 1: Global Gaming Console Revenue billion Forecast, by Application 2020 & 2033
- Table 2: Global Gaming Console Volume K Forecast, by Application 2020 & 2033
- Table 3: Global Gaming Console Revenue billion Forecast, by Types 2020 & 2033
- Table 4: Global Gaming Console Volume K Forecast, by Types 2020 & 2033
- Table 5: Global Gaming Console Revenue billion Forecast, by Region 2020 & 2033
- Table 6: Global Gaming Console Volume K Forecast, by Region 2020 & 2033
- Table 7: Global Gaming Console Revenue billion Forecast, by Application 2020 & 2033
- Table 8: Global Gaming Console Volume K Forecast, by Application 2020 & 2033
- Table 9: Global Gaming Console Revenue billion Forecast, by Types 2020 & 2033
- Table 10: Global Gaming Console Volume K Forecast, by Types 2020 & 2033
- Table 11: Global Gaming Console Revenue billion Forecast, by Country 2020 & 2033
- Table 12: Global Gaming Console Volume K Forecast, by Country 2020 & 2033
- Table 13: United States Gaming Console Revenue (billion) Forecast, by Application 2020 & 2033
- Table 14: United States Gaming Console Volume (K) Forecast, by Application 2020 & 2033
- Table 15: Canada Gaming Console Revenue (billion) Forecast, by Application 2020 & 2033
- Table 16: Canada Gaming Console Volume (K) Forecast, by Application 2020 & 2033
- Table 17: Mexico Gaming Console Revenue (billion) Forecast, by Application 2020 & 2033
- Table 18: Mexico Gaming Console Volume (K) Forecast, by Application 2020 & 2033
- Table 19: Global Gaming Console Revenue billion Forecast, by Application 2020 & 2033
- Table 20: Global Gaming Console Volume K Forecast, by Application 2020 & 2033
- Table 21: Global Gaming Console Revenue billion Forecast, by Types 2020 & 2033
- Table 22: Global Gaming Console Volume K Forecast, by Types 2020 & 2033
- Table 23: Global Gaming Console Revenue billion Forecast, by Country 2020 & 2033
- Table 24: Global Gaming Console Volume K Forecast, by Country 2020 & 2033
- Table 25: Brazil Gaming Console Revenue (billion) Forecast, by Application 2020 & 2033
- Table 26: Brazil Gaming Console Volume (K) Forecast, by Application 2020 & 2033
- Table 27: Argentina Gaming Console Revenue (billion) Forecast, by Application 2020 & 2033
- Table 28: Argentina Gaming Console Volume (K) Forecast, by Application 2020 & 2033
- Table 29: Rest of South America Gaming Console Revenue (billion) Forecast, by Application 2020 & 2033
- Table 30: Rest of South America Gaming Console Volume (K) Forecast, by Application 2020 & 2033
- Table 31: Global Gaming Console Revenue billion Forecast, by Application 2020 & 2033
- Table 32: Global Gaming Console Volume K Forecast, by Application 2020 & 2033
- Table 33: Global Gaming Console Revenue billion Forecast, by Types 2020 & 2033
- Table 34: Global Gaming Console Volume K Forecast, by Types 2020 & 2033
- Table 35: Global Gaming Console Revenue billion Forecast, by Country 2020 & 2033
- Table 36: Global Gaming Console Volume K Forecast, by Country 2020 & 2033
- Table 37: United Kingdom Gaming Console Revenue (billion) Forecast, by Application 2020 & 2033
- Table 38: United Kingdom Gaming Console Volume (K) Forecast, by Application 2020 & 2033
- Table 39: Germany Gaming Console Revenue (billion) Forecast, by Application 2020 & 2033
- Table 40: Germany Gaming Console Volume (K) Forecast, by Application 2020 & 2033
- Table 41: France Gaming Console Revenue (billion) Forecast, by Application 2020 & 2033
- Table 42: France Gaming Console Volume (K) Forecast, by Application 2020 & 2033
- Table 43: Italy Gaming Console Revenue (billion) Forecast, by Application 2020 & 2033
- Table 44: Italy Gaming Console Volume (K) Forecast, by Application 2020 & 2033
- Table 45: Spain Gaming Console Revenue (billion) Forecast, by Application 2020 & 2033
- Table 46: Spain Gaming Console Volume (K) Forecast, by Application 2020 & 2033
- Table 47: Russia Gaming Console Revenue (billion) Forecast, by Application 2020 & 2033
- Table 48: Russia Gaming Console Volume (K) Forecast, by Application 2020 & 2033
- Table 49: Benelux Gaming Console Revenue (billion) Forecast, by Application 2020 & 2033
- Table 50: Benelux Gaming Console Volume (K) Forecast, by Application 2020 & 2033
- Table 51: Nordics Gaming Console Revenue (billion) Forecast, by Application 2020 & 2033
- Table 52: Nordics Gaming Console Volume (K) Forecast, by Application 2020 & 2033
- Table 53: Rest of Europe Gaming Console Revenue (billion) Forecast, by Application 2020 & 2033
- Table 54: Rest of Europe Gaming Console Volume (K) Forecast, by Application 2020 & 2033
- Table 55: Global Gaming Console Revenue billion Forecast, by Application 2020 & 2033
- Table 56: Global Gaming Console Volume K Forecast, by Application 2020 & 2033
- Table 57: Global Gaming Console Revenue billion Forecast, by Types 2020 & 2033
- Table 58: Global Gaming Console Volume K Forecast, by Types 2020 & 2033
- Table 59: Global Gaming Console Revenue billion Forecast, by Country 2020 & 2033
- Table 60: Global Gaming Console Volume K Forecast, by Country 2020 & 2033
- Table 61: Turkey Gaming Console Revenue (billion) Forecast, by Application 2020 & 2033
- Table 62: Turkey Gaming Console Volume (K) Forecast, by Application 2020 & 2033
- Table 63: Israel Gaming Console Revenue (billion) Forecast, by Application 2020 & 2033
- Table 64: Israel Gaming Console Volume (K) Forecast, by Application 2020 & 2033
- Table 65: GCC Gaming Console Revenue (billion) Forecast, by Application 2020 & 2033
- Table 66: GCC Gaming Console Volume (K) Forecast, by Application 2020 & 2033
- Table 67: North Africa Gaming Console Revenue (billion) Forecast, by Application 2020 & 2033
- Table 68: North Africa Gaming Console Volume (K) Forecast, by Application 2020 & 2033
- Table 69: South Africa Gaming Console Revenue (billion) Forecast, by Application 2020 & 2033
- Table 70: South Africa Gaming Console Volume (K) Forecast, by Application 2020 & 2033
- Table 71: Rest of Middle East & Africa Gaming Console Revenue (billion) Forecast, by Application 2020 & 2033
- Table 72: Rest of Middle East & Africa Gaming Console Volume (K) Forecast, by Application 2020 & 2033
- Table 73: Global Gaming Console Revenue billion Forecast, by Application 2020 & 2033
- Table 74: Global Gaming Console Volume K Forecast, by Application 2020 & 2033
- Table 75: Global Gaming Console Revenue billion Forecast, by Types 2020 & 2033
- Table 76: Global Gaming Console Volume K Forecast, by Types 2020 & 2033
- Table 77: Global Gaming Console Revenue billion Forecast, by Country 2020 & 2033
- Table 78: Global Gaming Console Volume K Forecast, by Country 2020 & 2033
- Table 79: China Gaming Console Revenue (billion) Forecast, by Application 2020 & 2033
- Table 80: China Gaming Console Volume (K) Forecast, by Application 2020 & 2033
- Table 81: India Gaming Console Revenue (billion) Forecast, by Application 2020 & 2033
- Table 82: India Gaming Console Volume (K) Forecast, by Application 2020 & 2033
- Table 83: Japan Gaming Console Revenue (billion) Forecast, by Application 2020 & 2033
- Table 84: Japan Gaming Console Volume (K) Forecast, by Application 2020 & 2033
- Table 85: South Korea Gaming Console Revenue (billion) Forecast, by Application 2020 & 2033
- Table 86: South Korea Gaming Console Volume (K) Forecast, by Application 2020 & 2033
- Table 87: ASEAN Gaming Console Revenue (billion) Forecast, by Application 2020 & 2033
- Table 88: ASEAN Gaming Console Volume (K) Forecast, by Application 2020 & 2033
- Table 89: Oceania Gaming Console Revenue (billion) Forecast, by Application 2020 & 2033
- Table 90: Oceania Gaming Console Volume (K) Forecast, by Application 2020 & 2033
- Table 91: Rest of Asia Pacific Gaming Console Revenue (billion) Forecast, by Application 2020 & 2033
- Table 92: Rest of Asia Pacific Gaming Console Volume (K) Forecast, by Application 2020 & 2033
Frequently Asked Questions
1. What is the projected Compound Annual Growth Rate (CAGR) of the Gaming Console?
The projected CAGR is approximately 8.49%.
2. Which companies are prominent players in the Gaming Console?
Key companies in the market include Sony, Microsoft, Nintendo.
3. What are the main segments of the Gaming Console?
The market segments include Application, Types.
4. Can you provide details about the market size?
The market size is estimated to be USD 31.37 billion as of 2022.
5. What are some drivers contributing to market growth?
N/A
6. What are the notable trends driving market growth?
N/A
7. Are there any restraints impacting market growth?
N/A
8. Can you provide examples of recent developments in the market?
N/A
9. What pricing options are available for accessing the report?
Pricing options include single-user, multi-user, and enterprise licenses priced at USD 3950.00, USD 5925.00, and USD 7900.00 respectively.
10. Is the market size provided in terms of value or volume?
The market size is provided in terms of value, measured in billion and volume, measured in K.
11. Are there any specific market keywords associated with the report?
Yes, the market keyword associated with the report is "Gaming Console," which aids in identifying and referencing the specific market segment covered.
12. How do I determine which pricing option suits my needs best?
The pricing options vary based on user requirements and access needs. Individual users may opt for single-user licenses, while businesses requiring broader access may choose multi-user or enterprise licenses for cost-effective access to the report.
13. Are there any additional resources or data provided in the Gaming Console report?
While the report offers comprehensive insights, it's advisable to review the specific contents or supplementary materials provided to ascertain if additional resources or data are available.
14. How can I stay updated on further developments or reports in the Gaming Console?
To stay informed about further developments, trends, and reports in the Gaming Console, consider subscribing to industry newsletters, following relevant companies and organizations, or regularly checking reputable industry news sources and publications.
Methodology
Step 1 - Identification of Relevant Samples Size from Population Database


Step 2 - Approaches for Defining Global Market Size (Value, Volume* & Price*)

Note*: In applicable scenarios
Step 3 - Data Sources
Primary Research
- Web Analytics
- Survey Reports
- Research Institute
- Latest Research Reports
- Opinion Leaders
Secondary Research
- Annual Reports
- White Paper
- Latest Press Release
- Industry Association
- Paid Database
- Investor Presentations

Step 4 - Data Triangulation
Involves using different sources of information in order to increase the validity of a study
These sources are likely to be stakeholders in a program - participants, other researchers, program staff, other community members, and so on.
Then we put all data in single framework & apply various statistical tools to find out the dynamic on the market.
During the analysis stage, feedback from the stakeholder groups would be compared to determine areas of agreement as well as areas of divergence