

Key Insights
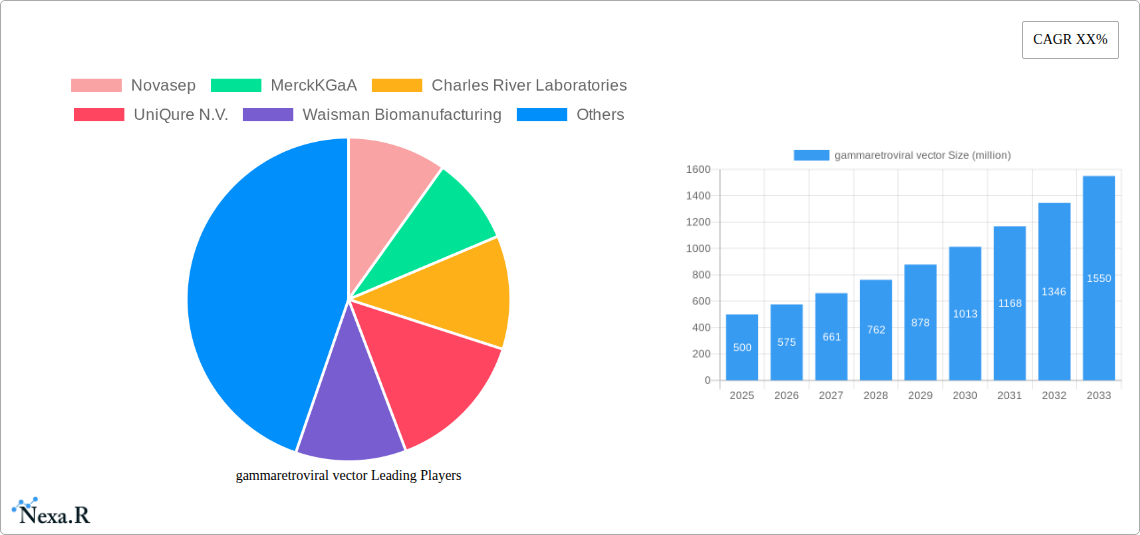
The gammaretroviral vector market is demonstrating substantial growth, propelled by the rising incidence of genetic disorders and the escalating demand for effective gene therapy solutions. Market expansion is further stimulated by ongoing innovations in gene editing technologies, such as CRISPR-Cas9, which significantly improve gene therapy precision and efficacy. Supportive regulatory landscapes and increased R&D investment in gene therapy also contribute to this growth. Leading companies, including Novasep, Merck KGaA, and Charles River Laboratories, are instrumental in developing and commercializing advanced gammaretroviral vector-based therapies, driving sector-wide competition and innovation. Market segmentation is anticipated to encompass vectors designed for specific therapeutic areas (e.g., oncology, immunodeficiency), manufacturing methodologies (viral production platforms), and delivery systems. Despite existing challenges such as potential safety concerns and high production costs, the market outlook is positive, driven by the potential for groundbreaking treatments for previously incurable diseases.
gammaretroviral vector Market Size (In Billion)
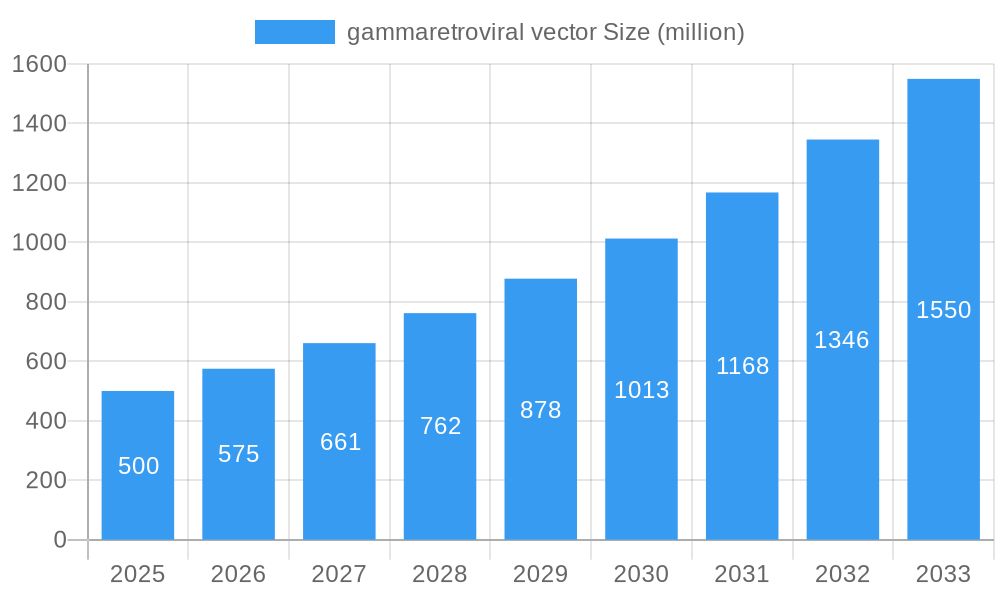
Significant market expansion is projected for the forecast period (2025-2033). The market is estimated to be worth $1.75 billion in the base year 2025, with an anticipated Compound Annual Growth Rate (CAGR) of 17.9%. Growth is expected to be particularly pronounced in regions with advanced healthcare infrastructure and strong research capabilities, notably North America and Europe. However, emerging economies will also witness market expansion as gene therapy becomes more accessible and affordable. Competition among key players is set to intensify as companies focus on enhancing vector design, manufacturing processes, and clinical outcomes, ultimately benefiting patients requiring innovative gene therapies.
gammaretroviral vector Company Market Share
Gammaretroviral Vector Market Report: 2019-2033
This comprehensive report provides a detailed analysis of the gammaretroviral vector market, encompassing market dynamics, growth trends, regional segmentation, product landscape, key players, and future outlook. The study period spans from 2019 to 2033, with 2025 serving as the base and estimated year. The forecast period is 2025-2033, and the historical period covers 2019-2024. This report is crucial for industry professionals, investors, and researchers seeking to understand and capitalize on opportunities within this rapidly evolving sector. The market size is projected to reach xx million units by 2033.
Gammaretroviral Vector Market Dynamics & Structure
The gammaretroviral vector market is characterized by a moderately concentrated landscape, with key players such as Novasep, Merck KGaA, and Charles River Laboratories holding significant market share. Technological innovation, particularly in gene editing and delivery systems, is a primary growth driver. Stringent regulatory frameworks, however, pose challenges to market expansion. Competitive pressure from alternative viral vectors and non-viral delivery methods exists. The end-user demographic comprises research institutions, pharmaceutical companies, and biotechnology firms engaged in gene therapy development. A moderate level of M&A activity has been observed in recent years, with xx deals recorded between 2019 and 2024, driving consolidation within the industry.
- Market Concentration: Moderately concentrated, with top 5 players holding approximately xx% market share in 2024.
- Technological Innovation: Focus on improving vector safety, efficacy, and targeting capabilities drives market growth.
- Regulatory Framework: Stringent regulatory approvals and guidelines influence market access and timelines.
- Competitive Substitutes: Lentiviral vectors, adeno-associated viruses (AAVs), and non-viral delivery methods represent competitive alternatives.
- End-User Demographics: Primarily research institutions (xx%), pharmaceutical companies (xx%), and biotechnology firms (xx%).
- M&A Trends: xx M&A deals recorded between 2019 and 2024, indicating consolidation trends.
Gammaretroviral Vector Growth Trends & Insights
The gammaretroviral vector market has experienced significant growth over the past few years, driven by increasing demand for gene therapy treatments and advancements in vector engineering. The market size grew from xx million units in 2019 to xx million units in 2024, registering a CAGR of xx%. Adoption rates have been increasing steadily across various therapeutic applications, particularly in oncology and inherited disorders. Technological disruptions, such as CRISPR-Cas9 gene editing and improved vector production methods, are further accelerating market expansion. Consumer behavior shifts towards personalized medicine and increased patient awareness of gene therapy are also contributing factors. The market is projected to maintain a healthy growth trajectory, reaching xx million units by 2033, with a forecasted CAGR of xx% during 2025-2033. Market penetration in key therapeutic areas is expected to increase significantly during this period, driven by successful clinical trials and regulatory approvals.
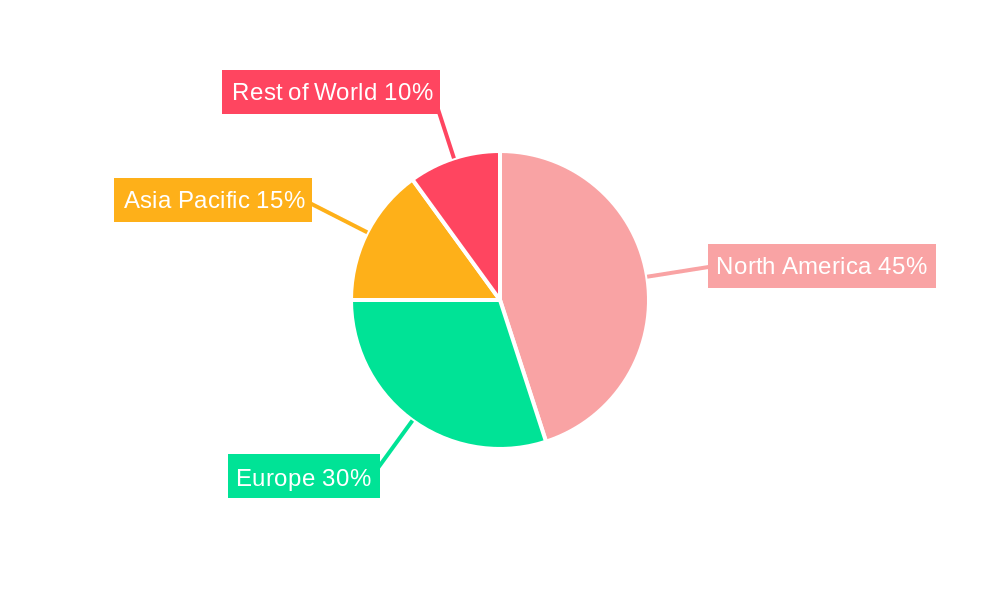
Dominant Regions, Countries, or Segments in Gammaretroviral Vector
North America currently dominates the gammaretroviral vector market, owing to robust research infrastructure, high healthcare expenditure, and the presence of major pharmaceutical and biotechnology companies. Europe and Asia-Pacific are also emerging as significant markets, with growth driven by rising investments in R&D, increasing awareness of gene therapy, and supportive government policies. The oncology segment holds the largest market share, driven by the significant unmet medical need in cancer treatment.
- North America: High R&D spending, established biotechnology clusters, and strong regulatory support drive market dominance.
- Europe: Growing investments in gene therapy research and development contribute to market growth.
- Asia-Pacific: Expanding healthcare infrastructure, rising disposable incomes, and increasing awareness of gene therapy fuel market expansion.
- Oncology Segment: Largest market share due to high prevalence of cancer and unmet medical needs.
Gammaretroviral Vector Product Landscape
Gammaretroviral vectors are engineered for targeted gene delivery, offering various modifications to enhance safety and efficacy. Recent innovations include self-inactivating vectors (SIN), which minimize the risk of insertional mutagenesis, and vectors incorporating specific targeting sequences for improved tissue specificity. Performance metrics focus on transduction efficiency, vector stability, and immune response profiles. These improvements aim to achieve high efficacy with reduced side effects.
Key Drivers, Barriers & Challenges in Gammaretroviral Vector
Key Drivers:
- Growing demand for gene therapy treatments across various therapeutic areas.
- Technological advancements in vector engineering and gene editing.
- Increasing investments in gene therapy research and development.
Challenges & Restraints:
- High production costs, limiting market accessibility.
- Stringent regulatory requirements and lengthy approval processes.
- Potential safety concerns associated with insertional mutagenesis.
- Competition from alternative viral and non-viral delivery systems. The competitive landscape may result in a xx% reduction in market growth if alternative solutions gain traction.
Emerging Opportunities in Gammaretroviral Vector
Untapped markets in developing countries present significant growth opportunities. Novel applications of gammaretroviral vectors, such as in-vivo gene editing for inherited disorders, offer promising avenues for market expansion. Emerging trends such as personalized medicine and advancements in vector engineering further contribute to growth prospects.
Growth Accelerators in the Gammaretroviral Vector Industry
Strategic collaborations between pharmaceutical companies, biotechnology firms, and research institutions are accelerating innovation and market penetration. Technological breakthroughs in vector engineering, such as the development of safer and more efficient vectors, are crucial for sustained growth. Expansion into new therapeutic areas and geographical regions contributes to market expansion.
Key Players Shaping the Gammaretroviral Vector Market
- Novasep
- Merck KGaA
- Charles River Laboratories
- UniQure N.V.
- Waisman Biomanufacturing
- Creative-Biogene
- Aldevron
- Addgene
- Oxford Biomedica
- Thermo Fisher Scientific Inc.
- Fujifilm Corporation
- Spark Therapeutics Inc
- ABL Inc
- Boehringer Ingelheim International GmbH
- Brammer Bio
- Creative Biogene
- General Electric
- Pfizer Inc
- Genezen
Notable Milestones in Gammaretroviral Vector Sector
- 2020: FDA approval of a gene therapy utilizing a gammaretroviral vector for a specific inherited disorder.
- 2022: Launch of a novel gammaretroviral vector platform technology by a leading biotechnology company.
- 2023: Successful completion of a Phase III clinical trial evaluating a gammaretroviral vector-based gene therapy for cancer.
In-Depth Gammaretroviral Vector Market Outlook
The gammaretroviral vector market is poised for continued growth, driven by the increasing adoption of gene therapy across various therapeutic areas, ongoing technological advancements, and strategic collaborations within the industry. The market's future potential is significant, with substantial opportunities for growth in emerging markets and novel applications. Strategic investments in R&D and expansion into new therapeutic areas will be critical for long-term success.
gammaretroviral vector Segmentation
-
1. Application
- 1.1. Gene Therapy
- 1.2. Vaccinology
- 1.3. Other
-
2. Types
- 2.1. Lentiviral Vectors
- 2.2. Adenoviral Vectors
- 2.3. Adeno-Associated Viral Vectors
- 2.4. Other
gammaretroviral vector Segmentation By Geography
-
1. North America
- 1.1. United States
- 1.2. Canada
- 1.3. Mexico
-
2. South America
- 2.1. Brazil
- 2.2. Argentina
- 2.3. Rest of South America
-
3. Europe
- 3.1. United Kingdom
- 3.2. Germany
- 3.3. France
- 3.4. Italy
- 3.5. Spain
- 3.6. Russia
- 3.7. Benelux
- 3.8. Nordics
- 3.9. Rest of Europe
-
4. Middle East & Africa
- 4.1. Turkey
- 4.2. Israel
- 4.3. GCC
- 4.4. North Africa
- 4.5. South Africa
- 4.6. Rest of Middle East & Africa
-
5. Asia Pacific
- 5.1. China
- 5.2. India
- 5.3. Japan
- 5.4. South Korea
- 5.5. ASEAN
- 5.6. Oceania
- 5.7. Rest of Asia Pacific
gammaretroviral vector Regional Market Share
Geographic Coverage of gammaretroviral vector
gammaretroviral vector REPORT HIGHLIGHTS
| Aspects | Details |
|---|---|
| Study Period | 2020-2034 |
| Base Year | 2025 |
| Estimated Year | 2026 |
| Forecast Period | 2026-2034 |
| Historical Period | 2020-2025 |
| Growth Rate | CAGR of 17.9% from 2020-2034 |
| Segmentation |
|
Table of Contents
- 1. Introduction
- 1.1. Research Scope
- 1.2. Market Segmentation
- 1.3. Research Methodology
- 1.4. Definitions and Assumptions
- 2. Executive Summary
- 2.1. Introduction
- 3. Market Dynamics
- 3.1. Introduction
- 3.2. Market Drivers
- 3.3. Market Restrains
- 3.4. Market Trends
- 4. Market Factor Analysis
- 4.1. Porters Five Forces
- 4.2. Supply/Value Chain
- 4.3. PESTEL analysis
- 4.4. Market Entropy
- 4.5. Patent/Trademark Analysis
- 5. Global gammaretroviral vector Analysis, Insights and Forecast, 2020-2032
- 5.1. Market Analysis, Insights and Forecast - by Application
- 5.1.1. Gene Therapy
- 5.1.2. Vaccinology
- 5.1.3. Other
- 5.2. Market Analysis, Insights and Forecast - by Types
- 5.2.1. Lentiviral Vectors
- 5.2.2. Adenoviral Vectors
- 5.2.3. Adeno-Associated Viral Vectors
- 5.2.4. Other
- 5.3. Market Analysis, Insights and Forecast - by Region
- 5.3.1. North America
- 5.3.2. South America
- 5.3.3. Europe
- 5.3.4. Middle East & Africa
- 5.3.5. Asia Pacific
- 5.1. Market Analysis, Insights and Forecast - by Application
- 6. North America gammaretroviral vector Analysis, Insights and Forecast, 2020-2032
- 6.1. Market Analysis, Insights and Forecast - by Application
- 6.1.1. Gene Therapy
- 6.1.2. Vaccinology
- 6.1.3. Other
- 6.2. Market Analysis, Insights and Forecast - by Types
- 6.2.1. Lentiviral Vectors
- 6.2.2. Adenoviral Vectors
- 6.2.3. Adeno-Associated Viral Vectors
- 6.2.4. Other
- 6.1. Market Analysis, Insights and Forecast - by Application
- 7. South America gammaretroviral vector Analysis, Insights and Forecast, 2020-2032
- 7.1. Market Analysis, Insights and Forecast - by Application
- 7.1.1. Gene Therapy
- 7.1.2. Vaccinology
- 7.1.3. Other
- 7.2. Market Analysis, Insights and Forecast - by Types
- 7.2.1. Lentiviral Vectors
- 7.2.2. Adenoviral Vectors
- 7.2.3. Adeno-Associated Viral Vectors
- 7.2.4. Other
- 7.1. Market Analysis, Insights and Forecast - by Application
- 8. Europe gammaretroviral vector Analysis, Insights and Forecast, 2020-2032
- 8.1. Market Analysis, Insights and Forecast - by Application
- 8.1.1. Gene Therapy
- 8.1.2. Vaccinology
- 8.1.3. Other
- 8.2. Market Analysis, Insights and Forecast - by Types
- 8.2.1. Lentiviral Vectors
- 8.2.2. Adenoviral Vectors
- 8.2.3. Adeno-Associated Viral Vectors
- 8.2.4. Other
- 8.1. Market Analysis, Insights and Forecast - by Application
- 9. Middle East & Africa gammaretroviral vector Analysis, Insights and Forecast, 2020-2032
- 9.1. Market Analysis, Insights and Forecast - by Application
- 9.1.1. Gene Therapy
- 9.1.2. Vaccinology
- 9.1.3. Other
- 9.2. Market Analysis, Insights and Forecast - by Types
- 9.2.1. Lentiviral Vectors
- 9.2.2. Adenoviral Vectors
- 9.2.3. Adeno-Associated Viral Vectors
- 9.2.4. Other
- 9.1. Market Analysis, Insights and Forecast - by Application
- 10. Asia Pacific gammaretroviral vector Analysis, Insights and Forecast, 2020-2032
- 10.1. Market Analysis, Insights and Forecast - by Application
- 10.1.1. Gene Therapy
- 10.1.2. Vaccinology
- 10.1.3. Other
- 10.2. Market Analysis, Insights and Forecast - by Types
- 10.2.1. Lentiviral Vectors
- 10.2.2. Adenoviral Vectors
- 10.2.3. Adeno-Associated Viral Vectors
- 10.2.4. Other
- 10.1. Market Analysis, Insights and Forecast - by Application
- 11. Competitive Analysis
- 11.1. Global Market Share Analysis 2025
- 11.2. Company Profiles
- 11.2.1 Novasep
- 11.2.1.1. Overview
- 11.2.1.2. Products
- 11.2.1.3. SWOT Analysis
- 11.2.1.4. Recent Developments
- 11.2.1.5. Financials (Based on Availability)
- 11.2.2 MerckKGaA
- 11.2.2.1. Overview
- 11.2.2.2. Products
- 11.2.2.3. SWOT Analysis
- 11.2.2.4. Recent Developments
- 11.2.2.5. Financials (Based on Availability)
- 11.2.3 Charles River Laboratories
- 11.2.3.1. Overview
- 11.2.3.2. Products
- 11.2.3.3. SWOT Analysis
- 11.2.3.4. Recent Developments
- 11.2.3.5. Financials (Based on Availability)
- 11.2.4 UniQure N.V.
- 11.2.4.1. Overview
- 11.2.4.2. Products
- 11.2.4.3. SWOT Analysis
- 11.2.4.4. Recent Developments
- 11.2.4.5. Financials (Based on Availability)
- 11.2.5 Waisman Biomanufacturing
- 11.2.5.1. Overview
- 11.2.5.2. Products
- 11.2.5.3. SWOT Analysis
- 11.2.5.4. Recent Developments
- 11.2.5.5. Financials (Based on Availability)
- 11.2.6 Creative-Biogene
- 11.2.6.1. Overview
- 11.2.6.2. Products
- 11.2.6.3. SWOT Analysis
- 11.2.6.4. Recent Developments
- 11.2.6.5. Financials (Based on Availability)
- 11.2.7 Aldevron
- 11.2.7.1. Overview
- 11.2.7.2. Products
- 11.2.7.3. SWOT Analysis
- 11.2.7.4. Recent Developments
- 11.2.7.5. Financials (Based on Availability)
- 11.2.8 Addgene
- 11.2.8.1. Overview
- 11.2.8.2. Products
- 11.2.8.3. SWOT Analysis
- 11.2.8.4. Recent Developments
- 11.2.8.5. Financials (Based on Availability)
- 11.2.9 Oxford Biomedica
- 11.2.9.1. Overview
- 11.2.9.2. Products
- 11.2.9.3. SWOT Analysis
- 11.2.9.4. Recent Developments
- 11.2.9.5. Financials (Based on Availability)
- 11.2.10 Thermo Fisher Scientific Inc.
- 11.2.10.1. Overview
- 11.2.10.2. Products
- 11.2.10.3. SWOT Analysis
- 11.2.10.4. Recent Developments
- 11.2.10.5. Financials (Based on Availability)
- 11.2.11 Fujifilm Corporation
- 11.2.11.1. Overview
- 11.2.11.2. Products
- 11.2.11.3. SWOT Analysis
- 11.2.11.4. Recent Developments
- 11.2.11.5. Financials (Based on Availability)
- 11.2.12 Spark Therapeutics Inc
- 11.2.12.1. Overview
- 11.2.12.2. Products
- 11.2.12.3. SWOT Analysis
- 11.2.12.4. Recent Developments
- 11.2.12.5. Financials (Based on Availability)
- 11.2.13 ABL Inc
- 11.2.13.1. Overview
- 11.2.13.2. Products
- 11.2.13.3. SWOT Analysis
- 11.2.13.4. Recent Developments
- 11.2.13.5. Financials (Based on Availability)
- 11.2.14 Boehringer Ingelheim International GmbH
- 11.2.14.1. Overview
- 11.2.14.2. Products
- 11.2.14.3. SWOT Analysis
- 11.2.14.4. Recent Developments
- 11.2.14.5. Financials (Based on Availability)
- 11.2.15 Brammer Bio
- 11.2.15.1. Overview
- 11.2.15.2. Products
- 11.2.15.3. SWOT Analysis
- 11.2.15.4. Recent Developments
- 11.2.15.5. Financials (Based on Availability)
- 11.2.16 Creative Biogene
- 11.2.16.1. Overview
- 11.2.16.2. Products
- 11.2.16.3. SWOT Analysis
- 11.2.16.4. Recent Developments
- 11.2.16.5. Financials (Based on Availability)
- 11.2.17 General Electric
- 11.2.17.1. Overview
- 11.2.17.2. Products
- 11.2.17.3. SWOT Analysis
- 11.2.17.4. Recent Developments
- 11.2.17.5. Financials (Based on Availability)
- 11.2.18 Pfizer Inc
- 11.2.18.1. Overview
- 11.2.18.2. Products
- 11.2.18.3. SWOT Analysis
- 11.2.18.4. Recent Developments
- 11.2.18.5. Financials (Based on Availability)
- 11.2.19 Genezen
- 11.2.19.1. Overview
- 11.2.19.2. Products
- 11.2.19.3. SWOT Analysis
- 11.2.19.4. Recent Developments
- 11.2.19.5. Financials (Based on Availability)
- 11.2.1 Novasep
List of Figures
- Figure 1: Global gammaretroviral vector Revenue Breakdown (billion, %) by Region 2025 & 2033
- Figure 2: Global gammaretroviral vector Volume Breakdown (K, %) by Region 2025 & 2033
- Figure 3: North America gammaretroviral vector Revenue (billion), by Application 2025 & 2033
- Figure 4: North America gammaretroviral vector Volume (K), by Application 2025 & 2033
- Figure 5: North America gammaretroviral vector Revenue Share (%), by Application 2025 & 2033
- Figure 6: North America gammaretroviral vector Volume Share (%), by Application 2025 & 2033
- Figure 7: North America gammaretroviral vector Revenue (billion), by Types 2025 & 2033
- Figure 8: North America gammaretroviral vector Volume (K), by Types 2025 & 2033
- Figure 9: North America gammaretroviral vector Revenue Share (%), by Types 2025 & 2033
- Figure 10: North America gammaretroviral vector Volume Share (%), by Types 2025 & 2033
- Figure 11: North America gammaretroviral vector Revenue (billion), by Country 2025 & 2033
- Figure 12: North America gammaretroviral vector Volume (K), by Country 2025 & 2033
- Figure 13: North America gammaretroviral vector Revenue Share (%), by Country 2025 & 2033
- Figure 14: North America gammaretroviral vector Volume Share (%), by Country 2025 & 2033
- Figure 15: South America gammaretroviral vector Revenue (billion), by Application 2025 & 2033
- Figure 16: South America gammaretroviral vector Volume (K), by Application 2025 & 2033
- Figure 17: South America gammaretroviral vector Revenue Share (%), by Application 2025 & 2033
- Figure 18: South America gammaretroviral vector Volume Share (%), by Application 2025 & 2033
- Figure 19: South America gammaretroviral vector Revenue (billion), by Types 2025 & 2033
- Figure 20: South America gammaretroviral vector Volume (K), by Types 2025 & 2033
- Figure 21: South America gammaretroviral vector Revenue Share (%), by Types 2025 & 2033
- Figure 22: South America gammaretroviral vector Volume Share (%), by Types 2025 & 2033
- Figure 23: South America gammaretroviral vector Revenue (billion), by Country 2025 & 2033
- Figure 24: South America gammaretroviral vector Volume (K), by Country 2025 & 2033
- Figure 25: South America gammaretroviral vector Revenue Share (%), by Country 2025 & 2033
- Figure 26: South America gammaretroviral vector Volume Share (%), by Country 2025 & 2033
- Figure 27: Europe gammaretroviral vector Revenue (billion), by Application 2025 & 2033
- Figure 28: Europe gammaretroviral vector Volume (K), by Application 2025 & 2033
- Figure 29: Europe gammaretroviral vector Revenue Share (%), by Application 2025 & 2033
- Figure 30: Europe gammaretroviral vector Volume Share (%), by Application 2025 & 2033
- Figure 31: Europe gammaretroviral vector Revenue (billion), by Types 2025 & 2033
- Figure 32: Europe gammaretroviral vector Volume (K), by Types 2025 & 2033
- Figure 33: Europe gammaretroviral vector Revenue Share (%), by Types 2025 & 2033
- Figure 34: Europe gammaretroviral vector Volume Share (%), by Types 2025 & 2033
- Figure 35: Europe gammaretroviral vector Revenue (billion), by Country 2025 & 2033
- Figure 36: Europe gammaretroviral vector Volume (K), by Country 2025 & 2033
- Figure 37: Europe gammaretroviral vector Revenue Share (%), by Country 2025 & 2033
- Figure 38: Europe gammaretroviral vector Volume Share (%), by Country 2025 & 2033
- Figure 39: Middle East & Africa gammaretroviral vector Revenue (billion), by Application 2025 & 2033
- Figure 40: Middle East & Africa gammaretroviral vector Volume (K), by Application 2025 & 2033
- Figure 41: Middle East & Africa gammaretroviral vector Revenue Share (%), by Application 2025 & 2033
- Figure 42: Middle East & Africa gammaretroviral vector Volume Share (%), by Application 2025 & 2033
- Figure 43: Middle East & Africa gammaretroviral vector Revenue (billion), by Types 2025 & 2033
- Figure 44: Middle East & Africa gammaretroviral vector Volume (K), by Types 2025 & 2033
- Figure 45: Middle East & Africa gammaretroviral vector Revenue Share (%), by Types 2025 & 2033
- Figure 46: Middle East & Africa gammaretroviral vector Volume Share (%), by Types 2025 & 2033
- Figure 47: Middle East & Africa gammaretroviral vector Revenue (billion), by Country 2025 & 2033
- Figure 48: Middle East & Africa gammaretroviral vector Volume (K), by Country 2025 & 2033
- Figure 49: Middle East & Africa gammaretroviral vector Revenue Share (%), by Country 2025 & 2033
- Figure 50: Middle East & Africa gammaretroviral vector Volume Share (%), by Country 2025 & 2033
- Figure 51: Asia Pacific gammaretroviral vector Revenue (billion), by Application 2025 & 2033
- Figure 52: Asia Pacific gammaretroviral vector Volume (K), by Application 2025 & 2033
- Figure 53: Asia Pacific gammaretroviral vector Revenue Share (%), by Application 2025 & 2033
- Figure 54: Asia Pacific gammaretroviral vector Volume Share (%), by Application 2025 & 2033
- Figure 55: Asia Pacific gammaretroviral vector Revenue (billion), by Types 2025 & 2033
- Figure 56: Asia Pacific gammaretroviral vector Volume (K), by Types 2025 & 2033
- Figure 57: Asia Pacific gammaretroviral vector Revenue Share (%), by Types 2025 & 2033
- Figure 58: Asia Pacific gammaretroviral vector Volume Share (%), by Types 2025 & 2033
- Figure 59: Asia Pacific gammaretroviral vector Revenue (billion), by Country 2025 & 2033
- Figure 60: Asia Pacific gammaretroviral vector Volume (K), by Country 2025 & 2033
- Figure 61: Asia Pacific gammaretroviral vector Revenue Share (%), by Country 2025 & 2033
- Figure 62: Asia Pacific gammaretroviral vector Volume Share (%), by Country 2025 & 2033
List of Tables
- Table 1: Global gammaretroviral vector Revenue billion Forecast, by Application 2020 & 2033
- Table 2: Global gammaretroviral vector Volume K Forecast, by Application 2020 & 2033
- Table 3: Global gammaretroviral vector Revenue billion Forecast, by Types 2020 & 2033
- Table 4: Global gammaretroviral vector Volume K Forecast, by Types 2020 & 2033
- Table 5: Global gammaretroviral vector Revenue billion Forecast, by Region 2020 & 2033
- Table 6: Global gammaretroviral vector Volume K Forecast, by Region 2020 & 2033
- Table 7: Global gammaretroviral vector Revenue billion Forecast, by Application 2020 & 2033
- Table 8: Global gammaretroviral vector Volume K Forecast, by Application 2020 & 2033
- Table 9: Global gammaretroviral vector Revenue billion Forecast, by Types 2020 & 2033
- Table 10: Global gammaretroviral vector Volume K Forecast, by Types 2020 & 2033
- Table 11: Global gammaretroviral vector Revenue billion Forecast, by Country 2020 & 2033
- Table 12: Global gammaretroviral vector Volume K Forecast, by Country 2020 & 2033
- Table 13: United States gammaretroviral vector Revenue (billion) Forecast, by Application 2020 & 2033
- Table 14: United States gammaretroviral vector Volume (K) Forecast, by Application 2020 & 2033
- Table 15: Canada gammaretroviral vector Revenue (billion) Forecast, by Application 2020 & 2033
- Table 16: Canada gammaretroviral vector Volume (K) Forecast, by Application 2020 & 2033
- Table 17: Mexico gammaretroviral vector Revenue (billion) Forecast, by Application 2020 & 2033
- Table 18: Mexico gammaretroviral vector Volume (K) Forecast, by Application 2020 & 2033
- Table 19: Global gammaretroviral vector Revenue billion Forecast, by Application 2020 & 2033
- Table 20: Global gammaretroviral vector Volume K Forecast, by Application 2020 & 2033
- Table 21: Global gammaretroviral vector Revenue billion Forecast, by Types 2020 & 2033
- Table 22: Global gammaretroviral vector Volume K Forecast, by Types 2020 & 2033
- Table 23: Global gammaretroviral vector Revenue billion Forecast, by Country 2020 & 2033
- Table 24: Global gammaretroviral vector Volume K Forecast, by Country 2020 & 2033
- Table 25: Brazil gammaretroviral vector Revenue (billion) Forecast, by Application 2020 & 2033
- Table 26: Brazil gammaretroviral vector Volume (K) Forecast, by Application 2020 & 2033
- Table 27: Argentina gammaretroviral vector Revenue (billion) Forecast, by Application 2020 & 2033
- Table 28: Argentina gammaretroviral vector Volume (K) Forecast, by Application 2020 & 2033
- Table 29: Rest of South America gammaretroviral vector Revenue (billion) Forecast, by Application 2020 & 2033
- Table 30: Rest of South America gammaretroviral vector Volume (K) Forecast, by Application 2020 & 2033
- Table 31: Global gammaretroviral vector Revenue billion Forecast, by Application 2020 & 2033
- Table 32: Global gammaretroviral vector Volume K Forecast, by Application 2020 & 2033
- Table 33: Global gammaretroviral vector Revenue billion Forecast, by Types 2020 & 2033
- Table 34: Global gammaretroviral vector Volume K Forecast, by Types 2020 & 2033
- Table 35: Global gammaretroviral vector Revenue billion Forecast, by Country 2020 & 2033
- Table 36: Global gammaretroviral vector Volume K Forecast, by Country 2020 & 2033
- Table 37: United Kingdom gammaretroviral vector Revenue (billion) Forecast, by Application 2020 & 2033
- Table 38: United Kingdom gammaretroviral vector Volume (K) Forecast, by Application 2020 & 2033
- Table 39: Germany gammaretroviral vector Revenue (billion) Forecast, by Application 2020 & 2033
- Table 40: Germany gammaretroviral vector Volume (K) Forecast, by Application 2020 & 2033
- Table 41: France gammaretroviral vector Revenue (billion) Forecast, by Application 2020 & 2033
- Table 42: France gammaretroviral vector Volume (K) Forecast, by Application 2020 & 2033
- Table 43: Italy gammaretroviral vector Revenue (billion) Forecast, by Application 2020 & 2033
- Table 44: Italy gammaretroviral vector Volume (K) Forecast, by Application 2020 & 2033
- Table 45: Spain gammaretroviral vector Revenue (billion) Forecast, by Application 2020 & 2033
- Table 46: Spain gammaretroviral vector Volume (K) Forecast, by Application 2020 & 2033
- Table 47: Russia gammaretroviral vector Revenue (billion) Forecast, by Application 2020 & 2033
- Table 48: Russia gammaretroviral vector Volume (K) Forecast, by Application 2020 & 2033
- Table 49: Benelux gammaretroviral vector Revenue (billion) Forecast, by Application 2020 & 2033
- Table 50: Benelux gammaretroviral vector Volume (K) Forecast, by Application 2020 & 2033
- Table 51: Nordics gammaretroviral vector Revenue (billion) Forecast, by Application 2020 & 2033
- Table 52: Nordics gammaretroviral vector Volume (K) Forecast, by Application 2020 & 2033
- Table 53: Rest of Europe gammaretroviral vector Revenue (billion) Forecast, by Application 2020 & 2033
- Table 54: Rest of Europe gammaretroviral vector Volume (K) Forecast, by Application 2020 & 2033
- Table 55: Global gammaretroviral vector Revenue billion Forecast, by Application 2020 & 2033
- Table 56: Global gammaretroviral vector Volume K Forecast, by Application 2020 & 2033
- Table 57: Global gammaretroviral vector Revenue billion Forecast, by Types 2020 & 2033
- Table 58: Global gammaretroviral vector Volume K Forecast, by Types 2020 & 2033
- Table 59: Global gammaretroviral vector Revenue billion Forecast, by Country 2020 & 2033
- Table 60: Global gammaretroviral vector Volume K Forecast, by Country 2020 & 2033
- Table 61: Turkey gammaretroviral vector Revenue (billion) Forecast, by Application 2020 & 2033
- Table 62: Turkey gammaretroviral vector Volume (K) Forecast, by Application 2020 & 2033
- Table 63: Israel gammaretroviral vector Revenue (billion) Forecast, by Application 2020 & 2033
- Table 64: Israel gammaretroviral vector Volume (K) Forecast, by Application 2020 & 2033
- Table 65: GCC gammaretroviral vector Revenue (billion) Forecast, by Application 2020 & 2033
- Table 66: GCC gammaretroviral vector Volume (K) Forecast, by Application 2020 & 2033
- Table 67: North Africa gammaretroviral vector Revenue (billion) Forecast, by Application 2020 & 2033
- Table 68: North Africa gammaretroviral vector Volume (K) Forecast, by Application 2020 & 2033
- Table 69: South Africa gammaretroviral vector Revenue (billion) Forecast, by Application 2020 & 2033
- Table 70: South Africa gammaretroviral vector Volume (K) Forecast, by Application 2020 & 2033
- Table 71: Rest of Middle East & Africa gammaretroviral vector Revenue (billion) Forecast, by Application 2020 & 2033
- Table 72: Rest of Middle East & Africa gammaretroviral vector Volume (K) Forecast, by Application 2020 & 2033
- Table 73: Global gammaretroviral vector Revenue billion Forecast, by Application 2020 & 2033
- Table 74: Global gammaretroviral vector Volume K Forecast, by Application 2020 & 2033
- Table 75: Global gammaretroviral vector Revenue billion Forecast, by Types 2020 & 2033
- Table 76: Global gammaretroviral vector Volume K Forecast, by Types 2020 & 2033
- Table 77: Global gammaretroviral vector Revenue billion Forecast, by Country 2020 & 2033
- Table 78: Global gammaretroviral vector Volume K Forecast, by Country 2020 & 2033
- Table 79: China gammaretroviral vector Revenue (billion) Forecast, by Application 2020 & 2033
- Table 80: China gammaretroviral vector Volume (K) Forecast, by Application 2020 & 2033
- Table 81: India gammaretroviral vector Revenue (billion) Forecast, by Application 2020 & 2033
- Table 82: India gammaretroviral vector Volume (K) Forecast, by Application 2020 & 2033
- Table 83: Japan gammaretroviral vector Revenue (billion) Forecast, by Application 2020 & 2033
- Table 84: Japan gammaretroviral vector Volume (K) Forecast, by Application 2020 & 2033
- Table 85: South Korea gammaretroviral vector Revenue (billion) Forecast, by Application 2020 & 2033
- Table 86: South Korea gammaretroviral vector Volume (K) Forecast, by Application 2020 & 2033
- Table 87: ASEAN gammaretroviral vector Revenue (billion) Forecast, by Application 2020 & 2033
- Table 88: ASEAN gammaretroviral vector Volume (K) Forecast, by Application 2020 & 2033
- Table 89: Oceania gammaretroviral vector Revenue (billion) Forecast, by Application 2020 & 2033
- Table 90: Oceania gammaretroviral vector Volume (K) Forecast, by Application 2020 & 2033
- Table 91: Rest of Asia Pacific gammaretroviral vector Revenue (billion) Forecast, by Application 2020 & 2033
- Table 92: Rest of Asia Pacific gammaretroviral vector Volume (K) Forecast, by Application 2020 & 2033
Frequently Asked Questions
1. What is the projected Compound Annual Growth Rate (CAGR) of the gammaretroviral vector?
The projected CAGR is approximately 17.9%.
2. Which companies are prominent players in the gammaretroviral vector?
Key companies in the market include Novasep, MerckKGaA, Charles River Laboratories, UniQure N.V., Waisman Biomanufacturing, Creative-Biogene, Aldevron, Addgene, Oxford Biomedica, Thermo Fisher Scientific Inc., Fujifilm Corporation, Spark Therapeutics Inc, ABL Inc, Boehringer Ingelheim International GmbH, Brammer Bio, Creative Biogene, General Electric, Pfizer Inc, Genezen.
3. What are the main segments of the gammaretroviral vector?
The market segments include Application, Types.
4. Can you provide details about the market size?
The market size is estimated to be USD 1.75 billion as of 2022.
5. What are some drivers contributing to market growth?
N/A
6. What are the notable trends driving market growth?
N/A
7. Are there any restraints impacting market growth?
N/A
8. Can you provide examples of recent developments in the market?
N/A
9. What pricing options are available for accessing the report?
Pricing options include single-user, multi-user, and enterprise licenses priced at USD 4350.00, USD 6525.00, and USD 8700.00 respectively.
10. Is the market size provided in terms of value or volume?
The market size is provided in terms of value, measured in billion and volume, measured in K.
11. Are there any specific market keywords associated with the report?
Yes, the market keyword associated with the report is "gammaretroviral vector," which aids in identifying and referencing the specific market segment covered.
12. How do I determine which pricing option suits my needs best?
The pricing options vary based on user requirements and access needs. Individual users may opt for single-user licenses, while businesses requiring broader access may choose multi-user or enterprise licenses for cost-effective access to the report.
13. Are there any additional resources or data provided in the gammaretroviral vector report?
While the report offers comprehensive insights, it's advisable to review the specific contents or supplementary materials provided to ascertain if additional resources or data are available.
14. How can I stay updated on further developments or reports in the gammaretroviral vector?
To stay informed about further developments, trends, and reports in the gammaretroviral vector, consider subscribing to industry newsletters, following relevant companies and organizations, or regularly checking reputable industry news sources and publications.
Methodology
Step 1 - Identification of Relevant Samples Size from Population Database


Step 2 - Approaches for Defining Global Market Size (Value, Volume* & Price*)

Note*: In applicable scenarios
Step 3 - Data Sources
Primary Research
- Web Analytics
- Survey Reports
- Research Institute
- Latest Research Reports
- Opinion Leaders
Secondary Research
- Annual Reports
- White Paper
- Latest Press Release
- Industry Association
- Paid Database
- Investor Presentations

Step 4 - Data Triangulation
Involves using different sources of information in order to increase the validity of a study
These sources are likely to be stakeholders in a program - participants, other researchers, program staff, other community members, and so on.
Then we put all data in single framework & apply various statistical tools to find out the dynamic on the market.
During the analysis stage, feedback from the stakeholder groups would be compared to determine areas of agreement as well as areas of divergence