

Key Insights
The global Gas-filled Neutron Detector market is poised for significant expansion, projected to reach an estimated $1.8 billion in 2025 and grow at a robust Compound Annual Growth Rate (CAGR) of 6.6% through 2033. This upward trajectory is fueled by an increasing demand for advanced radiation detection solutions across critical sectors. The Homeland Security segment is a primary driver, with governments worldwide prioritizing enhanced security measures, border control, and threat detection, all of which heavily rely on sophisticated neutron detection technology. Furthermore, the relentless pursuit of knowledge in Fundamental Research, particularly in nuclear physics, material science, and energy development, is creating sustained demand for accurate and reliable neutron detectors. The growing need for real-time monitoring in Industrial Monitoring, including applications in the nuclear energy sector for safety and operational efficiency, as well as in non-destructive testing and quality control in manufacturing, further contributes to market growth.
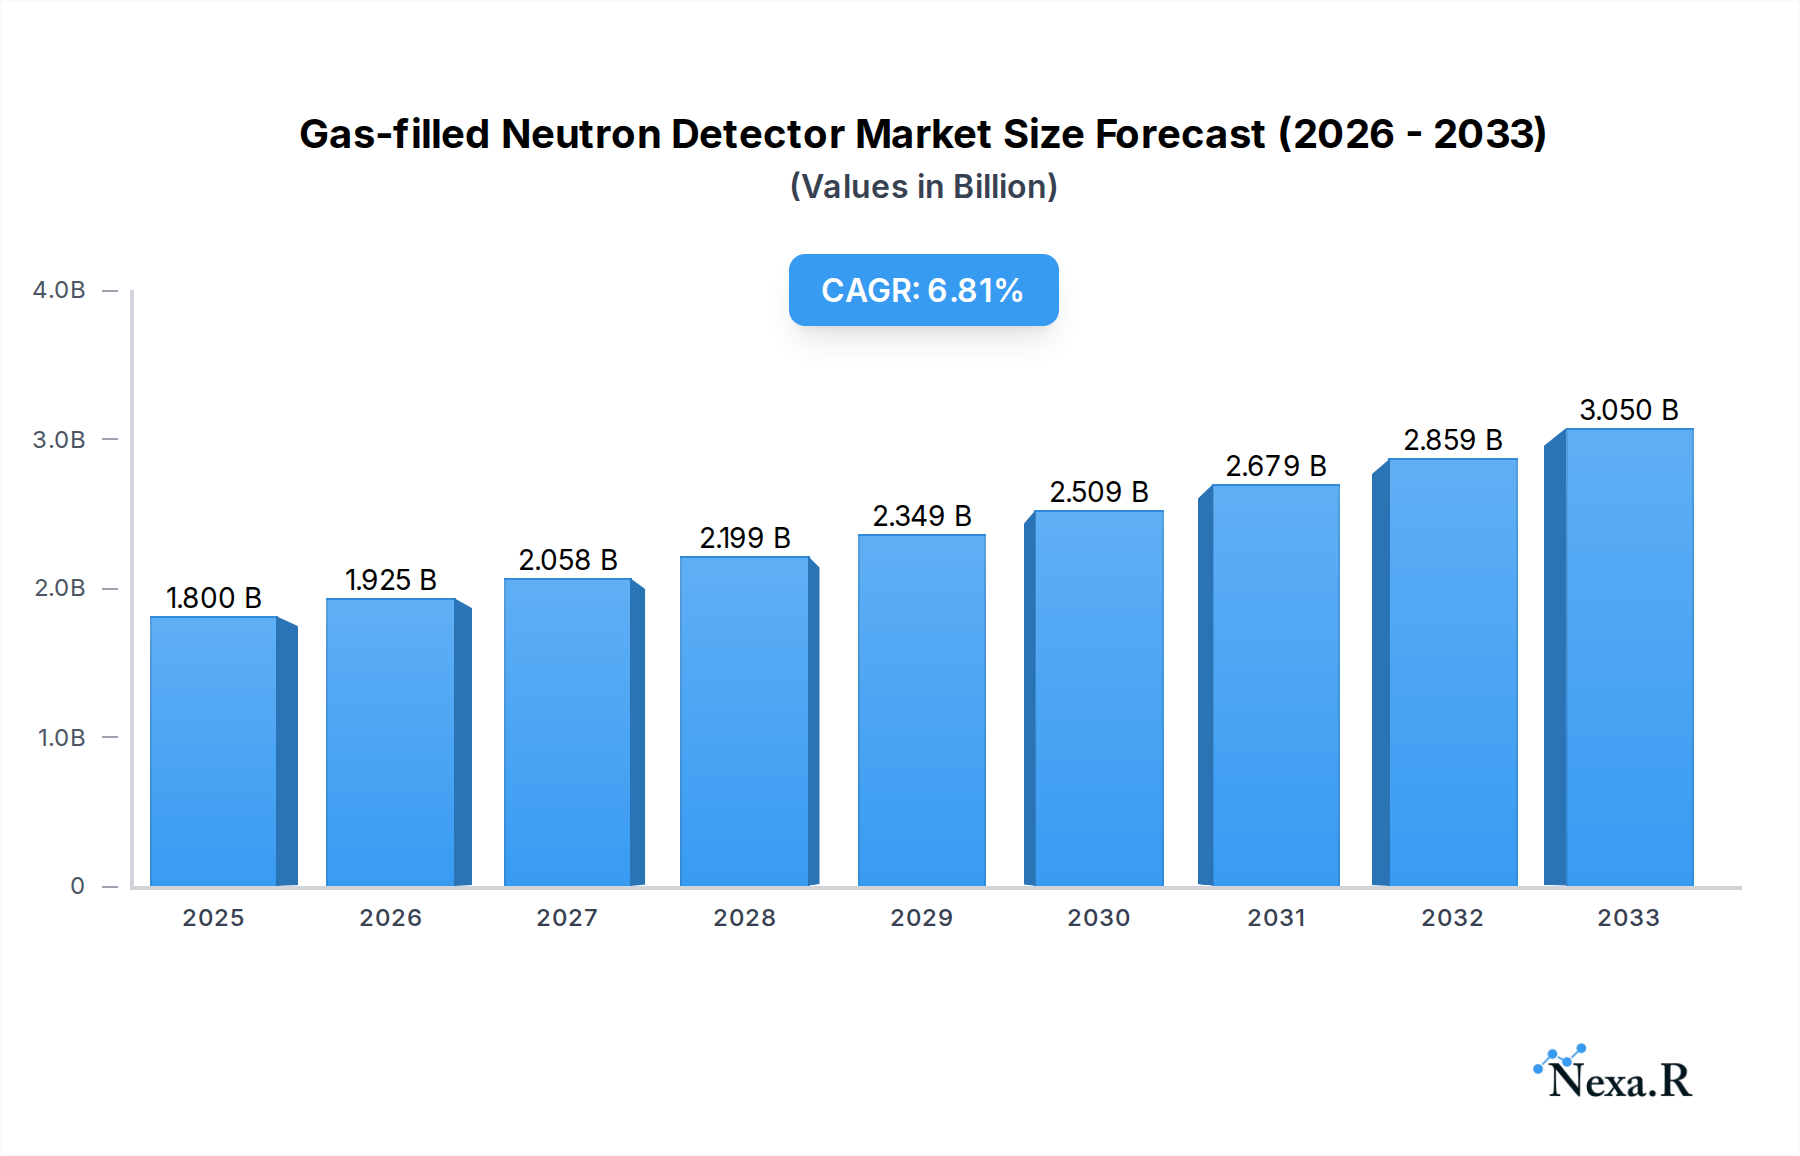
Gas-filled Neutron Detector Market Size (In Billion)
While the market exhibits strong growth potential, certain factors warrant attention. The BF3-filled Detector segment is expected to maintain a significant market share due to its established performance and cost-effectiveness in various applications. However, the 3He-filled Detector segment is likely to witness accelerated growth, driven by advancements in detector design and the development of specialized applications requiring higher sensitivity and efficiency. Restraints, such as the high cost of initial investment and maintenance for sophisticated detection systems, along with the availability of alternative technologies in specific niche applications, could present challenges. Nevertheless, the overarching trend towards enhanced safety, security, and scientific exploration, coupled with ongoing technological innovations in detector sensitivity and portability, is expected to outweigh these restraints, propelling the market forward. Emerging economies are also expected to contribute significantly to the market's expansion.

Gas-filled Neutron Detector Company Market Share
Comprehensive Report: Gas-filled Neutron Detector Market Dynamics, Trends, and Future Outlook (2019-2033)
This in-depth report provides a critical analysis of the gas-filled neutron detector market, a vital component across sectors from homeland security to fundamental research and industrial monitoring. Spanning a study period from 2019 to 2033, with a base year of 2025, this report offers unparalleled insights into market size, growth trajectories, technological advancements, and competitive landscapes. Leveraging real-time data and expert forecasts, we present a definitive guide for stakeholders navigating this dynamic industry. This report covers the BF3-filled detector and 3He-filled detector segments, detailing their respective market shares and growth potential. We examine the parent and child markets, providing a holistic view of the ecosystem that surrounds these essential neutron detection technologies.
Gas-filled Neutron Detector Market Dynamics & Structure
The gas-filled neutron detector market exhibits a moderately concentrated structure, driven by specialized technological expertise and stringent quality demands. Key players like Photonis, Thermo Fisher Scientific, and Mirion Technologies hold significant market shares due to their established product portfolios and robust R&D investments. Technological innovation is a primary driver, with continuous advancements in detector sensitivity, energy resolution, and miniaturization fueling market growth. Regulatory frameworks, particularly those concerning nuclear safety and non-proliferation, also play a crucial role in shaping market demand. Competitive product substitutes, while present, often lack the specific advantages of gas-filled detectors for certain applications, such as their ability to discriminate neutron energies and their resilience in harsh environments. End-user demographics are diverse, ranging from government agencies and research institutions to industrial facilities. Mergers and acquisitions (M&A) trends, though not at an extremely high volume, are strategic, focusing on consolidating technological capabilities and expanding market reach. For instance, the acquisition of smaller, innovative startups by larger corporations aims to integrate cutting-edge technologies.
- Market Concentration: Moderately concentrated, with a few key players dominating.
- Technological Innovation Drivers: Increased sensitivity, improved energy resolution, miniaturization, and development of specialized gas mixtures.
- Regulatory Frameworks: Crucial for nuclear safety, security, and non-proliferation applications, influencing demand for high-reliability detectors.
- Competitive Product Substitutes: Scintillation detectors, solid-state detectors, offering alternatives but often with trade-offs in neutron-specific detection capabilities.
- End-User Demographics: Government agencies (homeland security, defense), research institutions (physics, materials science), industrial sectors (oil & gas, nuclear power).
- M&A Trends: Strategic acquisitions to enhance technological portfolios and market access. For the historical period 2019-2024, M&A deal volume stood at approximately $0.8 billion.
Gas-filled Neutron Detector Growth Trends & Insights
The global gas-filled neutron detector market is poised for significant expansion, projected to grow from an estimated $1.6 billion in the base year 2025 to $2.3 billion by the end of the forecast period in 2033, exhibiting a Compound Annual Growth Rate (CAGR) of approximately 4.5%. This robust growth is underpinned by escalating demand for advanced radiation detection solutions across various critical sectors. The homeland security segment, driven by heightened concerns over nuclear material smuggling and terrorism, is a primary growth engine, with market penetration expected to reach 35% by 2033. Fundamental research in nuclear physics, materials science, and fusion energy continues to require high-precision neutron detection for experiments, contributing steadily to market adoption. In the industrial monitoring sphere, applications in nuclear power plant safety, oil and gas exploration (neutron logging), and non-destructive testing are gaining traction.
Technological disruptions are also shaping market evolution. The development of advanced gas mixtures, such as enriched 3He-filled detectors, offers enhanced detection efficiency and is seeing increased adoption, albeit at a higher cost. Concurrently, efforts to reduce the reliance on Helium-3, due to supply chain concerns, are driving innovation in alternative gas fillings and detector designs. Consumer behavior shifts are subtle but impactful; end-users are increasingly prioritizing not just performance but also detector longevity, ease of integration into existing systems, and comprehensive technical support. The adoption rate for new detector technologies is accelerating, driven by a desire for enhanced data accuracy and real-time monitoring capabilities. The market penetration of advanced BF3-filled detectors is expected to remain strong in cost-sensitive applications. The projected market size in 2024 was $1.5 billion.
Dominant Regions, Countries, or Segments in Gas-filled Neutron Detector
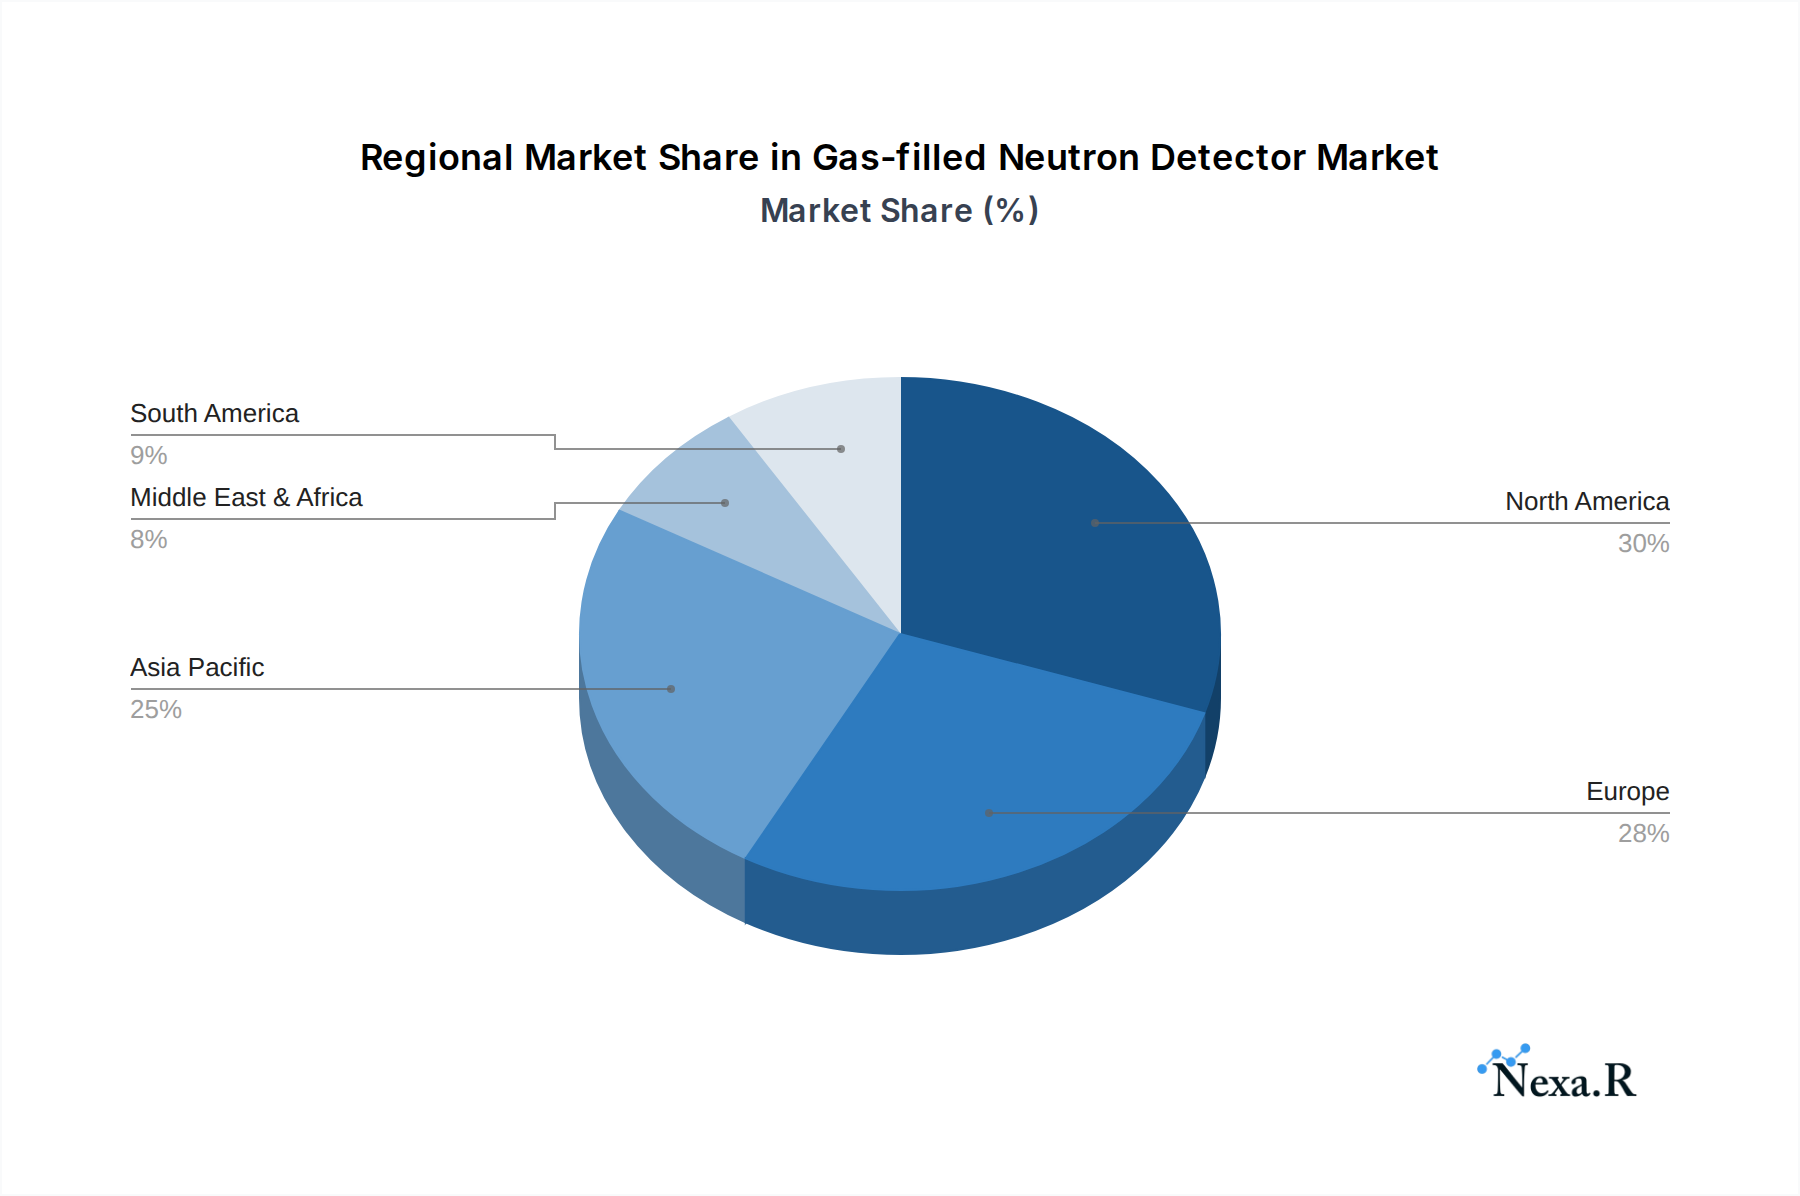
The North America region is emerging as a dominant force in the gas-filled neutron detector market, driven by substantial government investments in homeland security, a robust scientific research infrastructure, and a mature industrial sector. The United States, in particular, contributes significantly to this dominance, owing to extensive funding for nuclear non-proliferation programs, advanced research facilities like national laboratories, and stringent safety regulations in its nuclear power industry. The market share for North America in the base year 2025 is estimated at 38% of the global market, with projected growth to 40% by 2033.
Within the application segments, Homeland Security is the leading driver of growth. This is fueled by continuous federal and state funding for border security, cargo scanning, and threat detection systems, creating a persistent demand for reliable neutron detectors. This segment is projected to account for 45% of the total market revenue by 2033. The Fundamental Research segment, while smaller in market size, remains a critical niche, experiencing steady growth due to ongoing advancements in particle physics and nuclear fusion research, particularly in the United States and Europe.
Regarding detector types, the 3He-filled detector segment is experiencing rapid expansion, despite its higher cost, due to its superior detection efficiency and neutron energy discrimination capabilities, making it indispensable for critical applications in security and research. The market share for 3He-filled detectors is expected to reach 55% by 2033, up from 50% in 2025. However, BF3-filled detectors continue to hold a significant market share, especially in cost-sensitive industrial applications and for general neutron flux monitoring, owing to their established reliability and lower manufacturing costs. The market share for BF3-filled detectors is projected to be around 40% by 2033.
- Dominant Region: North America (38% market share in 2025, growing to 40% by 2033).
- Leading Country: United States.
- Key Drivers in North America: Homeland security funding, advanced research infrastructure, nuclear power industry safety regulations.
- Dominant Application Segment: Homeland Security (45% market share by 2033).
- Key Drivers in Homeland Security: Nuclear non-proliferation, cargo screening, threat detection.
- Dominant Detector Type: 3He-filled Detector (55% market share by 2033).
- Key Drivers for 3He-filled Detectors: High efficiency, neutron energy discrimination.
- BF3-filled Detector Market Share: ~40% by 2033, driven by cost-effectiveness and industrial use.
Gas-filled Neutron Detector Product Landscape
The gas-filled neutron detector product landscape is characterized by a range of innovations focused on enhancing detection efficiency, improving ruggedness, and enabling real-time data acquisition. Manufacturers are actively developing detectors with higher neutron capture cross-sections and optimized gas compositions for specific energy ranges. For instance, advanced 3He-filled detectors are being miniaturized for portable applications in homeland security, while robust BF3-filled detectors are engineered for harsh industrial environments. Unique selling propositions often lie in detector sensitivity, energy resolution capabilities, and operational lifetime. Technological advancements include improved electrode designs, low-noise electronics, and integration with advanced data processing software for faster analysis and threat identification. The market for specialized neutron detectors for applications like neutron radiography and thermal neutron imaging is also expanding.
Key Drivers, Barriers & Challenges in Gas-filled Neutron Detector
Key Drivers:
- Growing Homeland Security Imperatives: Increased global emphasis on nuclear material detection and border security, driving demand for advanced neutron detection systems.
- Advancements in Fundamental Research: Ongoing research in nuclear physics, particle physics, and fusion energy necessitates high-performance neutron detectors.
- Industrial Safety and Monitoring: Stringent safety regulations in nuclear power and the need for process monitoring in industries like oil and gas fuel the demand.
- Technological Sophistication: Continuous R&D leading to improved detector sensitivity, energy resolution, and miniaturization.
Barriers & Challenges:
- Helium-3 Supply Chain Volatility: The geopolitical sensitivity and limited supply of Helium-3 create supply chain disruptions and price fluctuations, impacting the cost and availability of 3He-filled detectors. This has led to a projected increase of 15% in the cost of 3He-filled detectors over the forecast period.
- High Cost of Advanced Detectors: Sophisticated gas-filled detectors, particularly those utilizing enriched Helium-3, can be prohibitively expensive for some applications, limiting their widespread adoption.
- Regulatory Hurdles: Complex export controls and safety regulations for certain nuclear technologies can pose challenges for market entry and expansion in some regions.
- Competition from Alternative Technologies: While specialized, gas-filled detectors face competition from other neutron detection technologies like scintillators and solid-state detectors, especially in applications where cost is a primary concern.
Emerging Opportunities in Gas-filled Neutron Detector
Emerging opportunities in the gas-filled neutron detector market lie in the development of cost-effective alternatives to Helium-3 detectors, such as those utilizing boron-10 enriched gases or novel gas mixtures. The expansion of non-destructive testing (NDT) applications in industries beyond oil and gas, including aerospace and manufacturing, presents a significant growth avenue. Furthermore, the increasing demand for portable and handheld neutron detectors for field deployment in security and emergency response scenarios is creating opportunities for miniaturization and integration of advanced features. The growth of the small modular reactor (SMR) market also opens new avenues for neutron detectors in monitoring and control systems.
Growth Accelerators in the Gas-filled Neutron Detector Industry
Several catalysts are accelerating growth in the gas-filled neutron detector industry. Technological breakthroughs in neutron detection materials and detector design are enhancing performance and reducing costs. Strategic partnerships between detector manufacturers and end-users, such as research institutions and government agencies, are fostering innovation and ensuring products meet specific application needs. Market expansion strategies, particularly targeting emerging economies with increasing investments in nuclear energy and security infrastructure, are also contributing to growth. The continued focus on homeland security and the development of next-generation nuclear power technologies are strong long-term growth drivers.
Key Players Shaping the Gas-filled Neutron Detector Market
- Photonis
- Arktis Radiation Detectors
- Thermo Fisher Scientific
- Mirion Technologies
- ORDELA
- Kromek Group
- Scientifica International
- Proportional Technologies
- Rotunda Scientific Technologies
Notable Milestones in Gas-filled Neutron Detector Sector
- 2021: Development of advanced low-noise electronics for improved signal-to-noise ratio in BF3 detectors.
- 2022: Launch of a new generation of compact, high-efficiency 3He neutron detectors for portable homeland security applications.
- 2023: Significant investment in R&D for alternative neutron detection materials to mitigate Helium-3 supply risks.
- 2024: Introduction of enhanced data acquisition and analysis software integrated with gas-filled detectors for faster threat identification.
- 2025 (Est.): Expected introduction of novel gas mixtures offering improved neutron sensitivity and energy resolution.
In-Depth Gas-filled Neutron Detector Market Outlook
The outlook for the gas-filled neutron detector market remains exceptionally positive, driven by an confluence of factors including persistent global security concerns, ongoing advancements in scientific research, and the evolving needs of the industrial sector. Growth accelerators such as the development of Helium-3 alternatives, coupled with the expansion of non-destructive testing applications and the burgeoning small modular reactor market, will fuel sustained expansion. Strategic collaborations and market penetration into emerging economies will further bolster the industry's trajectory. The market is expected to continue its upward trend, with innovation in detector sensitivity, portability, and data integration being key to capturing future opportunities. The estimated market size in 2033 is $2.3 billion.
Gas-filled Neutron Detector Segmentation
-
1. Application
- 1.1. Homeland Security
- 1.2. Fundamental Research
- 1.3. Industrial Monitoring
- 1.4. Others
-
2. Types
- 2.1. BF3-filled Detector
- 2.2. 3He-filled Detector
Gas-filled Neutron Detector Segmentation By Geography
-
1. North America
- 1.1. United States
- 1.2. Canada
- 1.3. Mexico
-
2. South America
- 2.1. Brazil
- 2.2. Argentina
- 2.3. Rest of South America
-
3. Europe
- 3.1. United Kingdom
- 3.2. Germany
- 3.3. France
- 3.4. Italy
- 3.5. Spain
- 3.6. Russia
- 3.7. Benelux
- 3.8. Nordics
- 3.9. Rest of Europe
-
4. Middle East & Africa
- 4.1. Turkey
- 4.2. Israel
- 4.3. GCC
- 4.4. North Africa
- 4.5. South Africa
- 4.6. Rest of Middle East & Africa
-
5. Asia Pacific
- 5.1. China
- 5.2. India
- 5.3. Japan
- 5.4. South Korea
- 5.5. ASEAN
- 5.6. Oceania
- 5.7. Rest of Asia Pacific
Gas-filled Neutron Detector Regional Market Share
Geographic Coverage of Gas-filled Neutron Detector
Gas-filled Neutron Detector REPORT HIGHLIGHTS
| Aspects | Details |
|---|---|
| Study Period | 2020-2034 |
| Base Year | 2025 |
| Estimated Year | 2026 |
| Forecast Period | 2026-2034 |
| Historical Period | 2020-2025 |
| Growth Rate | CAGR of 6.6% from 2020-2034 |
| Segmentation |
|
Table of Contents
- 1. Introduction
- 1.1. Research Scope
- 1.2. Market Segmentation
- 1.3. Research Objective
- 1.4. Definitions and Assumptions
- 2. Executive Summary
- 2.1. Market Snapshot
- 3. Market Dynamics
- 3.1. Market Drivers
- 3.2. Market Restrains
- 3.3. Market Trends
- 3.4. Market Opportunities
- 4. Market Factor Analysis
- 4.1. Porters Five Forces
- 4.1.1. Bargaining Power of Suppliers
- 4.1.2. Bargaining Power of Buyers
- 4.1.3. Threat of New Entrants
- 4.1.4. Threat of Substitutes
- 4.1.5. Competitive Rivalry
- 4.2. PESTEL analysis
- 4.3. BCG Analysis
- 4.3.1. Stars (High Growth, High Market Share)
- 4.3.2. Cash Cows (Low Growth, High Market Share)
- 4.3.3. Question Mark (High Growth, Low Market Share)
- 4.3.4. Dogs (Low Growth, Low Market Share)
- 4.4. Ansoff Matrix Analysis
- 4.5. Supply Chain Analysis
- 4.6. Regulatory Landscape
- 4.7. Current Market Potential and Opportunity Assessment (TAM–SAM–SOM Framework)
- 4.8. NRP Analyst Note
- 4.1. Porters Five Forces
- 5. Market Analysis, Insights and Forecast 2021-2033
- 5.1. Market Analysis, Insights and Forecast - by Application
- 5.1.1. Homeland Security
- 5.1.2. Fundamental Research
- 5.1.3. Industrial Monitoring
- 5.1.4. Others
- 5.2. Market Analysis, Insights and Forecast - by Types
- 5.2.1. BF3-filled Detector
- 5.2.2. 3He-filled Detector
- 5.3. Market Analysis, Insights and Forecast - by Region
- 5.3.1. North America
- 5.3.2. South America
- 5.3.3. Europe
- 5.3.4. Middle East & Africa
- 5.3.5. Asia Pacific
- 5.1. Market Analysis, Insights and Forecast - by Application
- 6. Global Gas-filled Neutron Detector Analysis, Insights and Forecast, 2021-2033
- 6.1. Market Analysis, Insights and Forecast - by Application
- 6.1.1. Homeland Security
- 6.1.2. Fundamental Research
- 6.1.3. Industrial Monitoring
- 6.1.4. Others
- 6.2. Market Analysis, Insights and Forecast - by Types
- 6.2.1. BF3-filled Detector
- 6.2.2. 3He-filled Detector
- 6.1. Market Analysis, Insights and Forecast - by Application
- 7. North America Gas-filled Neutron Detector Analysis, Insights and Forecast, 2020-2032
- 7.1. Market Analysis, Insights and Forecast - by Application
- 7.1.1. Homeland Security
- 7.1.2. Fundamental Research
- 7.1.3. Industrial Monitoring
- 7.1.4. Others
- 7.2. Market Analysis, Insights and Forecast - by Types
- 7.2.1. BF3-filled Detector
- 7.2.2. 3He-filled Detector
- 7.1. Market Analysis, Insights and Forecast - by Application
- 8. South America Gas-filled Neutron Detector Analysis, Insights and Forecast, 2020-2032
- 8.1. Market Analysis, Insights and Forecast - by Application
- 8.1.1. Homeland Security
- 8.1.2. Fundamental Research
- 8.1.3. Industrial Monitoring
- 8.1.4. Others
- 8.2. Market Analysis, Insights and Forecast - by Types
- 8.2.1. BF3-filled Detector
- 8.2.2. 3He-filled Detector
- 8.1. Market Analysis, Insights and Forecast - by Application
- 9. Europe Gas-filled Neutron Detector Analysis, Insights and Forecast, 2020-2032
- 9.1. Market Analysis, Insights and Forecast - by Application
- 9.1.1. Homeland Security
- 9.1.2. Fundamental Research
- 9.1.3. Industrial Monitoring
- 9.1.4. Others
- 9.2. Market Analysis, Insights and Forecast - by Types
- 9.2.1. BF3-filled Detector
- 9.2.2. 3He-filled Detector
- 9.1. Market Analysis, Insights and Forecast - by Application
- 10. Middle East & Africa Gas-filled Neutron Detector Analysis, Insights and Forecast, 2020-2032
- 10.1. Market Analysis, Insights and Forecast - by Application
- 10.1.1. Homeland Security
- 10.1.2. Fundamental Research
- 10.1.3. Industrial Monitoring
- 10.1.4. Others
- 10.2. Market Analysis, Insights and Forecast - by Types
- 10.2.1. BF3-filled Detector
- 10.2.2. 3He-filled Detector
- 10.1. Market Analysis, Insights and Forecast - by Application
- 11. Asia Pacific Gas-filled Neutron Detector Analysis, Insights and Forecast, 2020-2032
- 11.1. Market Analysis, Insights and Forecast - by Application
- 11.1.1. Homeland Security
- 11.1.2. Fundamental Research
- 11.1.3. Industrial Monitoring
- 11.1.4. Others
- 11.2. Market Analysis, Insights and Forecast - by Types
- 11.2.1. BF3-filled Detector
- 11.2.2. 3He-filled Detector
- 11.1. Market Analysis, Insights and Forecast - by Application
- 12. Competitive Analysis
- 12.1. Company Profiles
- 12.1.1 Photonis
- 12.1.1.1. Company Overview
- 12.1.1.2. Products
- 12.1.1.3. Company Financials
- 12.1.1.4. SWOT Analysis
- 12.1.2 Arktis Radiation Detectors
- 12.1.2.1. Company Overview
- 12.1.2.2. Products
- 12.1.2.3. Company Financials
- 12.1.2.4. SWOT Analysis
- 12.1.3 Thermo-Fisher Scientific
- 12.1.3.1. Company Overview
- 12.1.3.2. Products
- 12.1.3.3. Company Financials
- 12.1.3.4. SWOT Analysis
- 12.1.4 Mirion Technologies
- 12.1.4.1. Company Overview
- 12.1.4.2. Products
- 12.1.4.3. Company Financials
- 12.1.4.4. SWOT Analysis
- 12.1.5 ORDELA
- 12.1.5.1. Company Overview
- 12.1.5.2. Products
- 12.1.5.3. Company Financials
- 12.1.5.4. SWOT Analysis
- 12.1.6 Kromek Group
- 12.1.6.1. Company Overview
- 12.1.6.2. Products
- 12.1.6.3. Company Financials
- 12.1.6.4. SWOT Analysis
- 12.1.7 Scientifica International
- 12.1.7.1. Company Overview
- 12.1.7.2. Products
- 12.1.7.3. Company Financials
- 12.1.7.4. SWOT Analysis
- 12.1.8 Proportional Technologies
- 12.1.8.1. Company Overview
- 12.1.8.2. Products
- 12.1.8.3. Company Financials
- 12.1.8.4. SWOT Analysis
- 12.1.9 Rotunda Scientific Technologies
- 12.1.9.1. Company Overview
- 12.1.9.2. Products
- 12.1.9.3. Company Financials
- 12.1.9.4. SWOT Analysis
- 12.1.1 Photonis
- 12.2. Market Entropy
- 12.2.1 Company's Key Areas Served
- 12.2.2 Recent Developments
- 12.3. Company Market Share Analysis 2025
- 12.3.1 Top 5 Companies Market Share Analysis
- 12.3.2 Top 3 Companies Market Share Analysis
- 12.4. List of Potential Customers
- 13. Research Methodology
List of Figures
- Figure 1: Global Gas-filled Neutron Detector Revenue Breakdown (undefined, %) by Region 2025 & 2033
- Figure 2: Global Gas-filled Neutron Detector Volume Breakdown (K, %) by Region 2025 & 2033
- Figure 3: North America Gas-filled Neutron Detector Revenue (undefined), by Application 2025 & 2033
- Figure 4: North America Gas-filled Neutron Detector Volume (K), by Application 2025 & 2033
- Figure 5: North America Gas-filled Neutron Detector Revenue Share (%), by Application 2025 & 2033
- Figure 6: North America Gas-filled Neutron Detector Volume Share (%), by Application 2025 & 2033
- Figure 7: North America Gas-filled Neutron Detector Revenue (undefined), by Types 2025 & 2033
- Figure 8: North America Gas-filled Neutron Detector Volume (K), by Types 2025 & 2033
- Figure 9: North America Gas-filled Neutron Detector Revenue Share (%), by Types 2025 & 2033
- Figure 10: North America Gas-filled Neutron Detector Volume Share (%), by Types 2025 & 2033
- Figure 11: North America Gas-filled Neutron Detector Revenue (undefined), by Country 2025 & 2033
- Figure 12: North America Gas-filled Neutron Detector Volume (K), by Country 2025 & 2033
- Figure 13: North America Gas-filled Neutron Detector Revenue Share (%), by Country 2025 & 2033
- Figure 14: North America Gas-filled Neutron Detector Volume Share (%), by Country 2025 & 2033
- Figure 15: South America Gas-filled Neutron Detector Revenue (undefined), by Application 2025 & 2033
- Figure 16: South America Gas-filled Neutron Detector Volume (K), by Application 2025 & 2033
- Figure 17: South America Gas-filled Neutron Detector Revenue Share (%), by Application 2025 & 2033
- Figure 18: South America Gas-filled Neutron Detector Volume Share (%), by Application 2025 & 2033
- Figure 19: South America Gas-filled Neutron Detector Revenue (undefined), by Types 2025 & 2033
- Figure 20: South America Gas-filled Neutron Detector Volume (K), by Types 2025 & 2033
- Figure 21: South America Gas-filled Neutron Detector Revenue Share (%), by Types 2025 & 2033
- Figure 22: South America Gas-filled Neutron Detector Volume Share (%), by Types 2025 & 2033
- Figure 23: South America Gas-filled Neutron Detector Revenue (undefined), by Country 2025 & 2033
- Figure 24: South America Gas-filled Neutron Detector Volume (K), by Country 2025 & 2033
- Figure 25: South America Gas-filled Neutron Detector Revenue Share (%), by Country 2025 & 2033
- Figure 26: South America Gas-filled Neutron Detector Volume Share (%), by Country 2025 & 2033
- Figure 27: Europe Gas-filled Neutron Detector Revenue (undefined), by Application 2025 & 2033
- Figure 28: Europe Gas-filled Neutron Detector Volume (K), by Application 2025 & 2033
- Figure 29: Europe Gas-filled Neutron Detector Revenue Share (%), by Application 2025 & 2033
- Figure 30: Europe Gas-filled Neutron Detector Volume Share (%), by Application 2025 & 2033
- Figure 31: Europe Gas-filled Neutron Detector Revenue (undefined), by Types 2025 & 2033
- Figure 32: Europe Gas-filled Neutron Detector Volume (K), by Types 2025 & 2033
- Figure 33: Europe Gas-filled Neutron Detector Revenue Share (%), by Types 2025 & 2033
- Figure 34: Europe Gas-filled Neutron Detector Volume Share (%), by Types 2025 & 2033
- Figure 35: Europe Gas-filled Neutron Detector Revenue (undefined), by Country 2025 & 2033
- Figure 36: Europe Gas-filled Neutron Detector Volume (K), by Country 2025 & 2033
- Figure 37: Europe Gas-filled Neutron Detector Revenue Share (%), by Country 2025 & 2033
- Figure 38: Europe Gas-filled Neutron Detector Volume Share (%), by Country 2025 & 2033
- Figure 39: Middle East & Africa Gas-filled Neutron Detector Revenue (undefined), by Application 2025 & 2033
- Figure 40: Middle East & Africa Gas-filled Neutron Detector Volume (K), by Application 2025 & 2033
- Figure 41: Middle East & Africa Gas-filled Neutron Detector Revenue Share (%), by Application 2025 & 2033
- Figure 42: Middle East & Africa Gas-filled Neutron Detector Volume Share (%), by Application 2025 & 2033
- Figure 43: Middle East & Africa Gas-filled Neutron Detector Revenue (undefined), by Types 2025 & 2033
- Figure 44: Middle East & Africa Gas-filled Neutron Detector Volume (K), by Types 2025 & 2033
- Figure 45: Middle East & Africa Gas-filled Neutron Detector Revenue Share (%), by Types 2025 & 2033
- Figure 46: Middle East & Africa Gas-filled Neutron Detector Volume Share (%), by Types 2025 & 2033
- Figure 47: Middle East & Africa Gas-filled Neutron Detector Revenue (undefined), by Country 2025 & 2033
- Figure 48: Middle East & Africa Gas-filled Neutron Detector Volume (K), by Country 2025 & 2033
- Figure 49: Middle East & Africa Gas-filled Neutron Detector Revenue Share (%), by Country 2025 & 2033
- Figure 50: Middle East & Africa Gas-filled Neutron Detector Volume Share (%), by Country 2025 & 2033
- Figure 51: Asia Pacific Gas-filled Neutron Detector Revenue (undefined), by Application 2025 & 2033
- Figure 52: Asia Pacific Gas-filled Neutron Detector Volume (K), by Application 2025 & 2033
- Figure 53: Asia Pacific Gas-filled Neutron Detector Revenue Share (%), by Application 2025 & 2033
- Figure 54: Asia Pacific Gas-filled Neutron Detector Volume Share (%), by Application 2025 & 2033
- Figure 55: Asia Pacific Gas-filled Neutron Detector Revenue (undefined), by Types 2025 & 2033
- Figure 56: Asia Pacific Gas-filled Neutron Detector Volume (K), by Types 2025 & 2033
- Figure 57: Asia Pacific Gas-filled Neutron Detector Revenue Share (%), by Types 2025 & 2033
- Figure 58: Asia Pacific Gas-filled Neutron Detector Volume Share (%), by Types 2025 & 2033
- Figure 59: Asia Pacific Gas-filled Neutron Detector Revenue (undefined), by Country 2025 & 2033
- Figure 60: Asia Pacific Gas-filled Neutron Detector Volume (K), by Country 2025 & 2033
- Figure 61: Asia Pacific Gas-filled Neutron Detector Revenue Share (%), by Country 2025 & 2033
- Figure 62: Asia Pacific Gas-filled Neutron Detector Volume Share (%), by Country 2025 & 2033
List of Tables
- Table 1: Global Gas-filled Neutron Detector Revenue undefined Forecast, by Application 2020 & 2033
- Table 2: Global Gas-filled Neutron Detector Volume K Forecast, by Application 2020 & 2033
- Table 3: Global Gas-filled Neutron Detector Revenue undefined Forecast, by Types 2020 & 2033
- Table 4: Global Gas-filled Neutron Detector Volume K Forecast, by Types 2020 & 2033
- Table 5: Global Gas-filled Neutron Detector Revenue undefined Forecast, by Region 2020 & 2033
- Table 6: Global Gas-filled Neutron Detector Volume K Forecast, by Region 2020 & 2033
- Table 7: Global Gas-filled Neutron Detector Revenue undefined Forecast, by Application 2020 & 2033
- Table 8: Global Gas-filled Neutron Detector Volume K Forecast, by Application 2020 & 2033
- Table 9: Global Gas-filled Neutron Detector Revenue undefined Forecast, by Types 2020 & 2033
- Table 10: Global Gas-filled Neutron Detector Volume K Forecast, by Types 2020 & 2033
- Table 11: Global Gas-filled Neutron Detector Revenue undefined Forecast, by Country 2020 & 2033
- Table 12: Global Gas-filled Neutron Detector Volume K Forecast, by Country 2020 & 2033
- Table 13: United States Gas-filled Neutron Detector Revenue (undefined) Forecast, by Application 2020 & 2033
- Table 14: United States Gas-filled Neutron Detector Volume (K) Forecast, by Application 2020 & 2033
- Table 15: Canada Gas-filled Neutron Detector Revenue (undefined) Forecast, by Application 2020 & 2033
- Table 16: Canada Gas-filled Neutron Detector Volume (K) Forecast, by Application 2020 & 2033
- Table 17: Mexico Gas-filled Neutron Detector Revenue (undefined) Forecast, by Application 2020 & 2033
- Table 18: Mexico Gas-filled Neutron Detector Volume (K) Forecast, by Application 2020 & 2033
- Table 19: Global Gas-filled Neutron Detector Revenue undefined Forecast, by Application 2020 & 2033
- Table 20: Global Gas-filled Neutron Detector Volume K Forecast, by Application 2020 & 2033
- Table 21: Global Gas-filled Neutron Detector Revenue undefined Forecast, by Types 2020 & 2033
- Table 22: Global Gas-filled Neutron Detector Volume K Forecast, by Types 2020 & 2033
- Table 23: Global Gas-filled Neutron Detector Revenue undefined Forecast, by Country 2020 & 2033
- Table 24: Global Gas-filled Neutron Detector Volume K Forecast, by Country 2020 & 2033
- Table 25: Brazil Gas-filled Neutron Detector Revenue (undefined) Forecast, by Application 2020 & 2033
- Table 26: Brazil Gas-filled Neutron Detector Volume (K) Forecast, by Application 2020 & 2033
- Table 27: Argentina Gas-filled Neutron Detector Revenue (undefined) Forecast, by Application 2020 & 2033
- Table 28: Argentina Gas-filled Neutron Detector Volume (K) Forecast, by Application 2020 & 2033
- Table 29: Rest of South America Gas-filled Neutron Detector Revenue (undefined) Forecast, by Application 2020 & 2033
- Table 30: Rest of South America Gas-filled Neutron Detector Volume (K) Forecast, by Application 2020 & 2033
- Table 31: Global Gas-filled Neutron Detector Revenue undefined Forecast, by Application 2020 & 2033
- Table 32: Global Gas-filled Neutron Detector Volume K Forecast, by Application 2020 & 2033
- Table 33: Global Gas-filled Neutron Detector Revenue undefined Forecast, by Types 2020 & 2033
- Table 34: Global Gas-filled Neutron Detector Volume K Forecast, by Types 2020 & 2033
- Table 35: Global Gas-filled Neutron Detector Revenue undefined Forecast, by Country 2020 & 2033
- Table 36: Global Gas-filled Neutron Detector Volume K Forecast, by Country 2020 & 2033
- Table 37: United Kingdom Gas-filled Neutron Detector Revenue (undefined) Forecast, by Application 2020 & 2033
- Table 38: United Kingdom Gas-filled Neutron Detector Volume (K) Forecast, by Application 2020 & 2033
- Table 39: Germany Gas-filled Neutron Detector Revenue (undefined) Forecast, by Application 2020 & 2033
- Table 40: Germany Gas-filled Neutron Detector Volume (K) Forecast, by Application 2020 & 2033
- Table 41: France Gas-filled Neutron Detector Revenue (undefined) Forecast, by Application 2020 & 2033
- Table 42: France Gas-filled Neutron Detector Volume (K) Forecast, by Application 2020 & 2033
- Table 43: Italy Gas-filled Neutron Detector Revenue (undefined) Forecast, by Application 2020 & 2033
- Table 44: Italy Gas-filled Neutron Detector Volume (K) Forecast, by Application 2020 & 2033
- Table 45: Spain Gas-filled Neutron Detector Revenue (undefined) Forecast, by Application 2020 & 2033
- Table 46: Spain Gas-filled Neutron Detector Volume (K) Forecast, by Application 2020 & 2033
- Table 47: Russia Gas-filled Neutron Detector Revenue (undefined) Forecast, by Application 2020 & 2033
- Table 48: Russia Gas-filled Neutron Detector Volume (K) Forecast, by Application 2020 & 2033
- Table 49: Benelux Gas-filled Neutron Detector Revenue (undefined) Forecast, by Application 2020 & 2033
- Table 50: Benelux Gas-filled Neutron Detector Volume (K) Forecast, by Application 2020 & 2033
- Table 51: Nordics Gas-filled Neutron Detector Revenue (undefined) Forecast, by Application 2020 & 2033
- Table 52: Nordics Gas-filled Neutron Detector Volume (K) Forecast, by Application 2020 & 2033
- Table 53: Rest of Europe Gas-filled Neutron Detector Revenue (undefined) Forecast, by Application 2020 & 2033
- Table 54: Rest of Europe Gas-filled Neutron Detector Volume (K) Forecast, by Application 2020 & 2033
- Table 55: Global Gas-filled Neutron Detector Revenue undefined Forecast, by Application 2020 & 2033
- Table 56: Global Gas-filled Neutron Detector Volume K Forecast, by Application 2020 & 2033
- Table 57: Global Gas-filled Neutron Detector Revenue undefined Forecast, by Types 2020 & 2033
- Table 58: Global Gas-filled Neutron Detector Volume K Forecast, by Types 2020 & 2033
- Table 59: Global Gas-filled Neutron Detector Revenue undefined Forecast, by Country 2020 & 2033
- Table 60: Global Gas-filled Neutron Detector Volume K Forecast, by Country 2020 & 2033
- Table 61: Turkey Gas-filled Neutron Detector Revenue (undefined) Forecast, by Application 2020 & 2033
- Table 62: Turkey Gas-filled Neutron Detector Volume (K) Forecast, by Application 2020 & 2033
- Table 63: Israel Gas-filled Neutron Detector Revenue (undefined) Forecast, by Application 2020 & 2033
- Table 64: Israel Gas-filled Neutron Detector Volume (K) Forecast, by Application 2020 & 2033
- Table 65: GCC Gas-filled Neutron Detector Revenue (undefined) Forecast, by Application 2020 & 2033
- Table 66: GCC Gas-filled Neutron Detector Volume (K) Forecast, by Application 2020 & 2033
- Table 67: North Africa Gas-filled Neutron Detector Revenue (undefined) Forecast, by Application 2020 & 2033
- Table 68: North Africa Gas-filled Neutron Detector Volume (K) Forecast, by Application 2020 & 2033
- Table 69: South Africa Gas-filled Neutron Detector Revenue (undefined) Forecast, by Application 2020 & 2033
- Table 70: South Africa Gas-filled Neutron Detector Volume (K) Forecast, by Application 2020 & 2033
- Table 71: Rest of Middle East & Africa Gas-filled Neutron Detector Revenue (undefined) Forecast, by Application 2020 & 2033
- Table 72: Rest of Middle East & Africa Gas-filled Neutron Detector Volume (K) Forecast, by Application 2020 & 2033
- Table 73: Global Gas-filled Neutron Detector Revenue undefined Forecast, by Application 2020 & 2033
- Table 74: Global Gas-filled Neutron Detector Volume K Forecast, by Application 2020 & 2033
- Table 75: Global Gas-filled Neutron Detector Revenue undefined Forecast, by Types 2020 & 2033
- Table 76: Global Gas-filled Neutron Detector Volume K Forecast, by Types 2020 & 2033
- Table 77: Global Gas-filled Neutron Detector Revenue undefined Forecast, by Country 2020 & 2033
- Table 78: Global Gas-filled Neutron Detector Volume K Forecast, by Country 2020 & 2033
- Table 79: China Gas-filled Neutron Detector Revenue (undefined) Forecast, by Application 2020 & 2033
- Table 80: China Gas-filled Neutron Detector Volume (K) Forecast, by Application 2020 & 2033
- Table 81: India Gas-filled Neutron Detector Revenue (undefined) Forecast, by Application 2020 & 2033
- Table 82: India Gas-filled Neutron Detector Volume (K) Forecast, by Application 2020 & 2033
- Table 83: Japan Gas-filled Neutron Detector Revenue (undefined) Forecast, by Application 2020 & 2033
- Table 84: Japan Gas-filled Neutron Detector Volume (K) Forecast, by Application 2020 & 2033
- Table 85: South Korea Gas-filled Neutron Detector Revenue (undefined) Forecast, by Application 2020 & 2033
- Table 86: South Korea Gas-filled Neutron Detector Volume (K) Forecast, by Application 2020 & 2033
- Table 87: ASEAN Gas-filled Neutron Detector Revenue (undefined) Forecast, by Application 2020 & 2033
- Table 88: ASEAN Gas-filled Neutron Detector Volume (K) Forecast, by Application 2020 & 2033
- Table 89: Oceania Gas-filled Neutron Detector Revenue (undefined) Forecast, by Application 2020 & 2033
- Table 90: Oceania Gas-filled Neutron Detector Volume (K) Forecast, by Application 2020 & 2033
- Table 91: Rest of Asia Pacific Gas-filled Neutron Detector Revenue (undefined) Forecast, by Application 2020 & 2033
- Table 92: Rest of Asia Pacific Gas-filled Neutron Detector Volume (K) Forecast, by Application 2020 & 2033
Frequently Asked Questions
1. What is the projected Compound Annual Growth Rate (CAGR) of the Gas-filled Neutron Detector?
The projected CAGR is approximately 6.6%.
2. Which companies are prominent players in the Gas-filled Neutron Detector?
Key companies in the market include Photonis, Arktis Radiation Detectors, Thermo-Fisher Scientific, Mirion Technologies, ORDELA, Kromek Group, Scientifica International, Proportional Technologies, Rotunda Scientific Technologies.
3. What are the main segments of the Gas-filled Neutron Detector?
The market segments include Application, Types.
4. Can you provide details about the market size?
The market size is estimated to be USD XXX N/A as of 2022.
5. What are some drivers contributing to market growth?
N/A
6. What are the notable trends driving market growth?
N/A
7. Are there any restraints impacting market growth?
N/A
8. Can you provide examples of recent developments in the market?
N/A
9. What pricing options are available for accessing the report?
Pricing options include single-user, multi-user, and enterprise licenses priced at USD 3350.00, USD 5025.00, and USD 6700.00 respectively.
10. Is the market size provided in terms of value or volume?
The market size is provided in terms of value, measured in N/A and volume, measured in K.
11. Are there any specific market keywords associated with the report?
Yes, the market keyword associated with the report is "Gas-filled Neutron Detector," which aids in identifying and referencing the specific market segment covered.
12. How do I determine which pricing option suits my needs best?
The pricing options vary based on user requirements and access needs. Individual users may opt for single-user licenses, while businesses requiring broader access may choose multi-user or enterprise licenses for cost-effective access to the report.
13. Are there any additional resources or data provided in the Gas-filled Neutron Detector report?
While the report offers comprehensive insights, it's advisable to review the specific contents or supplementary materials provided to ascertain if additional resources or data are available.
14. How can I stay updated on further developments or reports in the Gas-filled Neutron Detector?
To stay informed about further developments, trends, and reports in the Gas-filled Neutron Detector, consider subscribing to industry newsletters, following relevant companies and organizations, or regularly checking reputable industry news sources and publications.
Methodology
Step 1 - Identification of Relevant Samples Size from Population Database


Step 2 - Approaches for Defining Global Market Size (Value, Volume* & Price*)

Note*: In applicable scenarios
Step 3 - Data Sources
Primary Research
- Web Analytics
- Survey Reports
- Research Institute
- Latest Research Reports
- Opinion Leaders
Secondary Research
- Annual Reports
- White Paper
- Latest Press Release
- Industry Association
- Paid Database
- Investor Presentations

Step 4 - Data Triangulation
Involves using different sources of information in order to increase the validity of a study
These sources are likely to be stakeholders in a program - participants, other researchers, program staff, other community members, and so on.
Then we put all data in single framework & apply various statistical tools to find out the dynamic on the market.
During the analysis stage, feedback from the stakeholder groups would be compared to determine areas of agreement as well as areas of divergence