

Key Insights
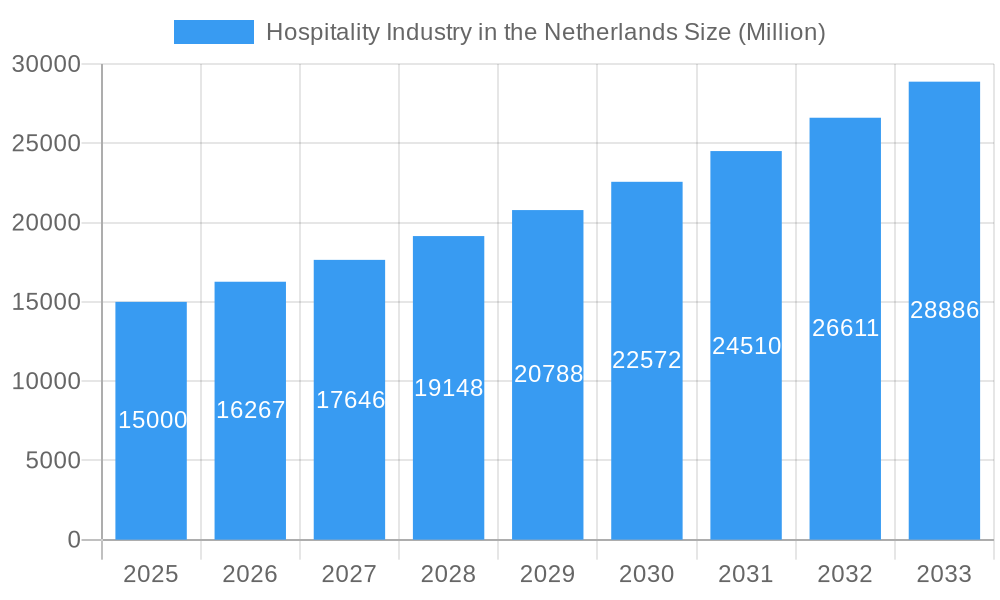
The Netherlands hospitality sector is forecast to achieve a significant market size of $3.95 billion by 2025, demonstrating a robust compound annual growth rate (CAGR) of 3.5%. This sustained expansion is primarily driven by escalating inbound tourism, a resurgence in business travel, and the growing demand for specialized accommodation, including service apartments designed for extended stays and diverse traveler needs. Supportive government policies promoting sustainable tourism and ongoing infrastructure investments are further bolstering market growth. Despite prevailing challenges such as labor availability and economic volatility impacting travel patterns, the industry outlook remains highly positive. The market is strategically segmented by hotel type, encompassing chain and independent establishments, and by accommodation category, including service apartments, budget/economy, mid-range/upper-mid-range, and luxury hotels, offering a broad spectrum of investment and operational prospects. Key market participants include Bastion Hotel Group, Louvre Hotels Group, Hilton, IHG, and Radisson, although independent hotels and smaller chains continue to capture market share, underscoring a dynamic competitive environment. The prevalent use of loyalty programs by major brands emphasizes the critical role of customer retention in this competitive landscape.
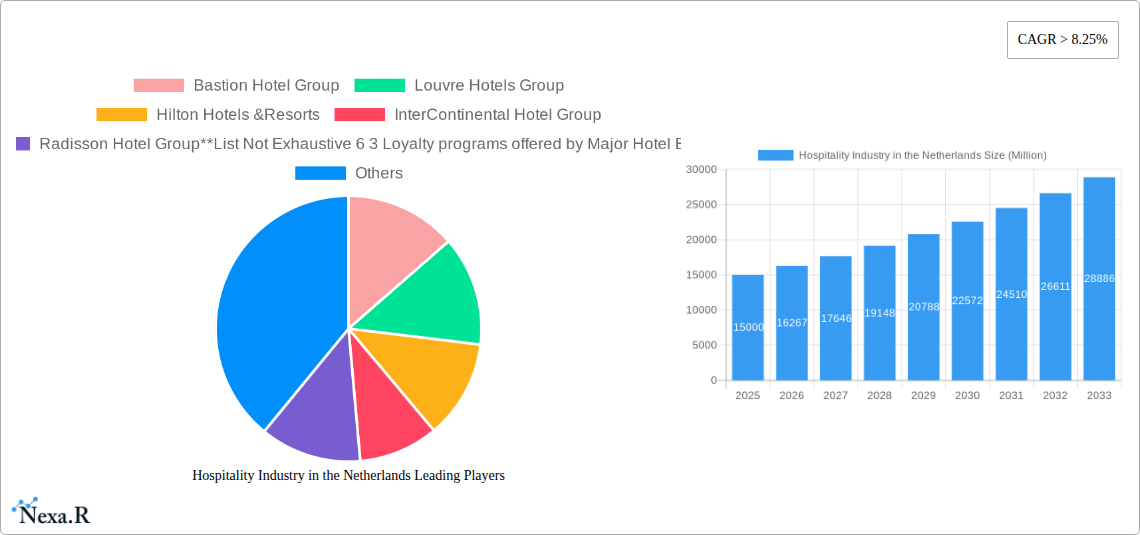
Hospitality Industry in the Netherlands Market Size (In Billion)
Market segmentation offers crucial insights into evolving consumer preferences, guiding the prediction of future trends. The increasing demand for budget and economy accommodations appeals to price-sensitive travelers, while the preference for luxury and service apartments highlights a growing inclination towards personalized experiences and longer durations of stay. A thorough analysis of competitor strategies, encompassing pricing, marketing, and brand positioning, is essential for sustained success. Future market growth will be contingent upon efficient operational cost management, the integration of innovative technologies to elevate guest experiences, and the adoption of sustainable practices aligned with contemporary consumer expectations. The Netherlands' strategic location within the European Union and its established reputation as a premier tourist destination will continue to be significant positive influences on the hospitality market.
Hospitality Industry in the Netherlands Company Market Share
Hospitality Industry in the Netherlands: Market Dynamics & Structure (2019-2033)
This comprehensive report provides a detailed analysis of the Netherlands' hospitality industry, encompassing market size, competitive landscape, and future growth projections (2019-2033). The study period covers the historical period (2019-2024), the base year (2025), and the forecast period (2025-2033). The report segments the market by type (Chain Hotels, Independent Hotels) and by segment (Service Apartments, Budget & Economy Hotels, Mid & Upper-Mid Scale Hotels, Luxury Hotels).
Market Concentration & Competitive Landscape: The Netherlands' hospitality market exhibits a moderately concentrated structure, with key players such as Bastion Hotel Group, Louvre Hotels Group, Hilton Hotels & Resorts, InterContinental Hotel Group, Radisson Hotel Group, Marriott International, AccorHotels, NH Hotels, Van der Valk, and Fletcher Hotels holding significant market share. The xx% market share held by the top 5 players indicates a competitive, yet not overly dominated, environment.
- Market Concentration (2025): xx% of market revenue controlled by top 5 players.
- M&A Activity (2019-2024): xx deals, with an average deal value of €xx million.
- Competitive Intensity: High, driven by price competition, service differentiation, and loyalty program offerings.
- Technological Innovation: Growing adoption of technologies such as online booking platforms, revenue management systems, and customer relationship management (CRM) tools.
- Regulatory Framework: Relatively stable, with regulations focusing on safety, hygiene, and environmental sustainability.
Hospitality Industry in the Netherlands Growth Trends & Insights (2019-2033)
This section delves into the growth trajectory of the Dutch hospitality market, analyzing key growth drivers and challenges. The analysis leverages extensive primary and secondary research to provide a granular understanding of market size evolution and future prospects.
- Market Size (2025): €xx billion
- CAGR (2025-2033): xx%
- Market Penetration: xx%
- Technological Disruptions: The increasing integration of technology, particularly in online booking and guest experience personalization, is transforming the industry.
- Consumer Behavior Shifts: Growing preference for experiential travel, sustainable tourism, and personalized services are reshaping consumer expectations. The rise of online travel agencies (OTAs) and review platforms has significantly influenced booking behavior. The impact of the COVID-19 pandemic and subsequent recovery are also incorporated.
Dominant Regions, Countries, or Segments in Hospitality Industry in the Netherlands
This section identifies the leading segments driving market expansion within the Dutch hospitality sector.
- Leading Segment by Type (2025): Chain Hotels (xx% market share), driven by economies of scale, brand recognition, and loyalty programs.
- Leading Segment by Accommodation (2025): Mid and Upper-Mid Scale Hotels (xx% market share) caters to the largest segment of the market due to price affordability and service quality.
- Key Drivers:
- Strong domestic tourism.
- Growing inbound tourism from key European markets.
- Increasing business travel.
- Government initiatives supporting tourism infrastructure development.
Hospitality Industry in the Netherlands Product Landscape
The Dutch hospitality landscape exhibits continuous product innovation. Hotels are increasingly focusing on unique selling propositions (USPs), offering personalized services, sustainable practices, and technological enhancements to elevate the guest experience. This includes the integration of smart room technologies, personalized in-room entertainment, and improved contactless check-in/check-out options. Performance metrics like occupancy rates, average daily rate (ADR), and revenue per available room (RevPAR) are crucial indicators of hotel performance.
Key Drivers, Barriers & Challenges in Hospitality Industry in the Netherlands
Key Drivers:
- Robust Tourism Growth: The Netherlands continues to attract a growing number of international and domestic tourists, fueled by its rich cultural heritage, picturesque landscapes, and vibrant cities.
- Rising Disposable Incomes: An upward trend in disposable incomes translates to increased consumer spending on travel, accommodation, and leisure activities, directly benefiting the hospitality sector.
- Strategic Infrastructure Investment: Ongoing investments in transportation networks, accommodation facilities, and tourist attractions are enhancing the overall appeal and accessibility of the Netherlands as a travel destination.
- Supportive Government Initiatives: Proactive government policies and incentives aimed at promoting tourism, fostering innovation, and improving the hospitality ecosystem play a crucial role in driving sector growth.
Key Barriers & Challenges:
- Global Event Volatility: The industry remains susceptible to disruptions caused by international events, geopolitical shifts, and health crises, leading to unpredictable fluctuations in tourist numbers.
- Intensified Market Competition: The Dutch hospitality landscape is highly competitive, with a multitude of hotels, serviced apartments, and alternative accommodation providers vying for market share.
- Persistent Labor Shortages: Attracting and retaining skilled personnel remains a significant challenge, exacerbated by an aging workforce and increased demand for specialized roles within the sector.
- Escalating Operating Costs: Rising costs associated with energy, wages, raw materials, and regulatory compliance place pressure on profit margins for hospitality businesses.
- Sustainability Demands: Growing consumer and regulatory pressure to adopt eco-friendly practices and reduce environmental impact requires significant investment and operational adjustments.
- Adapting to Evolving Consumer Expectations: Meeting the demand for personalized experiences, digital convenience, and unique offerings necessitates continuous innovation and service enhancement.
Emerging Opportunities in Hospitality Industry in the Netherlands
Emerging opportunities include the rise of experiential travel, the growth of sustainable tourism, and the increasing demand for personalized services. The integration of technology, like virtual reality (VR) and augmented reality (AR), and the implementation of innovative marketing and loyalty programs are attracting a new generation of travelers.
Growth Accelerators in the Hospitality Industry in the Netherlands Industry
The Netherlands hospitality market is on a trajectory for sustained and dynamic growth. Key accelerators include the widespread adoption of cutting-edge technological advancements such as AI-powered personalization, smart hotel solutions, and seamless booking platforms. Strategic partnerships between hotels, tour operators, and local businesses will unlock new revenue streams and enhance guest offerings. Furthermore, the industry is poised to capitalize on untapped market segments, including niche tourism, business travel diversification, and extended stay accommodations. Significant investments in sustainable practices, from energy efficiency to waste reduction, are not only meeting growing consumer demand but also enhancing brand reputation. Ultimately, delivering truly personalized and memorable guest experiences, tailored to individual preferences, will be paramount in differentiating offerings and fostering long-term customer loyalty.
Key Players Shaping the Hospitality Industry in the Netherlands Market
- Bastion Hotel Group
- Louvre Hotels Group
- Hilton Hotels & Resorts
- InterContinental Hotel Group
- Radisson Hotel Group
- Marriott International
- AccorHotels
- NH Hotels
- Van der Valk
- Fletcher Hotels
- Smaller independent boutique hotels and unique accommodation providers
Loyalty Programs: Prominent hotel brands actively engage guests through diverse and rewarding loyalty programs. These typically feature tiered membership levels offering exclusive benefits, points-based earning and redemption systems, and personalized offers designed to foster repeat business and brand advocacy.
Market Concentration: The Dutch hospitality market is a dynamic blend of dominant international hotel conglomerates, which bring global brand recognition and operational expertise, and a thriving ecosystem of independent hotels and boutique establishments, offering unique local experiences and personalized service.
Company Profiles: In-depth analyses of the strategies, market positioning, financial performance, and innovation initiatives of these key industry players are available in the comprehensive report, providing valuable insights into their contributions and future outlook.
Notable Milestones in Hospitality Industry in the Netherlands Sector
- May 2022: Fletcher Hotel successfully enhanced guest engagement and brand visibility by launching an innovative immersive virtual treasure hunt, demonstrating a commitment to experiential marketing.
- January 2023: InterContinental Hotel Group strategically leveraged technology to elevate the visitor experience by introducing an Augmented Reality (AR) hotel art tour, offering guests a unique and interactive way to explore hotel amenities and local culture.
- Ongoing: Numerous Dutch hospitality businesses are increasingly investing in digital transformation, focusing on seamless online booking, personalized guest communication through apps, and the implementation of smart room technologies to enhance convenience and efficiency.
- Recent Years: A growing emphasis on sustainability initiatives has led to the introduction of eco-friendly practices, such as renewable energy adoption, waste reduction programs, and the promotion of local, sustainable food sourcing, reflecting a commitment to responsible tourism.
In-Depth Hospitality Industry in the Netherlands Market Outlook
The Netherlands hospitality sector presents significant future growth potential, driven by continued tourism expansion, technological innovation, and investment in tourism infrastructure. Strategic partnerships, targeted marketing, and sustainable practices will be essential for long-term success. The increasing demand for unique and personalized experiences offers substantial opportunities for hotels to differentiate themselves and capture market share.
Hospitality Industry in the Netherlands Segmentation
-
1. Type
- 1.1. Chain Hotels
- 1.2. Independent Hotels
-
2. Segment
- 2.1. Service Apartments
- 2.2. Budget and Economy Hotels
- 2.3. Mid and Upper mid scale Hotels
- 2.4. Luxury Hotels
Hospitality Industry in the Netherlands Segmentation By Geography
-
1. North America
- 1.1. United States
- 1.2. Canada
- 1.3. Mexico
-
2. South America
- 2.1. Brazil
- 2.2. Argentina
- 2.3. Rest of South America
-
3. Europe
- 3.1. United Kingdom
- 3.2. Germany
- 3.3. France
- 3.4. Italy
- 3.5. Spain
- 3.6. Russia
- 3.7. Benelux
- 3.8. Nordics
- 3.9. Rest of Europe
-
4. Middle East & Africa
- 4.1. Turkey
- 4.2. Israel
- 4.3. GCC
- 4.4. North Africa
- 4.5. South Africa
- 4.6. Rest of Middle East & Africa
-
5. Asia Pacific
- 5.1. China
- 5.2. India
- 5.3. Japan
- 5.4. South Korea
- 5.5. ASEAN
- 5.6. Oceania
- 5.7. Rest of Asia Pacific
Hospitality Industry in the Netherlands Regional Market Share
Geographic Coverage of Hospitality Industry in the Netherlands
Hospitality Industry in the Netherlands REPORT HIGHLIGHTS
| Aspects | Details |
|---|---|
| Study Period | 2020-2034 |
| Base Year | 2025 |
| Estimated Year | 2026 |
| Forecast Period | 2026-2034 |
| Historical Period | 2020-2025 |
| Growth Rate | CAGR of 3.5% from 2020-2034 |
| Segmentation |
|
Table of Contents
- 1. Introduction
- 1.1. Research Scope
- 1.2. Market Segmentation
- 1.3. Research Objective
- 1.4. Definitions and Assumptions
- 2. Executive Summary
- 2.1. Market Snapshot
- 3. Market Dynamics
- 3.1. Market Drivers
- 3.2. Market Restrains
- 3.3. Market Trends
- 3.4. Market Opportunities
- 4. Market Factor Analysis
- 4.1. Porters Five Forces
- 4.1.1. Bargaining Power of Suppliers
- 4.1.2. Bargaining Power of Buyers
- 4.1.3. Threat of New Entrants
- 4.1.4. Threat of Substitutes
- 4.1.5. Competitive Rivalry
- 4.2. PESTEL analysis
- 4.3. BCG Analysis
- 4.3.1. Stars (High Growth, High Market Share)
- 4.3.2. Cash Cows (Low Growth, High Market Share)
- 4.3.3. Question Mark (High Growth, Low Market Share)
- 4.3.4. Dogs (Low Growth, Low Market Share)
- 4.4. Ansoff Matrix Analysis
- 4.5. Supply Chain Analysis
- 4.6. Regulatory Landscape
- 4.7. Current Market Potential and Opportunity Assessment (TAM–SAM–SOM Framework)
- 4.8. NRP Analyst Note
- 4.1. Porters Five Forces
- 5. Market Analysis, Insights and Forecast 2021-2033
- 5.1. Market Analysis, Insights and Forecast - by Type
- 5.1.1. Chain Hotels
- 5.1.2. Independent Hotels
- 5.2. Market Analysis, Insights and Forecast - by Segment
- 5.2.1. Service Apartments
- 5.2.2. Budget and Economy Hotels
- 5.2.3. Mid and Upper mid scale Hotels
- 5.2.4. Luxury Hotels
- 5.3. Market Analysis, Insights and Forecast - by Region
- 5.3.1. North America
- 5.3.2. South America
- 5.3.3. Europe
- 5.3.4. Middle East & Africa
- 5.3.5. Asia Pacific
- 5.1. Market Analysis, Insights and Forecast - by Type
- 6. Global Hospitality Industry in the Netherlands Analysis, Insights and Forecast, 2021-2033
- 6.1. Market Analysis, Insights and Forecast - by Type
- 6.1.1. Chain Hotels
- 6.1.2. Independent Hotels
- 6.2. Market Analysis, Insights and Forecast - by Segment
- 6.2.1. Service Apartments
- 6.2.2. Budget and Economy Hotels
- 6.2.3. Mid and Upper mid scale Hotels
- 6.2.4. Luxury Hotels
- 6.1. Market Analysis, Insights and Forecast - by Type
- 7. North America Hospitality Industry in the Netherlands Analysis, Insights and Forecast, 2020-2032
- 7.1. Market Analysis, Insights and Forecast - by Type
- 7.1.1. Chain Hotels
- 7.1.2. Independent Hotels
- 7.2. Market Analysis, Insights and Forecast - by Segment
- 7.2.1. Service Apartments
- 7.2.2. Budget and Economy Hotels
- 7.2.3. Mid and Upper mid scale Hotels
- 7.2.4. Luxury Hotels
- 7.1. Market Analysis, Insights and Forecast - by Type
- 8. South America Hospitality Industry in the Netherlands Analysis, Insights and Forecast, 2020-2032
- 8.1. Market Analysis, Insights and Forecast - by Type
- 8.1.1. Chain Hotels
- 8.1.2. Independent Hotels
- 8.2. Market Analysis, Insights and Forecast - by Segment
- 8.2.1. Service Apartments
- 8.2.2. Budget and Economy Hotels
- 8.2.3. Mid and Upper mid scale Hotels
- 8.2.4. Luxury Hotels
- 8.1. Market Analysis, Insights and Forecast - by Type
- 9. Europe Hospitality Industry in the Netherlands Analysis, Insights and Forecast, 2020-2032
- 9.1. Market Analysis, Insights and Forecast - by Type
- 9.1.1. Chain Hotels
- 9.1.2. Independent Hotels
- 9.2. Market Analysis, Insights and Forecast - by Segment
- 9.2.1. Service Apartments
- 9.2.2. Budget and Economy Hotels
- 9.2.3. Mid and Upper mid scale Hotels
- 9.2.4. Luxury Hotels
- 9.1. Market Analysis, Insights and Forecast - by Type
- 10. Middle East & Africa Hospitality Industry in the Netherlands Analysis, Insights and Forecast, 2020-2032
- 10.1. Market Analysis, Insights and Forecast - by Type
- 10.1.1. Chain Hotels
- 10.1.2. Independent Hotels
- 10.2. Market Analysis, Insights and Forecast - by Segment
- 10.2.1. Service Apartments
- 10.2.2. Budget and Economy Hotels
- 10.2.3. Mid and Upper mid scale Hotels
- 10.2.4. Luxury Hotels
- 10.1. Market Analysis, Insights and Forecast - by Type
- 11. Asia Pacific Hospitality Industry in the Netherlands Analysis, Insights and Forecast, 2020-2032
- 11.1. Market Analysis, Insights and Forecast - by Type
- 11.1.1. Chain Hotels
- 11.1.2. Independent Hotels
- 11.2. Market Analysis, Insights and Forecast - by Segment
- 11.2.1. Service Apartments
- 11.2.2. Budget and Economy Hotels
- 11.2.3. Mid and Upper mid scale Hotels
- 11.2.4. Luxury Hotels
- 11.1. Market Analysis, Insights and Forecast - by Type
- 12. Competitive Analysis
- 12.1. Company Profiles
- 12.1.1 Bastion Hotel Group
- 12.1.1.1. Company Overview
- 12.1.1.2. Products
- 12.1.1.3. Company Financials
- 12.1.1.4. SWOT Analysis
- 12.1.2 Louvre Hotels Group
- 12.1.2.1. Company Overview
- 12.1.2.2. Products
- 12.1.2.3. Company Financials
- 12.1.2.4. SWOT Analysis
- 12.1.3 Hilton Hotels &Resorts
- 12.1.3.1. Company Overview
- 12.1.3.2. Products
- 12.1.3.3. Company Financials
- 12.1.3.4. SWOT Analysis
- 12.1.4 InterContinental Hotel Group
- 12.1.4.1. Company Overview
- 12.1.4.2. Products
- 12.1.4.3. Company Financials
- 12.1.4.4. SWOT Analysis
- 12.1.5 Radisson Hotel Group**List Not Exhaustive 6 3 Loyalty programs offered by Major Hotel Brand
- 12.1.5.1. Company Overview
- 12.1.5.2. Products
- 12.1.5.3. Company Financials
- 12.1.5.4. SWOT Analysis
- 12.1.6 6 COMPETITVE INTELLIGENCE6 1 Market Concentration6 2 Company profiles
- 12.1.6.1. Company Overview
- 12.1.6.2. Products
- 12.1.6.3. Company Financials
- 12.1.6.4. SWOT Analysis
- 12.1.7 Van der Valk
- 12.1.7.1. Company Overview
- 12.1.7.2. Products
- 12.1.7.3. Company Financials
- 12.1.7.4. SWOT Analysis
- 12.1.8 Marriott International
- 12.1.8.1. Company Overview
- 12.1.8.2. Products
- 12.1.8.3. Company Financials
- 12.1.8.4. SWOT Analysis
- 12.1.9 AccorHotels
- 12.1.9.1. Company Overview
- 12.1.9.2. Products
- 12.1.9.3. Company Financials
- 12.1.9.4. SWOT Analysis
- 12.1.10 NH Hotels
- 12.1.10.1. Company Overview
- 12.1.10.2. Products
- 12.1.10.3. Company Financials
- 12.1.10.4. SWOT Analysis
- 12.1.11 Fletcher Hotel
- 12.1.11.1. Company Overview
- 12.1.11.2. Products
- 12.1.11.3. Company Financials
- 12.1.11.4. SWOT Analysis
- 12.1.1 Bastion Hotel Group
- 12.2. Market Entropy
- 12.2.1 Company's Key Areas Served
- 12.2.2 Recent Developments
- 12.3. Company Market Share Analysis 2025
- 12.3.1 Top 5 Companies Market Share Analysis
- 12.3.2 Top 3 Companies Market Share Analysis
- 12.4. List of Potential Customers
- 13. Research Methodology
List of Figures
- Figure 1: Global Hospitality Industry in the Netherlands Revenue Breakdown (billion, %) by Region 2025 & 2033
- Figure 2: North America Hospitality Industry in the Netherlands Revenue (billion), by Type 2025 & 2033
- Figure 3: North America Hospitality Industry in the Netherlands Revenue Share (%), by Type 2025 & 2033
- Figure 4: North America Hospitality Industry in the Netherlands Revenue (billion), by Segment 2025 & 2033
- Figure 5: North America Hospitality Industry in the Netherlands Revenue Share (%), by Segment 2025 & 2033
- Figure 6: North America Hospitality Industry in the Netherlands Revenue (billion), by Country 2025 & 2033
- Figure 7: North America Hospitality Industry in the Netherlands Revenue Share (%), by Country 2025 & 2033
- Figure 8: South America Hospitality Industry in the Netherlands Revenue (billion), by Type 2025 & 2033
- Figure 9: South America Hospitality Industry in the Netherlands Revenue Share (%), by Type 2025 & 2033
- Figure 10: South America Hospitality Industry in the Netherlands Revenue (billion), by Segment 2025 & 2033
- Figure 11: South America Hospitality Industry in the Netherlands Revenue Share (%), by Segment 2025 & 2033
- Figure 12: South America Hospitality Industry in the Netherlands Revenue (billion), by Country 2025 & 2033
- Figure 13: South America Hospitality Industry in the Netherlands Revenue Share (%), by Country 2025 & 2033
- Figure 14: Europe Hospitality Industry in the Netherlands Revenue (billion), by Type 2025 & 2033
- Figure 15: Europe Hospitality Industry in the Netherlands Revenue Share (%), by Type 2025 & 2033
- Figure 16: Europe Hospitality Industry in the Netherlands Revenue (billion), by Segment 2025 & 2033
- Figure 17: Europe Hospitality Industry in the Netherlands Revenue Share (%), by Segment 2025 & 2033
- Figure 18: Europe Hospitality Industry in the Netherlands Revenue (billion), by Country 2025 & 2033
- Figure 19: Europe Hospitality Industry in the Netherlands Revenue Share (%), by Country 2025 & 2033
- Figure 20: Middle East & Africa Hospitality Industry in the Netherlands Revenue (billion), by Type 2025 & 2033
- Figure 21: Middle East & Africa Hospitality Industry in the Netherlands Revenue Share (%), by Type 2025 & 2033
- Figure 22: Middle East & Africa Hospitality Industry in the Netherlands Revenue (billion), by Segment 2025 & 2033
- Figure 23: Middle East & Africa Hospitality Industry in the Netherlands Revenue Share (%), by Segment 2025 & 2033
- Figure 24: Middle East & Africa Hospitality Industry in the Netherlands Revenue (billion), by Country 2025 & 2033
- Figure 25: Middle East & Africa Hospitality Industry in the Netherlands Revenue Share (%), by Country 2025 & 2033
- Figure 26: Asia Pacific Hospitality Industry in the Netherlands Revenue (billion), by Type 2025 & 2033
- Figure 27: Asia Pacific Hospitality Industry in the Netherlands Revenue Share (%), by Type 2025 & 2033
- Figure 28: Asia Pacific Hospitality Industry in the Netherlands Revenue (billion), by Segment 2025 & 2033
- Figure 29: Asia Pacific Hospitality Industry in the Netherlands Revenue Share (%), by Segment 2025 & 2033
- Figure 30: Asia Pacific Hospitality Industry in the Netherlands Revenue (billion), by Country 2025 & 2033
- Figure 31: Asia Pacific Hospitality Industry in the Netherlands Revenue Share (%), by Country 2025 & 2033
List of Tables
- Table 1: Global Hospitality Industry in the Netherlands Revenue billion Forecast, by Type 2020 & 2033
- Table 2: Global Hospitality Industry in the Netherlands Revenue billion Forecast, by Segment 2020 & 2033
- Table 3: Global Hospitality Industry in the Netherlands Revenue billion Forecast, by Region 2020 & 2033
- Table 4: Global Hospitality Industry in the Netherlands Revenue billion Forecast, by Type 2020 & 2033
- Table 5: Global Hospitality Industry in the Netherlands Revenue billion Forecast, by Segment 2020 & 2033
- Table 6: Global Hospitality Industry in the Netherlands Revenue billion Forecast, by Country 2020 & 2033
- Table 7: United States Hospitality Industry in the Netherlands Revenue (billion) Forecast, by Application 2020 & 2033
- Table 8: Canada Hospitality Industry in the Netherlands Revenue (billion) Forecast, by Application 2020 & 2033
- Table 9: Mexico Hospitality Industry in the Netherlands Revenue (billion) Forecast, by Application 2020 & 2033
- Table 10: Global Hospitality Industry in the Netherlands Revenue billion Forecast, by Type 2020 & 2033
- Table 11: Global Hospitality Industry in the Netherlands Revenue billion Forecast, by Segment 2020 & 2033
- Table 12: Global Hospitality Industry in the Netherlands Revenue billion Forecast, by Country 2020 & 2033
- Table 13: Brazil Hospitality Industry in the Netherlands Revenue (billion) Forecast, by Application 2020 & 2033
- Table 14: Argentina Hospitality Industry in the Netherlands Revenue (billion) Forecast, by Application 2020 & 2033
- Table 15: Rest of South America Hospitality Industry in the Netherlands Revenue (billion) Forecast, by Application 2020 & 2033
- Table 16: Global Hospitality Industry in the Netherlands Revenue billion Forecast, by Type 2020 & 2033
- Table 17: Global Hospitality Industry in the Netherlands Revenue billion Forecast, by Segment 2020 & 2033
- Table 18: Global Hospitality Industry in the Netherlands Revenue billion Forecast, by Country 2020 & 2033
- Table 19: United Kingdom Hospitality Industry in the Netherlands Revenue (billion) Forecast, by Application 2020 & 2033
- Table 20: Germany Hospitality Industry in the Netherlands Revenue (billion) Forecast, by Application 2020 & 2033
- Table 21: France Hospitality Industry in the Netherlands Revenue (billion) Forecast, by Application 2020 & 2033
- Table 22: Italy Hospitality Industry in the Netherlands Revenue (billion) Forecast, by Application 2020 & 2033
- Table 23: Spain Hospitality Industry in the Netherlands Revenue (billion) Forecast, by Application 2020 & 2033
- Table 24: Russia Hospitality Industry in the Netherlands Revenue (billion) Forecast, by Application 2020 & 2033
- Table 25: Benelux Hospitality Industry in the Netherlands Revenue (billion) Forecast, by Application 2020 & 2033
- Table 26: Nordics Hospitality Industry in the Netherlands Revenue (billion) Forecast, by Application 2020 & 2033
- Table 27: Rest of Europe Hospitality Industry in the Netherlands Revenue (billion) Forecast, by Application 2020 & 2033
- Table 28: Global Hospitality Industry in the Netherlands Revenue billion Forecast, by Type 2020 & 2033
- Table 29: Global Hospitality Industry in the Netherlands Revenue billion Forecast, by Segment 2020 & 2033
- Table 30: Global Hospitality Industry in the Netherlands Revenue billion Forecast, by Country 2020 & 2033
- Table 31: Turkey Hospitality Industry in the Netherlands Revenue (billion) Forecast, by Application 2020 & 2033
- Table 32: Israel Hospitality Industry in the Netherlands Revenue (billion) Forecast, by Application 2020 & 2033
- Table 33: GCC Hospitality Industry in the Netherlands Revenue (billion) Forecast, by Application 2020 & 2033
- Table 34: North Africa Hospitality Industry in the Netherlands Revenue (billion) Forecast, by Application 2020 & 2033
- Table 35: South Africa Hospitality Industry in the Netherlands Revenue (billion) Forecast, by Application 2020 & 2033
- Table 36: Rest of Middle East & Africa Hospitality Industry in the Netherlands Revenue (billion) Forecast, by Application 2020 & 2033
- Table 37: Global Hospitality Industry in the Netherlands Revenue billion Forecast, by Type 2020 & 2033
- Table 38: Global Hospitality Industry in the Netherlands Revenue billion Forecast, by Segment 2020 & 2033
- Table 39: Global Hospitality Industry in the Netherlands Revenue billion Forecast, by Country 2020 & 2033
- Table 40: China Hospitality Industry in the Netherlands Revenue (billion) Forecast, by Application 2020 & 2033
- Table 41: India Hospitality Industry in the Netherlands Revenue (billion) Forecast, by Application 2020 & 2033
- Table 42: Japan Hospitality Industry in the Netherlands Revenue (billion) Forecast, by Application 2020 & 2033
- Table 43: South Korea Hospitality Industry in the Netherlands Revenue (billion) Forecast, by Application 2020 & 2033
- Table 44: ASEAN Hospitality Industry in the Netherlands Revenue (billion) Forecast, by Application 2020 & 2033
- Table 45: Oceania Hospitality Industry in the Netherlands Revenue (billion) Forecast, by Application 2020 & 2033
- Table 46: Rest of Asia Pacific Hospitality Industry in the Netherlands Revenue (billion) Forecast, by Application 2020 & 2033
Frequently Asked Questions
1. What is the projected Compound Annual Growth Rate (CAGR) of the Hospitality Industry in the Netherlands?
The projected CAGR is approximately 3.5%.
2. Which companies are prominent players in the Hospitality Industry in the Netherlands?
Key companies in the market include Bastion Hotel Group, Louvre Hotels Group, Hilton Hotels &Resorts, InterContinental Hotel Group, Radisson Hotel Group**List Not Exhaustive 6 3 Loyalty programs offered by Major Hotel Brand, 6 COMPETITVE INTELLIGENCE6 1 Market Concentration6 2 Company profiles, Van der Valk, Marriott International, AccorHotels, NH Hotels, Fletcher Hotel.
3. What are the main segments of the Hospitality Industry in the Netherlands?
The market segments include Type, Segment.
4. Can you provide details about the market size?
The market size is estimated to be USD 3.95 billion as of 2022.
5. What are some drivers contributing to market growth?
4.; Contribution to the Economy to Generate Income for the Nation.
6. What are the notable trends driving market growth?
Tier-II Cities Are Going to Attract More Investors Thus Driving The Industry.
7. Are there any restraints impacting market growth?
4.; Long Hours of Working Pattern.
8. Can you provide examples of recent developments in the market?
January 2023: InterContinental Hotel Group, Netherlands, took the initiative on an Augmented Reality (AR) hotel art tour where visitors can interact virtually with 10 artworks in the hotel's collection, supplemented by computer-generated graphics and sound as well as written or audio narratives about the piece and artist.
9. What pricing options are available for accessing the report?
Pricing options include single-user, multi-user, and enterprise licenses priced at USD 3800, USD 4500, and USD 5800 respectively.
10. Is the market size provided in terms of value or volume?
The market size is provided in terms of value, measured in billion.
11. Are there any specific market keywords associated with the report?
Yes, the market keyword associated with the report is "Hospitality Industry in the Netherlands," which aids in identifying and referencing the specific market segment covered.
12. How do I determine which pricing option suits my needs best?
The pricing options vary based on user requirements and access needs. Individual users may opt for single-user licenses, while businesses requiring broader access may choose multi-user or enterprise licenses for cost-effective access to the report.
13. Are there any additional resources or data provided in the Hospitality Industry in the Netherlands report?
While the report offers comprehensive insights, it's advisable to review the specific contents or supplementary materials provided to ascertain if additional resources or data are available.
14. How can I stay updated on further developments or reports in the Hospitality Industry in the Netherlands?
To stay informed about further developments, trends, and reports in the Hospitality Industry in the Netherlands, consider subscribing to industry newsletters, following relevant companies and organizations, or regularly checking reputable industry news sources and publications.
Methodology
Step 1 - Identification of Relevant Samples Size from Population Database


Step 2 - Approaches for Defining Global Market Size (Value, Volume* & Price*)

Note*: In applicable scenarios
Step 3 - Data Sources
Primary Research
- Web Analytics
- Survey Reports
- Research Institute
- Latest Research Reports
- Opinion Leaders
Secondary Research
- Annual Reports
- White Paper
- Latest Press Release
- Industry Association
- Paid Database
- Investor Presentations

Step 4 - Data Triangulation
Involves using different sources of information in order to increase the validity of a study
These sources are likely to be stakeholders in a program - participants, other researchers, program staff, other community members, and so on.
Then we put all data in single framework & apply various statistical tools to find out the dynamic on the market.
During the analysis stage, feedback from the stakeholder groups would be compared to determine areas of agreement as well as areas of divergence