

Key Insights
The industrial software market is experiencing robust growth, driven by the increasing adoption of Industry 4.0 technologies and the expanding need for digital transformation across manufacturing and other industrial sectors. The market, currently estimated at $150 billion in 2025, is projected to maintain a healthy Compound Annual Growth Rate (CAGR) of 7% from 2025 to 2033. This growth is fueled by several key factors. Firstly, the rising demand for enhanced operational efficiency, predictive maintenance, and real-time data analytics is pushing industries to invest heavily in sophisticated software solutions. Secondly, the increasing complexity of industrial processes necessitates advanced software for automation, simulation, and optimization. Thirdly, the growing adoption of cloud-based solutions and the rise of Artificial Intelligence (AI) and Machine Learning (ML) are transforming how industrial software is deployed and utilized. Companies like Siemens PLM, Autodesk, and Rockwell Automation are leading the charge, offering comprehensive solutions that cater to diverse industrial needs. However, the market faces challenges such as the high initial investment costs associated with implementing new software and the need for skilled personnel to operate and maintain these systems. Furthermore, ensuring cybersecurity and data privacy within these interconnected industrial environments presents a significant hurdle.
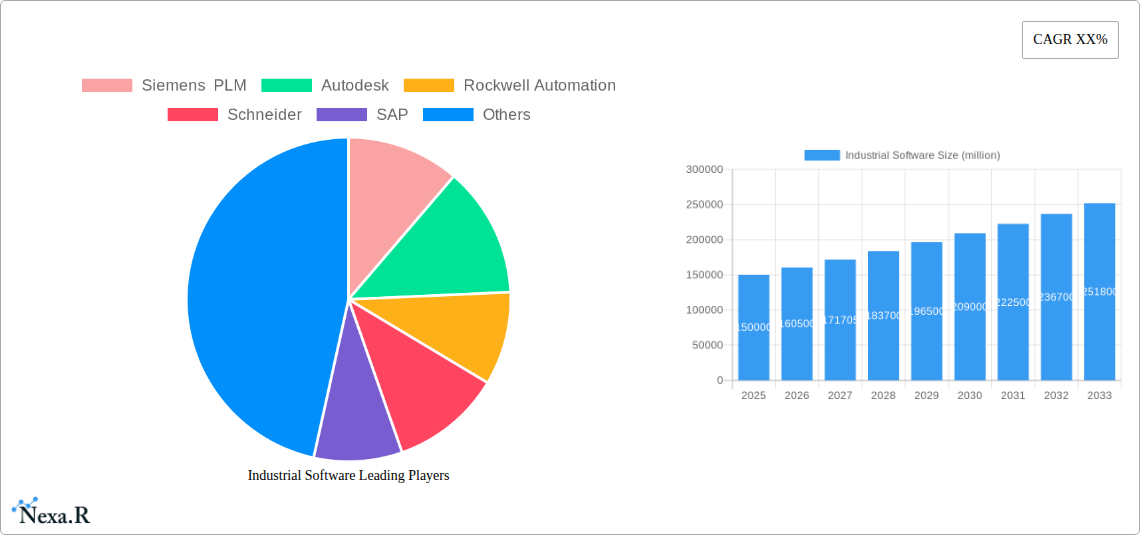
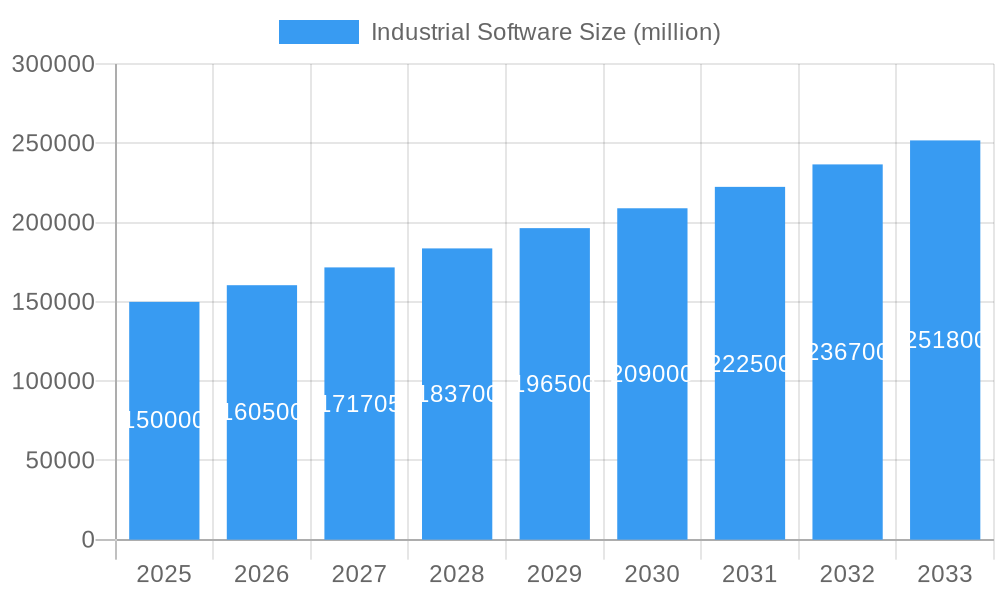
Industrial Software Market Size (In Billion)
Despite these challenges, the long-term outlook for the industrial software market remains positive. The continued integration of advanced technologies, the expanding adoption of digital twins, and the growing focus on sustainable manufacturing practices are all expected to contribute to sustained growth. Regional variations exist, with North America and Europe currently dominating the market, but developing economies in Asia-Pacific and Latin America present significant growth opportunities. The market is segmented into various categories including Manufacturing Execution Systems (MES), Computer-Aided Design (CAD), Product Lifecycle Management (PLM), and Enterprise Resource Planning (ERP) software. The strategic partnerships, mergers, and acquisitions within the industry are likely to further shape the market landscape in the coming years, intensifying competition and driving innovation. Ultimately, the market's success hinges on the continued adoption of digitalization initiatives across various industries and the ongoing development of more robust and user-friendly software solutions.
Industrial Software Company Market Share
Industrial Software Market Report: 2019-2033
Uncover the transformative power of industrial software and its impact on manufacturing, energy, and beyond. This comprehensive report provides a deep dive into market dynamics, growth trends, leading players, and future prospects.
Study Period: 2019-2033 Base Year: 2025 Estimated Year: 2025 Forecast Period: 2025-2033 Historical Period: 2019-2024
Industrial Software Market Dynamics & Structure
The industrial software market, valued at $xx million in 2024, is characterized by a moderately concentrated landscape, with key players like Siemens PLM, Autodesk, and Rockwell Automation holding significant market share. Technological innovation, particularly in areas like AI, IoT, and cloud computing, is a primary growth driver. Stringent regulatory frameworks concerning data security and operational safety influence market dynamics. The rise of Industry 4.0 and the increasing demand for digital transformation are pushing adoption rates higher. Meanwhile, competitive pressures from open-source solutions and alternative software providers present a challenge. Mergers and acquisitions (M&A) activity remains robust, with an estimated xx M&A deals in the last five years, reflecting consolidation and expansion efforts among major players.
- Market Concentration: High, with top 5 players holding approximately xx% of the market share in 2024.
- Technological Innovation Drivers: AI, IoT, Cloud Computing, Digital Twins, and Advanced Analytics.
- Regulatory Frameworks: Data privacy regulations (GDPR, CCPA), cybersecurity standards (NIST), and industry-specific compliance requirements.
- Competitive Product Substitutes: Open-source software, niche specialized software, and legacy systems.
- End-User Demographics: Manufacturing, Energy, Transportation, Healthcare, and other industrial sectors.
- M&A Trends: Consolidation among established players, acquisitions of smaller specialized firms to expand product portfolios and technological capabilities.
Industrial Software Growth Trends & Insights
The industrial software market demonstrates strong growth momentum, exhibiting a CAGR of xx% during the historical period (2019-2024) and projected to reach $xx million by 2033. This growth is fueled by several factors, including the increasing adoption of digitalization strategies across various industries, the rise of smart factories and connected devices, and ongoing technological advancements. The market penetration of industrial software solutions is expected to increase significantly in developing economies due to industrialization and government initiatives. However, challenges such as high implementation costs, integration complexities, and the need for skilled professionals could hinder market growth to some extent. Consumer behavior is shifting towards cloud-based solutions and subscription models, necessitating adaptation among vendors.
(Note: This section requires data from source XXX to populate the specific metrics.)
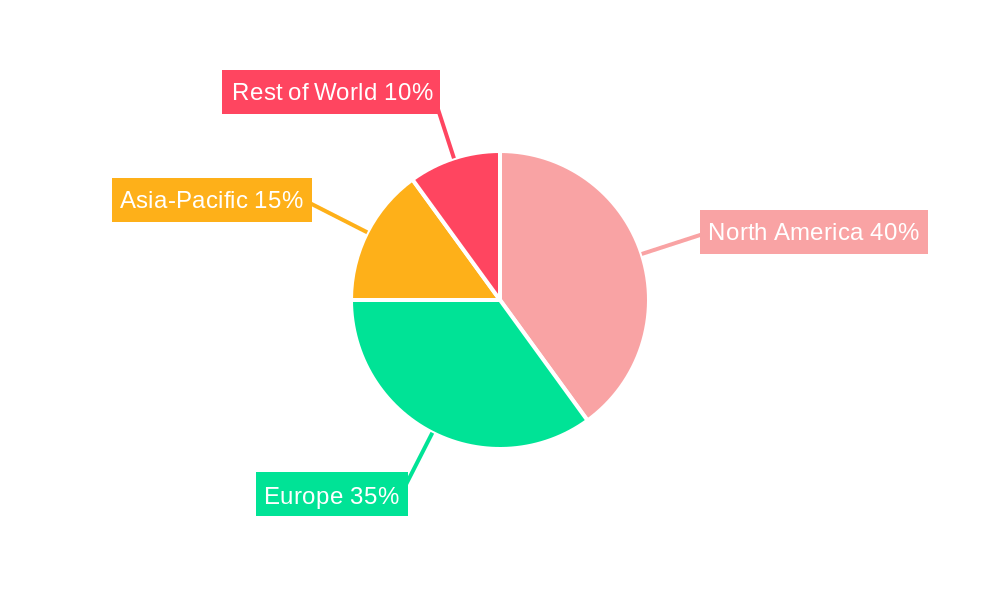
Dominant Regions, Countries, or Segments in Industrial Software
North America currently holds the largest market share in industrial software, driven by a strong manufacturing base, advanced technological infrastructure, and early adoption of Industry 4.0 technologies. Europe follows closely, with significant contributions from Germany and the UK. Asia-Pacific is expected to witness significant growth in the coming years, fueled by rapid industrialization and increasing government investments in digital infrastructure.
- North America: High adoption rates, strong technological ecosystem, significant investment in R&D.
- Europe: Strong presence of major industrial players, high focus on digital transformation initiatives.
- Asia-Pacific: Rapid industrialization, increasing government support for digitalization, expanding manufacturing sector.
Industrial Software Product Landscape
The industrial software landscape encompasses a wide range of solutions, including manufacturing execution systems (MES), enterprise resource planning (ERP) systems for industrial use, product lifecycle management (PLM) software, and advanced process control (APC) systems. These solutions are characterized by increasing integration with IoT platforms, advanced analytics capabilities, and cloud-based deployment options. Unique selling propositions often revolve around ease of use, seamless integration with existing systems, and enhanced operational efficiency. Significant advancements are being seen in AI-powered predictive maintenance and real-time process optimization functionalities.
Key Drivers, Barriers & Challenges in Industrial Software
Key Drivers:
- Increasing demand for operational efficiency and productivity gains.
- Growth of Industry 4.0 and the Industrial Internet of Things (IIoT).
- Government initiatives promoting digitalization and automation.
- Technological advancements driving innovation and creating new possibilities.
Key Barriers & Challenges:
- High initial investment costs and implementation complexities.
- Skill gap and shortage of qualified personnel to manage and implement these systems.
- Concerns regarding data security and cyber risks.
- Integration challenges with existing legacy systems.
- Competitive pressures and pricing strategies among vendors.
Emerging Opportunities in Industrial Software
- The growing adoption of cloud-based solutions and the increasing demand for Software as a Service (SaaS) models.
- Expansion into new and emerging markets such as developing economies.
- Development of specialized software solutions tailored to specific industries and needs.
- Integration of new technologies such as artificial intelligence and blockchain.
Growth Accelerators in the Industrial Software Industry
The long-term growth of the industrial software market is likely to be driven by several key factors, including the continuing digital transformation journey of industrial enterprises, the increasing adoption of advanced analytics, the growth of the IIoT and smart manufacturing initiatives, and the emergence of new technologies such as augmented reality and digital twins. Strategic partnerships and collaborations among software providers, hardware manufacturers, and industrial automation companies will further accelerate growth and market penetration.
Key Players Shaping the Industrial Software Market
- Siemens PLM
- Autodesk
- Rockwell Automation
- Schneider Electric
- SAP
- Oracle
- Honeywell
- ABB
- Dassault Systèmes
- HCL Technologies
Notable Milestones in Industrial Software Sector
- 2020: Increased adoption of cloud-based industrial software solutions due to the pandemic.
- 2021: Significant investments in AI and machine learning for predictive maintenance applications.
- 2022: Launch of several new digital twin platforms by major industrial software vendors.
- 2023: Several mergers and acquisitions to expand product portfolios and market reach. (Specific details need to be added based on data)
In-Depth Industrial Software Market Outlook
The future of the industrial software market appears bright, with continued growth driven by technological innovation, increasing digitalization across industries, and a growing need for enhanced operational efficiency. Strategic opportunities exist for companies that can effectively address the challenges of data security, integration complexities, and skill gaps. Focus on developing innovative solutions tailored to specific industry needs, coupled with strong partnerships and strategic alliances, will be key to capturing market share and achieving long-term success in this rapidly evolving landscape.
Industrial Software Segmentation
-
1. Application
- 1.1. Product Design
- 1.2. Outfit Design
- 1.3. Plant Design
- 1.4. Industrial System Design
-
2. Types
- 2.1. On-premises
- 2.2. Cloud Based
Industrial Software Segmentation By Geography
-
1. North America
- 1.1. United States
- 1.2. Canada
- 1.3. Mexico
-
2. South America
- 2.1. Brazil
- 2.2. Argentina
- 2.3. Rest of South America
-
3. Europe
- 3.1. United Kingdom
- 3.2. Germany
- 3.3. France
- 3.4. Italy
- 3.5. Spain
- 3.6. Russia
- 3.7. Benelux
- 3.8. Nordics
- 3.9. Rest of Europe
-
4. Middle East & Africa
- 4.1. Turkey
- 4.2. Israel
- 4.3. GCC
- 4.4. North Africa
- 4.5. South Africa
- 4.6. Rest of Middle East & Africa
-
5. Asia Pacific
- 5.1. China
- 5.2. India
- 5.3. Japan
- 5.4. South Korea
- 5.5. ASEAN
- 5.6. Oceania
- 5.7. Rest of Asia Pacific
Industrial Software Regional Market Share
Geographic Coverage of Industrial Software
Industrial Software REPORT HIGHLIGHTS
| Aspects | Details |
|---|---|
| Study Period | 2020-2034 |
| Base Year | 2025 |
| Estimated Year | 2026 |
| Forecast Period | 2026-2034 |
| Historical Period | 2020-2025 |
| Growth Rate | CAGR of 11.6% from 2020-2034 |
| Segmentation |
|
Table of Contents
- 1. Introduction
- 1.1. Research Scope
- 1.2. Market Segmentation
- 1.3. Research Objective
- 1.4. Definitions and Assumptions
- 2. Executive Summary
- 2.1. Market Snapshot
- 3. Market Dynamics
- 3.1. Market Drivers
- 3.2. Market Restrains
- 3.3. Market Trends
- 3.4. Market Opportunities
- 4. Market Factor Analysis
- 4.1. Porters Five Forces
- 4.1.1. Bargaining Power of Suppliers
- 4.1.2. Bargaining Power of Buyers
- 4.1.3. Threat of New Entrants
- 4.1.4. Threat of Substitutes
- 4.1.5. Competitive Rivalry
- 4.2. PESTEL analysis
- 4.3. BCG Analysis
- 4.3.1. Stars (High Growth, High Market Share)
- 4.3.2. Cash Cows (Low Growth, High Market Share)
- 4.3.3. Question Mark (High Growth, Low Market Share)
- 4.3.4. Dogs (Low Growth, Low Market Share)
- 4.4. Ansoff Matrix Analysis
- 4.5. Supply Chain Analysis
- 4.6. Regulatory Landscape
- 4.7. Current Market Potential and Opportunity Assessment (TAM–SAM–SOM Framework)
- 4.8. NRP Analyst Note
- 4.1. Porters Five Forces
- 5. Market Analysis, Insights and Forecast 2021-2033
- 5.1. Market Analysis, Insights and Forecast - by Application
- 5.1.1. Product Design
- 5.1.2. Outfit Design
- 5.1.3. Plant Design
- 5.1.4. Industrial System Design
- 5.2. Market Analysis, Insights and Forecast - by Types
- 5.2.1. On-premises
- 5.2.2. Cloud Based
- 5.3. Market Analysis, Insights and Forecast - by Region
- 5.3.1. North America
- 5.3.2. South America
- 5.3.3. Europe
- 5.3.4. Middle East & Africa
- 5.3.5. Asia Pacific
- 5.1. Market Analysis, Insights and Forecast - by Application
- 6. Global Industrial Software Analysis, Insights and Forecast, 2021-2033
- 6.1. Market Analysis, Insights and Forecast - by Application
- 6.1.1. Product Design
- 6.1.2. Outfit Design
- 6.1.3. Plant Design
- 6.1.4. Industrial System Design
- 6.2. Market Analysis, Insights and Forecast - by Types
- 6.2.1. On-premises
- 6.2.2. Cloud Based
- 6.1. Market Analysis, Insights and Forecast - by Application
- 7. North America Industrial Software Analysis, Insights and Forecast, 2020-2032
- 7.1. Market Analysis, Insights and Forecast - by Application
- 7.1.1. Product Design
- 7.1.2. Outfit Design
- 7.1.3. Plant Design
- 7.1.4. Industrial System Design
- 7.2. Market Analysis, Insights and Forecast - by Types
- 7.2.1. On-premises
- 7.2.2. Cloud Based
- 7.1. Market Analysis, Insights and Forecast - by Application
- 8. South America Industrial Software Analysis, Insights and Forecast, 2020-2032
- 8.1. Market Analysis, Insights and Forecast - by Application
- 8.1.1. Product Design
- 8.1.2. Outfit Design
- 8.1.3. Plant Design
- 8.1.4. Industrial System Design
- 8.2. Market Analysis, Insights and Forecast - by Types
- 8.2.1. On-premises
- 8.2.2. Cloud Based
- 8.1. Market Analysis, Insights and Forecast - by Application
- 9. Europe Industrial Software Analysis, Insights and Forecast, 2020-2032
- 9.1. Market Analysis, Insights and Forecast - by Application
- 9.1.1. Product Design
- 9.1.2. Outfit Design
- 9.1.3. Plant Design
- 9.1.4. Industrial System Design
- 9.2. Market Analysis, Insights and Forecast - by Types
- 9.2.1. On-premises
- 9.2.2. Cloud Based
- 9.1. Market Analysis, Insights and Forecast - by Application
- 10. Middle East & Africa Industrial Software Analysis, Insights and Forecast, 2020-2032
- 10.1. Market Analysis, Insights and Forecast - by Application
- 10.1.1. Product Design
- 10.1.2. Outfit Design
- 10.1.3. Plant Design
- 10.1.4. Industrial System Design
- 10.2. Market Analysis, Insights and Forecast - by Types
- 10.2.1. On-premises
- 10.2.2. Cloud Based
- 10.1. Market Analysis, Insights and Forecast - by Application
- 11. Asia Pacific Industrial Software Analysis, Insights and Forecast, 2020-2032
- 11.1. Market Analysis, Insights and Forecast - by Application
- 11.1.1. Product Design
- 11.1.2. Outfit Design
- 11.1.3. Plant Design
- 11.1.4. Industrial System Design
- 11.2. Market Analysis, Insights and Forecast - by Types
- 11.2.1. On-premises
- 11.2.2. Cloud Based
- 11.1. Market Analysis, Insights and Forecast - by Application
- 12. Competitive Analysis
- 12.1. Company Profiles
- 12.1.1 Siemens PLM
- 12.1.1.1. Company Overview
- 12.1.1.2. Products
- 12.1.1.3. Company Financials
- 12.1.1.4. SWOT Analysis
- 12.1.2 Autodesk
- 12.1.2.1. Company Overview
- 12.1.2.2. Products
- 12.1.2.3. Company Financials
- 12.1.2.4. SWOT Analysis
- 12.1.3 Rockwell Automation
- 12.1.3.1. Company Overview
- 12.1.3.2. Products
- 12.1.3.3. Company Financials
- 12.1.3.4. SWOT Analysis
- 12.1.4 Schneider
- 12.1.4.1. Company Overview
- 12.1.4.2. Products
- 12.1.4.3. Company Financials
- 12.1.4.4. SWOT Analysis
- 12.1.5 SAP
- 12.1.5.1. Company Overview
- 12.1.5.2. Products
- 12.1.5.3. Company Financials
- 12.1.5.4. SWOT Analysis
- 12.1.6 Oracle
- 12.1.6.1. Company Overview
- 12.1.6.2. Products
- 12.1.6.3. Company Financials
- 12.1.6.4. SWOT Analysis
- 12.1.7 Honeywell
- 12.1.7.1. Company Overview
- 12.1.7.2. Products
- 12.1.7.3. Company Financials
- 12.1.7.4. SWOT Analysis
- 12.1.8 ABB
- 12.1.8.1. Company Overview
- 12.1.8.2. Products
- 12.1.8.3. Company Financials
- 12.1.8.4. SWOT Analysis
- 12.1.9 Dassault Systèmes
- 12.1.9.1. Company Overview
- 12.1.9.2. Products
- 12.1.9.3. Company Financials
- 12.1.9.4. SWOT Analysis
- 12.1.10 HCL Technologies
- 12.1.10.1. Company Overview
- 12.1.10.2. Products
- 12.1.10.3. Company Financials
- 12.1.10.4. SWOT Analysis
- 12.1.1 Siemens PLM
- 12.2. Market Entropy
- 12.2.1 Company's Key Areas Served
- 12.2.2 Recent Developments
- 12.3. Company Market Share Analysis 2025
- 12.3.1 Top 5 Companies Market Share Analysis
- 12.3.2 Top 3 Companies Market Share Analysis
- 12.4. List of Potential Customers
- 13. Research Methodology
List of Figures
- Figure 1: Global Industrial Software Revenue Breakdown (billion, %) by Region 2025 & 2033
- Figure 2: North America Industrial Software Revenue (billion), by Application 2025 & 2033
- Figure 3: North America Industrial Software Revenue Share (%), by Application 2025 & 2033
- Figure 4: North America Industrial Software Revenue (billion), by Types 2025 & 2033
- Figure 5: North America Industrial Software Revenue Share (%), by Types 2025 & 2033
- Figure 6: North America Industrial Software Revenue (billion), by Country 2025 & 2033
- Figure 7: North America Industrial Software Revenue Share (%), by Country 2025 & 2033
- Figure 8: South America Industrial Software Revenue (billion), by Application 2025 & 2033
- Figure 9: South America Industrial Software Revenue Share (%), by Application 2025 & 2033
- Figure 10: South America Industrial Software Revenue (billion), by Types 2025 & 2033
- Figure 11: South America Industrial Software Revenue Share (%), by Types 2025 & 2033
- Figure 12: South America Industrial Software Revenue (billion), by Country 2025 & 2033
- Figure 13: South America Industrial Software Revenue Share (%), by Country 2025 & 2033
- Figure 14: Europe Industrial Software Revenue (billion), by Application 2025 & 2033
- Figure 15: Europe Industrial Software Revenue Share (%), by Application 2025 & 2033
- Figure 16: Europe Industrial Software Revenue (billion), by Types 2025 & 2033
- Figure 17: Europe Industrial Software Revenue Share (%), by Types 2025 & 2033
- Figure 18: Europe Industrial Software Revenue (billion), by Country 2025 & 2033
- Figure 19: Europe Industrial Software Revenue Share (%), by Country 2025 & 2033
- Figure 20: Middle East & Africa Industrial Software Revenue (billion), by Application 2025 & 2033
- Figure 21: Middle East & Africa Industrial Software Revenue Share (%), by Application 2025 & 2033
- Figure 22: Middle East & Africa Industrial Software Revenue (billion), by Types 2025 & 2033
- Figure 23: Middle East & Africa Industrial Software Revenue Share (%), by Types 2025 & 2033
- Figure 24: Middle East & Africa Industrial Software Revenue (billion), by Country 2025 & 2033
- Figure 25: Middle East & Africa Industrial Software Revenue Share (%), by Country 2025 & 2033
- Figure 26: Asia Pacific Industrial Software Revenue (billion), by Application 2025 & 2033
- Figure 27: Asia Pacific Industrial Software Revenue Share (%), by Application 2025 & 2033
- Figure 28: Asia Pacific Industrial Software Revenue (billion), by Types 2025 & 2033
- Figure 29: Asia Pacific Industrial Software Revenue Share (%), by Types 2025 & 2033
- Figure 30: Asia Pacific Industrial Software Revenue (billion), by Country 2025 & 2033
- Figure 31: Asia Pacific Industrial Software Revenue Share (%), by Country 2025 & 2033
List of Tables
- Table 1: Global Industrial Software Revenue billion Forecast, by Application 2020 & 2033
- Table 2: Global Industrial Software Revenue billion Forecast, by Types 2020 & 2033
- Table 3: Global Industrial Software Revenue billion Forecast, by Region 2020 & 2033
- Table 4: Global Industrial Software Revenue billion Forecast, by Application 2020 & 2033
- Table 5: Global Industrial Software Revenue billion Forecast, by Types 2020 & 2033
- Table 6: Global Industrial Software Revenue billion Forecast, by Country 2020 & 2033
- Table 7: United States Industrial Software Revenue (billion) Forecast, by Application 2020 & 2033
- Table 8: Canada Industrial Software Revenue (billion) Forecast, by Application 2020 & 2033
- Table 9: Mexico Industrial Software Revenue (billion) Forecast, by Application 2020 & 2033
- Table 10: Global Industrial Software Revenue billion Forecast, by Application 2020 & 2033
- Table 11: Global Industrial Software Revenue billion Forecast, by Types 2020 & 2033
- Table 12: Global Industrial Software Revenue billion Forecast, by Country 2020 & 2033
- Table 13: Brazil Industrial Software Revenue (billion) Forecast, by Application 2020 & 2033
- Table 14: Argentina Industrial Software Revenue (billion) Forecast, by Application 2020 & 2033
- Table 15: Rest of South America Industrial Software Revenue (billion) Forecast, by Application 2020 & 2033
- Table 16: Global Industrial Software Revenue billion Forecast, by Application 2020 & 2033
- Table 17: Global Industrial Software Revenue billion Forecast, by Types 2020 & 2033
- Table 18: Global Industrial Software Revenue billion Forecast, by Country 2020 & 2033
- Table 19: United Kingdom Industrial Software Revenue (billion) Forecast, by Application 2020 & 2033
- Table 20: Germany Industrial Software Revenue (billion) Forecast, by Application 2020 & 2033
- Table 21: France Industrial Software Revenue (billion) Forecast, by Application 2020 & 2033
- Table 22: Italy Industrial Software Revenue (billion) Forecast, by Application 2020 & 2033
- Table 23: Spain Industrial Software Revenue (billion) Forecast, by Application 2020 & 2033
- Table 24: Russia Industrial Software Revenue (billion) Forecast, by Application 2020 & 2033
- Table 25: Benelux Industrial Software Revenue (billion) Forecast, by Application 2020 & 2033
- Table 26: Nordics Industrial Software Revenue (billion) Forecast, by Application 2020 & 2033
- Table 27: Rest of Europe Industrial Software Revenue (billion) Forecast, by Application 2020 & 2033
- Table 28: Global Industrial Software Revenue billion Forecast, by Application 2020 & 2033
- Table 29: Global Industrial Software Revenue billion Forecast, by Types 2020 & 2033
- Table 30: Global Industrial Software Revenue billion Forecast, by Country 2020 & 2033
- Table 31: Turkey Industrial Software Revenue (billion) Forecast, by Application 2020 & 2033
- Table 32: Israel Industrial Software Revenue (billion) Forecast, by Application 2020 & 2033
- Table 33: GCC Industrial Software Revenue (billion) Forecast, by Application 2020 & 2033
- Table 34: North Africa Industrial Software Revenue (billion) Forecast, by Application 2020 & 2033
- Table 35: South Africa Industrial Software Revenue (billion) Forecast, by Application 2020 & 2033
- Table 36: Rest of Middle East & Africa Industrial Software Revenue (billion) Forecast, by Application 2020 & 2033
- Table 37: Global Industrial Software Revenue billion Forecast, by Application 2020 & 2033
- Table 38: Global Industrial Software Revenue billion Forecast, by Types 2020 & 2033
- Table 39: Global Industrial Software Revenue billion Forecast, by Country 2020 & 2033
- Table 40: China Industrial Software Revenue (billion) Forecast, by Application 2020 & 2033
- Table 41: India Industrial Software Revenue (billion) Forecast, by Application 2020 & 2033
- Table 42: Japan Industrial Software Revenue (billion) Forecast, by Application 2020 & 2033
- Table 43: South Korea Industrial Software Revenue (billion) Forecast, by Application 2020 & 2033
- Table 44: ASEAN Industrial Software Revenue (billion) Forecast, by Application 2020 & 2033
- Table 45: Oceania Industrial Software Revenue (billion) Forecast, by Application 2020 & 2033
- Table 46: Rest of Asia Pacific Industrial Software Revenue (billion) Forecast, by Application 2020 & 2033
Frequently Asked Questions
1. What is the projected Compound Annual Growth Rate (CAGR) of the Industrial Software?
The projected CAGR is approximately 11.6%.
2. Which companies are prominent players in the Industrial Software?
Key companies in the market include Siemens PLM, Autodesk, Rockwell Automation, Schneider, SAP, Oracle, Honeywell, ABB, Dassault Systèmes, HCL Technologies.
3. What are the main segments of the Industrial Software?
The market segments include Application, Types.
4. Can you provide details about the market size?
The market size is estimated to be USD 823.92 billion as of 2022.
5. What are some drivers contributing to market growth?
N/A
6. What are the notable trends driving market growth?
N/A
7. Are there any restraints impacting market growth?
N/A
8. Can you provide examples of recent developments in the market?
N/A
9. What pricing options are available for accessing the report?
Pricing options include single-user, multi-user, and enterprise licenses priced at USD 4900.00, USD 7350.00, and USD 9800.00 respectively.
10. Is the market size provided in terms of value or volume?
The market size is provided in terms of value, measured in billion.
11. Are there any specific market keywords associated with the report?
Yes, the market keyword associated with the report is "Industrial Software," which aids in identifying and referencing the specific market segment covered.
12. How do I determine which pricing option suits my needs best?
The pricing options vary based on user requirements and access needs. Individual users may opt for single-user licenses, while businesses requiring broader access may choose multi-user or enterprise licenses for cost-effective access to the report.
13. Are there any additional resources or data provided in the Industrial Software report?
While the report offers comprehensive insights, it's advisable to review the specific contents or supplementary materials provided to ascertain if additional resources or data are available.
14. How can I stay updated on further developments or reports in the Industrial Software?
To stay informed about further developments, trends, and reports in the Industrial Software, consider subscribing to industry newsletters, following relevant companies and organizations, or regularly checking reputable industry news sources and publications.
Methodology
Step 1 - Identification of Relevant Samples Size from Population Database


Step 2 - Approaches for Defining Global Market Size (Value, Volume* & Price*)

Note*: In applicable scenarios
Step 3 - Data Sources
Primary Research
- Web Analytics
- Survey Reports
- Research Institute
- Latest Research Reports
- Opinion Leaders
Secondary Research
- Annual Reports
- White Paper
- Latest Press Release
- Industry Association
- Paid Database
- Investor Presentations

Step 4 - Data Triangulation
Involves using different sources of information in order to increase the validity of a study
These sources are likely to be stakeholders in a program - participants, other researchers, program staff, other community members, and so on.
Then we put all data in single framework & apply various statistical tools to find out the dynamic on the market.
During the analysis stage, feedback from the stakeholder groups would be compared to determine areas of agreement as well as areas of divergence