

Key Insights
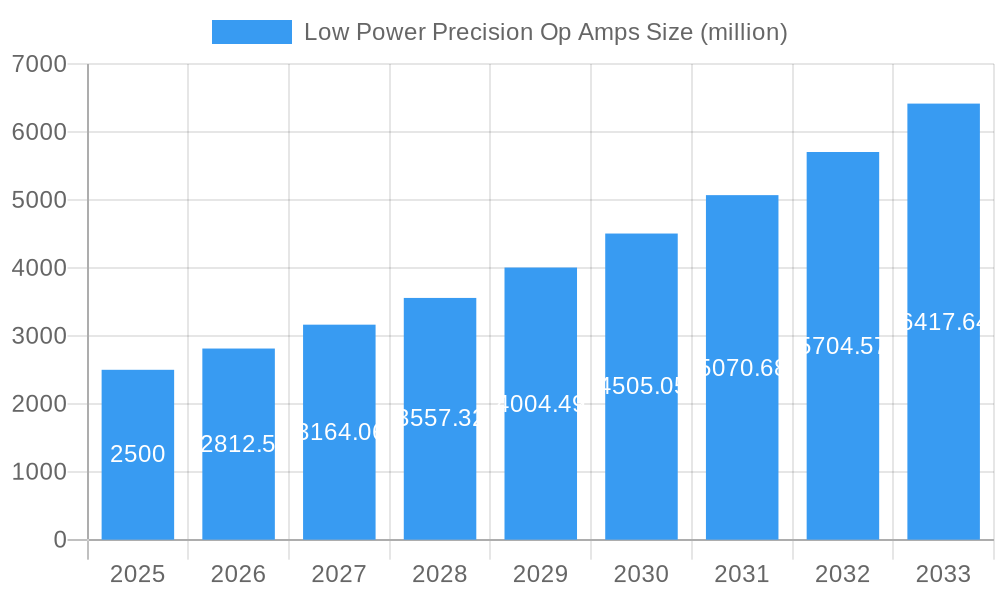
The global Low Power Precision Operational Amplifiers (Op Amps) market is projected to experience robust growth, with an estimated market size of USD 2,500 million in 2025 and a Compound Annual Growth Rate (CAGR) of 12.5% during the forecast period of 2025-2033. This expansion is primarily driven by the increasing demand for sophisticated electronic devices across various sectors, including the automotive industry, medical technology, and industrial automation. The proliferation of Internet of Things (IoT) devices, which require highly efficient and accurate sensing and signal conditioning capabilities, is a significant catalyst. Furthermore, advancements in miniaturization and power management within semiconductor technology are enabling the integration of low-power op amps into an ever-wider array of portable and battery-operated products, thereby fueling market adoption. The trend towards higher integration and the development of op amps with enhanced precision, reduced noise, and superior bandwidth are key technological drivers.
Low Power Precision Op Amps Market Size (In Billion)
The market is segmented by application, with Automatic Control Systems and Medical Instruments expected to represent the largest shares due to their critical reliance on precise analog signal processing for optimal performance and safety. Test and Measurement Instruments also present substantial opportunities, driven by the need for accurate diagnostics and calibration. The Vehicle Electronics segment is poised for significant growth as autonomous driving technologies and advanced driver-assistance systems (ADAS) become more prevalent, demanding low-power, high-performance op amps for various sensor interfaces and control units. Regionally, Asia Pacific, led by China and India, is anticipated to dominate the market, owing to its strong manufacturing base for electronics and the rapid adoption of advanced technologies. North America and Europe are also key markets, driven by innovation in medical devices and automotive sectors. While the market exhibits strong growth potential, potential restraints include the intense price competition among established players and the ongoing challenge of developing op amps that further reduce power consumption without compromising precision and performance.
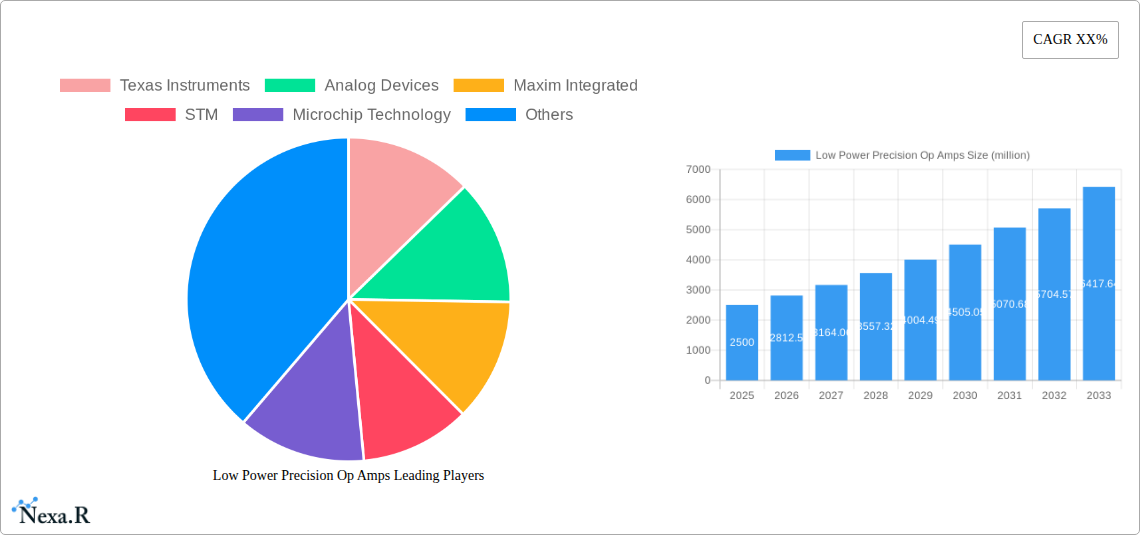
Low Power Precision Op Amps Company Market Share
This comprehensive report provides an in-depth analysis of the global Low Power Precision Operational Amplifiers (Op Amps) market. It examines market dynamics, growth trends, regional dominance, product landscape, key drivers, challenges, and emerging opportunities from 2019 to 2033, with a base year of 2025 and a forecast period of 2025–2033. The report includes quantitative data, insights into market structure, and strategic recommendations for stakeholders.
Low Power Precision Op Amps Market Dynamics & Structure
The low power precision op amps market exhibits a moderately concentrated structure, with key players like Texas Instruments, Analog Devices, and Maxim Integrated holding significant market shares. Technological innovation is a primary driver, fueled by the increasing demand for miniaturization, higher battery life, and enhanced accuracy in electronic devices across various application segments, including automatic control systems, test and measurement instruments, medical instruments, and vehicle electronics. Regulatory frameworks, particularly those related to energy efficiency and device safety in medical and automotive sectors, also play a crucial role in shaping product development and market entry. Competitive product substitutes, such as discrete components and other amplifier types, exist but are often outpaced by the integrated advantages of precision op amps. End-user demographics are increasingly sophisticated, demanding higher performance and lower power consumption. Mergers and acquisitions (M&A) activity, while not pervasive, has been observed as companies aim to consolidate portfolios and expand technological capabilities. For instance, the recent acquisition of Maxim Integrated by Analog Devices in 2021 (deal value approximately 20,600 million USD) significantly reshaped the competitive landscape.
- Market Concentration: Dominated by a few major players, with increasing competition from emerging regional manufacturers.
- Technological Innovation Drivers: Miniaturization, ultra-low power consumption, high precision, low noise, and wide bandwidth capabilities.
- Regulatory Frameworks: Growing emphasis on energy efficiency standards (e.g., RoHS, REACH) and safety certifications for medical and automotive applications.
- Competitive Product Substitutes: Discrete component solutions, other amplifier ICs.
- End-User Demographics: Growing demand from industrial automation, portable medical devices, IoT devices, and advanced automotive systems.
- M&A Trends: Strategic acquisitions to gain market share, technological expertise, and product portfolio expansion.
Low Power Precision Op Amps Growth Trends & Insights
The low power precision op amps market is projected to experience robust growth driven by the ubiquitous demand for sophisticated electronic systems that prioritize energy efficiency and accuracy. The market size is estimated to reach approximately 4,500 million units in 2025 and is forecast to grow at a Compound Annual Growth Rate (CAGR) of approximately 8.5% during the 2025–2033 forecast period, potentially reaching over 8,000 million units by 2033. This expansion is underpinned by increasing adoption rates in the Internet of Things (IoT) sector, where battery-powered devices require minimal power consumption without compromising signal integrity. Technological disruptions, such as advancements in silicon-on-insulator (SOI) technology and Gallium Nitride (GaN) integration, are enabling the development of op amps with even lower leakage currents and higher operating speeds, further enhancing their appeal. Consumer behavior shifts towards portable, connected, and intelligent devices are directly fueling this demand. The penetration of low power precision op amps in emerging economies is also on an upward trajectory, as industrial automation and healthcare infrastructure development accelerate. Historically, the market saw steady growth from 2019 to 2024, with key drivers being the expansion of the automotive electronics market and the increasing complexity of medical diagnostic equipment. The projected CAGR of 8.5% signifies a sustained and accelerated growth phase, indicating a dynamic and expanding market.
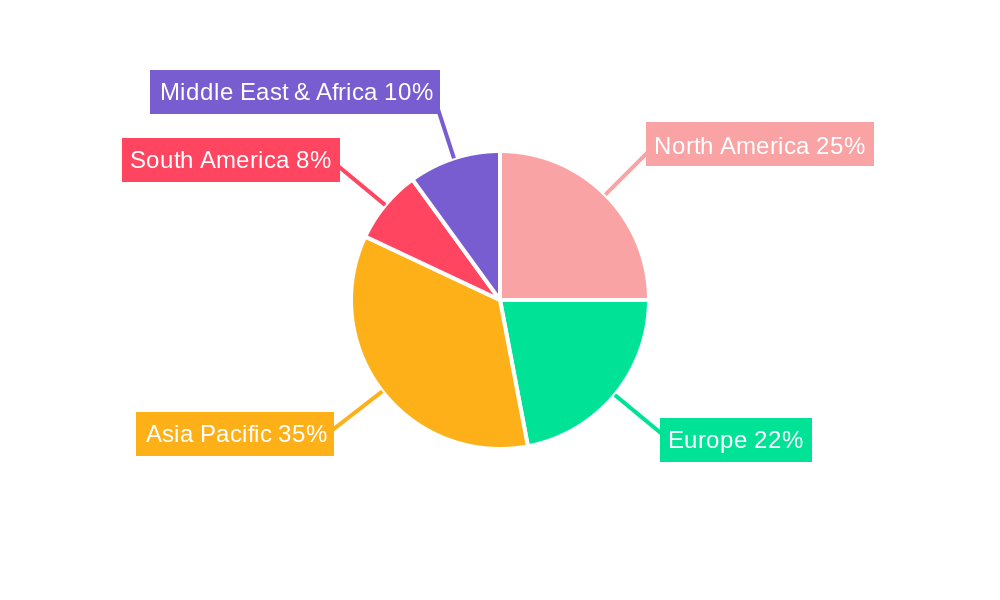
Dominant Regions, Countries, or Segments in Low Power Precision Op Amps
The low power precision op amps market is witnessing significant growth across several key regions and application segments. North America and Europe currently lead the market, driven by the strong presence of advanced industries like medical devices, automotive electronics, and industrial automation. The United States, in particular, is a dominant country due to its robust R&D infrastructure and high adoption of cutting-edge technologies. However, the Asia-Pacific region, spearheaded by China, South Korea, and Japan, is emerging as the fastest-growing market. This surge is attributed to the region's massive manufacturing base for consumer electronics, the rapidly expanding automotive sector, and increasing investments in healthcare and industrial automation infrastructure.
From an application perspective, Vehicle Electronics and Medical Instruments are the dominant segments driving market growth. The increasing sophistication of advanced driver-assistance systems (ADAS), infotainment systems, and electric vehicle (EV) powertrains in the automotive industry necessitates high-performance, low-power op amps for sensor signal conditioning, power management, and control circuits. In the medical sector, the demand for portable diagnostic equipment, wearable health monitors, and advanced imaging systems, all requiring precise analog signal processing with minimal power consumption, is escalating.
Within the Types category, 2 Channel Type and 4 Channel Type op amps are experiencing higher adoption rates compared to 1 Channel Type due to the increasing complexity and integration of electronic systems, which often require multiple amplification channels in a single package to reduce board space and power consumption.
- Dominant Region: Asia-Pacific, with China as a key growth driver, followed by North America and Europe.
- Dominant Application Segments:
- Vehicle Electronics: Driven by ADAS, EVs, and infotainment systems.
- Medical Instruments: Fueled by portable diagnostics, wearables, and advanced imaging.
- Dominant Types:
- 2 Channel Type: Increasing demand for integrated solutions.
- 4 Channel Type: Supporting complex multi-channel signal processing.
- Key Growth Drivers: Technological advancements in automotive and medical devices, increasing adoption of IoT devices, and government initiatives promoting energy efficiency.
Low Power Precision Op Amps Product Landscape
The product landscape for low power precision op amps is characterized by continuous innovation focused on enhancing performance metrics while minimizing power consumption. Manufacturers are introducing devices with ultra-low input bias currents, low offset voltage and drift, high common-mode rejection ratio (CMRR), and wide bandwidths, enabling precise signal conditioning in sensitive applications. Unique selling propositions often revolve around industry-leading specifications in areas like quiescent current (Iq), noise density (nV/√Hz), and rail-to-rail input/output capabilities. Technological advancements include the development of advanced packaging techniques for improved thermal management and reduced board space, as well as integrated features like digital communication interfaces (e.g., I2C) for enhanced configurability. Examples include op amps designed for specific battery-powered applications, enabling extended operational life.
Key Drivers, Barriers & Challenges in Low Power Precision Op Amps
Key Drivers: The primary forces propelling the low power precision op amps market are the relentless pursuit of energy efficiency across all electronic devices, the growing complexity and miniaturization of systems in the Internet of Things (IoT), medical devices, and automotive electronics, and the increasing demand for high precision and accuracy in sensor-based applications. Government regulations promoting energy conservation also act as a significant catalyst. For instance, stringent emissions standards for vehicles are driving the adoption of more sophisticated electronic control units, which rely heavily on precision op amps.
Barriers & Challenges: Key challenges include the high cost of research and development for cutting-edge precision op amps, the complex manufacturing processes required to achieve low power and high precision, and the potential for supply chain disruptions for critical raw materials. Intense competition among established players and emerging manufacturers can also lead to price pressures. Furthermore, the need for rigorous testing and validation for sensitive applications like medical devices can extend product development cycles. For example, supply chain bottlenecks for specialized semiconductor fabrication equipment can impact production volumes and lead times, affecting overall market availability.
Emerging Opportunities in Low Power Precision Op Amps
Emerging opportunities in the low power precision op amps sector are largely driven by the expansion of the Internet of Things (IoT), the growing demand for advanced healthcare solutions, and the electrification of the automotive industry. The proliferation of smart home devices, industrial sensors, and wearable health trackers presents a vast untapped market for ultra-low power, high-precision op amps. The development of next-generation medical diagnostic tools, including point-of-care testing devices and remote patient monitoring systems, will further fuel demand. Moreover, the increasing adoption of electric and autonomous vehicles, with their complex sensor networks and power management systems, offers substantial growth potential. Innovations in energy harvesting technologies also present an opportunity for op amps that can efficiently manage and process minute power inputs.
Growth Accelerators in the Low Power Precision Op Amps Industry
The growth accelerators in the low power precision op amps industry are multifaceted, encompassing technological breakthroughs, strategic partnerships, and innovative market expansion strategies. Continuous advancements in semiconductor manufacturing processes, such as FinFET and advanced lithography, enable the creation of smaller, more power-efficient, and higher-performing op amps. Strategic partnerships between semiconductor manufacturers and system designers are crucial for co-developing tailored solutions that meet specific application requirements, thereby accelerating adoption. Furthermore, market expansion into emerging economies, coupled with a focus on developing cost-effective yet high-performance solutions, is opening new avenues for growth. The increasing trend of system-on-chip (SoC) integration, where op amps are embedded alongside other functionalities, also acts as a significant growth accelerator by simplifying designs and reducing overall system costs.
Key Players Shaping the Low Power Precision Op Amps Market
- Texas Instruments
- Analog Devices
- Maxim Integrated
- STM
- Microchip Technology
- Intersil
- On Semiconductor
- New Japan Radio
Notable Milestones in Low Power Precision Op Amps Sector
- 2019: Texas Instruments launches a new family of nanopower op amps designed for battery-powered applications.
- 2020: Analog Devices introduces ultra-low power precision op amps with industry-leading performance for medical and industrial use.
- 2021: Maxim Integrated (now part of Analog Devices) unveils a highly integrated op amp solution for automotive applications.
- 2022: STM focuses on developing automotive-grade low power precision op amps to meet increasing vehicle electronics demand.
- 2023: Microchip Technology expands its portfolio of high-precision, low-power op amps for the expanding IoT market.
In-Depth Low Power Precision Op Amps Market Outlook
The future outlook for the low power precision op amps market is exceptionally positive, driven by sustained innovation and expanding application frontiers. Growth accelerators such as the continued miniaturization of electronic devices, the escalating demand for ultra-low power consumption in battery-operated systems, and the critical need for high accuracy in emerging technologies like artificial intelligence (AI) edge computing and advanced sensor networks will propel the market forward. Strategic collaborations between leading manufacturers and end-product developers will be instrumental in tailoring solutions for specific market needs, further solidifying growth. The increasing focus on sustainability and energy efficiency across industries will also ensure a consistent demand for these power-conscious components. The market is poised for significant expansion, offering substantial opportunities for stakeholders who can deliver innovative, high-performance, and cost-effective solutions.
Low Power Precision Op Amps Segmentation
-
1. Application
- 1.1. Automatic Control System
- 1.2. Test and Measurement Instruments
- 1.3. Medical Instruments
- 1.4. Vehicle Electronics
- 1.5. Others
-
2. Types
- 2.1. 1 Channel Type
- 2.2. 2 Channel Type
- 2.3. 4 Channel Type
Low Power Precision Op Amps Segmentation By Geography
-
1. North America
- 1.1. United States
- 1.2. Canada
- 1.3. Mexico
-
2. South America
- 2.1. Brazil
- 2.2. Argentina
- 2.3. Rest of South America
-
3. Europe
- 3.1. United Kingdom
- 3.2. Germany
- 3.3. France
- 3.4. Italy
- 3.5. Spain
- 3.6. Russia
- 3.7. Benelux
- 3.8. Nordics
- 3.9. Rest of Europe
-
4. Middle East & Africa
- 4.1. Turkey
- 4.2. Israel
- 4.3. GCC
- 4.4. North Africa
- 4.5. South Africa
- 4.6. Rest of Middle East & Africa
-
5. Asia Pacific
- 5.1. China
- 5.2. India
- 5.3. Japan
- 5.4. South Korea
- 5.5. ASEAN
- 5.6. Oceania
- 5.7. Rest of Asia Pacific
Low Power Precision Op Amps Regional Market Share
Geographic Coverage of Low Power Precision Op Amps
Low Power Precision Op Amps REPORT HIGHLIGHTS
| Aspects | Details |
|---|---|
| Study Period | 2020-2034 |
| Base Year | 2025 |
| Estimated Year | 2026 |
| Forecast Period | 2026-2034 |
| Historical Period | 2020-2025 |
| Growth Rate | CAGR of 7.45% from 2020-2034 |
| Segmentation |
|
Table of Contents
- 1. Introduction
- 1.1. Research Scope
- 1.2. Market Segmentation
- 1.3. Research Objective
- 1.4. Definitions and Assumptions
- 2. Executive Summary
- 2.1. Market Snapshot
- 3. Market Dynamics
- 3.1. Market Drivers
- 3.2. Market Restrains
- 3.3. Market Trends
- 3.4. Market Opportunities
- 4. Market Factor Analysis
- 4.1. Porters Five Forces
- 4.1.1. Bargaining Power of Suppliers
- 4.1.2. Bargaining Power of Buyers
- 4.1.3. Threat of New Entrants
- 4.1.4. Threat of Substitutes
- 4.1.5. Competitive Rivalry
- 4.2. PESTEL analysis
- 4.3. BCG Analysis
- 4.3.1. Stars (High Growth, High Market Share)
- 4.3.2. Cash Cows (Low Growth, High Market Share)
- 4.3.3. Question Mark (High Growth, Low Market Share)
- 4.3.4. Dogs (Low Growth, Low Market Share)
- 4.4. Ansoff Matrix Analysis
- 4.5. Supply Chain Analysis
- 4.6. Regulatory Landscape
- 4.7. Current Market Potential and Opportunity Assessment (TAM–SAM–SOM Framework)
- 4.8. NRP Analyst Note
- 4.1. Porters Five Forces
- 5. Market Analysis, Insights and Forecast 2021-2033
- 5.1. Market Analysis, Insights and Forecast - by Application
- 5.1.1. Automatic Control System
- 5.1.2. Test and Measurement Instruments
- 5.1.3. Medical Instruments
- 5.1.4. Vehicle Electronics
- 5.1.5. Others
- 5.2. Market Analysis, Insights and Forecast - by Types
- 5.2.1. 1 Channel Type
- 5.2.2. 2 Channel Type
- 5.2.3. 4 Channel Type
- 5.3. Market Analysis, Insights and Forecast - by Region
- 5.3.1. North America
- 5.3.2. South America
- 5.3.3. Europe
- 5.3.4. Middle East & Africa
- 5.3.5. Asia Pacific
- 5.1. Market Analysis, Insights and Forecast - by Application
- 6. Global Low Power Precision Op Amps Analysis, Insights and Forecast, 2021-2033
- 6.1. Market Analysis, Insights and Forecast - by Application
- 6.1.1. Automatic Control System
- 6.1.2. Test and Measurement Instruments
- 6.1.3. Medical Instruments
- 6.1.4. Vehicle Electronics
- 6.1.5. Others
- 6.2. Market Analysis, Insights and Forecast - by Types
- 6.2.1. 1 Channel Type
- 6.2.2. 2 Channel Type
- 6.2.3. 4 Channel Type
- 6.1. Market Analysis, Insights and Forecast - by Application
- 7. North America Low Power Precision Op Amps Analysis, Insights and Forecast, 2020-2032
- 7.1. Market Analysis, Insights and Forecast - by Application
- 7.1.1. Automatic Control System
- 7.1.2. Test and Measurement Instruments
- 7.1.3. Medical Instruments
- 7.1.4. Vehicle Electronics
- 7.1.5. Others
- 7.2. Market Analysis, Insights and Forecast - by Types
- 7.2.1. 1 Channel Type
- 7.2.2. 2 Channel Type
- 7.2.3. 4 Channel Type
- 7.1. Market Analysis, Insights and Forecast - by Application
- 8. South America Low Power Precision Op Amps Analysis, Insights and Forecast, 2020-2032
- 8.1. Market Analysis, Insights and Forecast - by Application
- 8.1.1. Automatic Control System
- 8.1.2. Test and Measurement Instruments
- 8.1.3. Medical Instruments
- 8.1.4. Vehicle Electronics
- 8.1.5. Others
- 8.2. Market Analysis, Insights and Forecast - by Types
- 8.2.1. 1 Channel Type
- 8.2.2. 2 Channel Type
- 8.2.3. 4 Channel Type
- 8.1. Market Analysis, Insights and Forecast - by Application
- 9. Europe Low Power Precision Op Amps Analysis, Insights and Forecast, 2020-2032
- 9.1. Market Analysis, Insights and Forecast - by Application
- 9.1.1. Automatic Control System
- 9.1.2. Test and Measurement Instruments
- 9.1.3. Medical Instruments
- 9.1.4. Vehicle Electronics
- 9.1.5. Others
- 9.2. Market Analysis, Insights and Forecast - by Types
- 9.2.1. 1 Channel Type
- 9.2.2. 2 Channel Type
- 9.2.3. 4 Channel Type
- 9.1. Market Analysis, Insights and Forecast - by Application
- 10. Middle East & Africa Low Power Precision Op Amps Analysis, Insights and Forecast, 2020-2032
- 10.1. Market Analysis, Insights and Forecast - by Application
- 10.1.1. Automatic Control System
- 10.1.2. Test and Measurement Instruments
- 10.1.3. Medical Instruments
- 10.1.4. Vehicle Electronics
- 10.1.5. Others
- 10.2. Market Analysis, Insights and Forecast - by Types
- 10.2.1. 1 Channel Type
- 10.2.2. 2 Channel Type
- 10.2.3. 4 Channel Type
- 10.1. Market Analysis, Insights and Forecast - by Application
- 11. Asia Pacific Low Power Precision Op Amps Analysis, Insights and Forecast, 2020-2032
- 11.1. Market Analysis, Insights and Forecast - by Application
- 11.1.1. Automatic Control System
- 11.1.2. Test and Measurement Instruments
- 11.1.3. Medical Instruments
- 11.1.4. Vehicle Electronics
- 11.1.5. Others
- 11.2. Market Analysis, Insights and Forecast - by Types
- 11.2.1. 1 Channel Type
- 11.2.2. 2 Channel Type
- 11.2.3. 4 Channel Type
- 11.1. Market Analysis, Insights and Forecast - by Application
- 12. Competitive Analysis
- 12.1. Company Profiles
- 12.1.1 Texas Instruments
- 12.1.1.1. Company Overview
- 12.1.1.2. Products
- 12.1.1.3. Company Financials
- 12.1.1.4. SWOT Analysis
- 12.1.2 Analog Devices
- 12.1.2.1. Company Overview
- 12.1.2.2. Products
- 12.1.2.3. Company Financials
- 12.1.2.4. SWOT Analysis
- 12.1.3 Maxim Integrated
- 12.1.3.1. Company Overview
- 12.1.3.2. Products
- 12.1.3.3. Company Financials
- 12.1.3.4. SWOT Analysis
- 12.1.4 STM
- 12.1.4.1. Company Overview
- 12.1.4.2. Products
- 12.1.4.3. Company Financials
- 12.1.4.4. SWOT Analysis
- 12.1.5 Microchip Technology
- 12.1.5.1. Company Overview
- 12.1.5.2. Products
- 12.1.5.3. Company Financials
- 12.1.5.4. SWOT Analysis
- 12.1.6 Intersil
- 12.1.6.1. Company Overview
- 12.1.6.2. Products
- 12.1.6.3. Company Financials
- 12.1.6.4. SWOT Analysis
- 12.1.7 On Semiconductor
- 12.1.7.1. Company Overview
- 12.1.7.2. Products
- 12.1.7.3. Company Financials
- 12.1.7.4. SWOT Analysis
- 12.1.8 New Japan Radio
- 12.1.8.1. Company Overview
- 12.1.8.2. Products
- 12.1.8.3. Company Financials
- 12.1.8.4. SWOT Analysis
- 12.1.1 Texas Instruments
- 12.2. Market Entropy
- 12.2.1 Company's Key Areas Served
- 12.2.2 Recent Developments
- 12.3. Company Market Share Analysis 2025
- 12.3.1 Top 5 Companies Market Share Analysis
- 12.3.2 Top 3 Companies Market Share Analysis
- 12.4. List of Potential Customers
- 13. Research Methodology
List of Figures
- Figure 1: Global Low Power Precision Op Amps Revenue Breakdown (undefined, %) by Region 2025 & 2033
- Figure 2: Global Low Power Precision Op Amps Volume Breakdown (K, %) by Region 2025 & 2033
- Figure 3: North America Low Power Precision Op Amps Revenue (undefined), by Application 2025 & 2033
- Figure 4: North America Low Power Precision Op Amps Volume (K), by Application 2025 & 2033
- Figure 5: North America Low Power Precision Op Amps Revenue Share (%), by Application 2025 & 2033
- Figure 6: North America Low Power Precision Op Amps Volume Share (%), by Application 2025 & 2033
- Figure 7: North America Low Power Precision Op Amps Revenue (undefined), by Types 2025 & 2033
- Figure 8: North America Low Power Precision Op Amps Volume (K), by Types 2025 & 2033
- Figure 9: North America Low Power Precision Op Amps Revenue Share (%), by Types 2025 & 2033
- Figure 10: North America Low Power Precision Op Amps Volume Share (%), by Types 2025 & 2033
- Figure 11: North America Low Power Precision Op Amps Revenue (undefined), by Country 2025 & 2033
- Figure 12: North America Low Power Precision Op Amps Volume (K), by Country 2025 & 2033
- Figure 13: North America Low Power Precision Op Amps Revenue Share (%), by Country 2025 & 2033
- Figure 14: North America Low Power Precision Op Amps Volume Share (%), by Country 2025 & 2033
- Figure 15: South America Low Power Precision Op Amps Revenue (undefined), by Application 2025 & 2033
- Figure 16: South America Low Power Precision Op Amps Volume (K), by Application 2025 & 2033
- Figure 17: South America Low Power Precision Op Amps Revenue Share (%), by Application 2025 & 2033
- Figure 18: South America Low Power Precision Op Amps Volume Share (%), by Application 2025 & 2033
- Figure 19: South America Low Power Precision Op Amps Revenue (undefined), by Types 2025 & 2033
- Figure 20: South America Low Power Precision Op Amps Volume (K), by Types 2025 & 2033
- Figure 21: South America Low Power Precision Op Amps Revenue Share (%), by Types 2025 & 2033
- Figure 22: South America Low Power Precision Op Amps Volume Share (%), by Types 2025 & 2033
- Figure 23: South America Low Power Precision Op Amps Revenue (undefined), by Country 2025 & 2033
- Figure 24: South America Low Power Precision Op Amps Volume (K), by Country 2025 & 2033
- Figure 25: South America Low Power Precision Op Amps Revenue Share (%), by Country 2025 & 2033
- Figure 26: South America Low Power Precision Op Amps Volume Share (%), by Country 2025 & 2033
- Figure 27: Europe Low Power Precision Op Amps Revenue (undefined), by Application 2025 & 2033
- Figure 28: Europe Low Power Precision Op Amps Volume (K), by Application 2025 & 2033
- Figure 29: Europe Low Power Precision Op Amps Revenue Share (%), by Application 2025 & 2033
- Figure 30: Europe Low Power Precision Op Amps Volume Share (%), by Application 2025 & 2033
- Figure 31: Europe Low Power Precision Op Amps Revenue (undefined), by Types 2025 & 2033
- Figure 32: Europe Low Power Precision Op Amps Volume (K), by Types 2025 & 2033
- Figure 33: Europe Low Power Precision Op Amps Revenue Share (%), by Types 2025 & 2033
- Figure 34: Europe Low Power Precision Op Amps Volume Share (%), by Types 2025 & 2033
- Figure 35: Europe Low Power Precision Op Amps Revenue (undefined), by Country 2025 & 2033
- Figure 36: Europe Low Power Precision Op Amps Volume (K), by Country 2025 & 2033
- Figure 37: Europe Low Power Precision Op Amps Revenue Share (%), by Country 2025 & 2033
- Figure 38: Europe Low Power Precision Op Amps Volume Share (%), by Country 2025 & 2033
- Figure 39: Middle East & Africa Low Power Precision Op Amps Revenue (undefined), by Application 2025 & 2033
- Figure 40: Middle East & Africa Low Power Precision Op Amps Volume (K), by Application 2025 & 2033
- Figure 41: Middle East & Africa Low Power Precision Op Amps Revenue Share (%), by Application 2025 & 2033
- Figure 42: Middle East & Africa Low Power Precision Op Amps Volume Share (%), by Application 2025 & 2033
- Figure 43: Middle East & Africa Low Power Precision Op Amps Revenue (undefined), by Types 2025 & 2033
- Figure 44: Middle East & Africa Low Power Precision Op Amps Volume (K), by Types 2025 & 2033
- Figure 45: Middle East & Africa Low Power Precision Op Amps Revenue Share (%), by Types 2025 & 2033
- Figure 46: Middle East & Africa Low Power Precision Op Amps Volume Share (%), by Types 2025 & 2033
- Figure 47: Middle East & Africa Low Power Precision Op Amps Revenue (undefined), by Country 2025 & 2033
- Figure 48: Middle East & Africa Low Power Precision Op Amps Volume (K), by Country 2025 & 2033
- Figure 49: Middle East & Africa Low Power Precision Op Amps Revenue Share (%), by Country 2025 & 2033
- Figure 50: Middle East & Africa Low Power Precision Op Amps Volume Share (%), by Country 2025 & 2033
- Figure 51: Asia Pacific Low Power Precision Op Amps Revenue (undefined), by Application 2025 & 2033
- Figure 52: Asia Pacific Low Power Precision Op Amps Volume (K), by Application 2025 & 2033
- Figure 53: Asia Pacific Low Power Precision Op Amps Revenue Share (%), by Application 2025 & 2033
- Figure 54: Asia Pacific Low Power Precision Op Amps Volume Share (%), by Application 2025 & 2033
- Figure 55: Asia Pacific Low Power Precision Op Amps Revenue (undefined), by Types 2025 & 2033
- Figure 56: Asia Pacific Low Power Precision Op Amps Volume (K), by Types 2025 & 2033
- Figure 57: Asia Pacific Low Power Precision Op Amps Revenue Share (%), by Types 2025 & 2033
- Figure 58: Asia Pacific Low Power Precision Op Amps Volume Share (%), by Types 2025 & 2033
- Figure 59: Asia Pacific Low Power Precision Op Amps Revenue (undefined), by Country 2025 & 2033
- Figure 60: Asia Pacific Low Power Precision Op Amps Volume (K), by Country 2025 & 2033
- Figure 61: Asia Pacific Low Power Precision Op Amps Revenue Share (%), by Country 2025 & 2033
- Figure 62: Asia Pacific Low Power Precision Op Amps Volume Share (%), by Country 2025 & 2033
List of Tables
- Table 1: Global Low Power Precision Op Amps Revenue undefined Forecast, by Application 2020 & 2033
- Table 2: Global Low Power Precision Op Amps Volume K Forecast, by Application 2020 & 2033
- Table 3: Global Low Power Precision Op Amps Revenue undefined Forecast, by Types 2020 & 2033
- Table 4: Global Low Power Precision Op Amps Volume K Forecast, by Types 2020 & 2033
- Table 5: Global Low Power Precision Op Amps Revenue undefined Forecast, by Region 2020 & 2033
- Table 6: Global Low Power Precision Op Amps Volume K Forecast, by Region 2020 & 2033
- Table 7: Global Low Power Precision Op Amps Revenue undefined Forecast, by Application 2020 & 2033
- Table 8: Global Low Power Precision Op Amps Volume K Forecast, by Application 2020 & 2033
- Table 9: Global Low Power Precision Op Amps Revenue undefined Forecast, by Types 2020 & 2033
- Table 10: Global Low Power Precision Op Amps Volume K Forecast, by Types 2020 & 2033
- Table 11: Global Low Power Precision Op Amps Revenue undefined Forecast, by Country 2020 & 2033
- Table 12: Global Low Power Precision Op Amps Volume K Forecast, by Country 2020 & 2033
- Table 13: United States Low Power Precision Op Amps Revenue (undefined) Forecast, by Application 2020 & 2033
- Table 14: United States Low Power Precision Op Amps Volume (K) Forecast, by Application 2020 & 2033
- Table 15: Canada Low Power Precision Op Amps Revenue (undefined) Forecast, by Application 2020 & 2033
- Table 16: Canada Low Power Precision Op Amps Volume (K) Forecast, by Application 2020 & 2033
- Table 17: Mexico Low Power Precision Op Amps Revenue (undefined) Forecast, by Application 2020 & 2033
- Table 18: Mexico Low Power Precision Op Amps Volume (K) Forecast, by Application 2020 & 2033
- Table 19: Global Low Power Precision Op Amps Revenue undefined Forecast, by Application 2020 & 2033
- Table 20: Global Low Power Precision Op Amps Volume K Forecast, by Application 2020 & 2033
- Table 21: Global Low Power Precision Op Amps Revenue undefined Forecast, by Types 2020 & 2033
- Table 22: Global Low Power Precision Op Amps Volume K Forecast, by Types 2020 & 2033
- Table 23: Global Low Power Precision Op Amps Revenue undefined Forecast, by Country 2020 & 2033
- Table 24: Global Low Power Precision Op Amps Volume K Forecast, by Country 2020 & 2033
- Table 25: Brazil Low Power Precision Op Amps Revenue (undefined) Forecast, by Application 2020 & 2033
- Table 26: Brazil Low Power Precision Op Amps Volume (K) Forecast, by Application 2020 & 2033
- Table 27: Argentina Low Power Precision Op Amps Revenue (undefined) Forecast, by Application 2020 & 2033
- Table 28: Argentina Low Power Precision Op Amps Volume (K) Forecast, by Application 2020 & 2033
- Table 29: Rest of South America Low Power Precision Op Amps Revenue (undefined) Forecast, by Application 2020 & 2033
- Table 30: Rest of South America Low Power Precision Op Amps Volume (K) Forecast, by Application 2020 & 2033
- Table 31: Global Low Power Precision Op Amps Revenue undefined Forecast, by Application 2020 & 2033
- Table 32: Global Low Power Precision Op Amps Volume K Forecast, by Application 2020 & 2033
- Table 33: Global Low Power Precision Op Amps Revenue undefined Forecast, by Types 2020 & 2033
- Table 34: Global Low Power Precision Op Amps Volume K Forecast, by Types 2020 & 2033
- Table 35: Global Low Power Precision Op Amps Revenue undefined Forecast, by Country 2020 & 2033
- Table 36: Global Low Power Precision Op Amps Volume K Forecast, by Country 2020 & 2033
- Table 37: United Kingdom Low Power Precision Op Amps Revenue (undefined) Forecast, by Application 2020 & 2033
- Table 38: United Kingdom Low Power Precision Op Amps Volume (K) Forecast, by Application 2020 & 2033
- Table 39: Germany Low Power Precision Op Amps Revenue (undefined) Forecast, by Application 2020 & 2033
- Table 40: Germany Low Power Precision Op Amps Volume (K) Forecast, by Application 2020 & 2033
- Table 41: France Low Power Precision Op Amps Revenue (undefined) Forecast, by Application 2020 & 2033
- Table 42: France Low Power Precision Op Amps Volume (K) Forecast, by Application 2020 & 2033
- Table 43: Italy Low Power Precision Op Amps Revenue (undefined) Forecast, by Application 2020 & 2033
- Table 44: Italy Low Power Precision Op Amps Volume (K) Forecast, by Application 2020 & 2033
- Table 45: Spain Low Power Precision Op Amps Revenue (undefined) Forecast, by Application 2020 & 2033
- Table 46: Spain Low Power Precision Op Amps Volume (K) Forecast, by Application 2020 & 2033
- Table 47: Russia Low Power Precision Op Amps Revenue (undefined) Forecast, by Application 2020 & 2033
- Table 48: Russia Low Power Precision Op Amps Volume (K) Forecast, by Application 2020 & 2033
- Table 49: Benelux Low Power Precision Op Amps Revenue (undefined) Forecast, by Application 2020 & 2033
- Table 50: Benelux Low Power Precision Op Amps Volume (K) Forecast, by Application 2020 & 2033
- Table 51: Nordics Low Power Precision Op Amps Revenue (undefined) Forecast, by Application 2020 & 2033
- Table 52: Nordics Low Power Precision Op Amps Volume (K) Forecast, by Application 2020 & 2033
- Table 53: Rest of Europe Low Power Precision Op Amps Revenue (undefined) Forecast, by Application 2020 & 2033
- Table 54: Rest of Europe Low Power Precision Op Amps Volume (K) Forecast, by Application 2020 & 2033
- Table 55: Global Low Power Precision Op Amps Revenue undefined Forecast, by Application 2020 & 2033
- Table 56: Global Low Power Precision Op Amps Volume K Forecast, by Application 2020 & 2033
- Table 57: Global Low Power Precision Op Amps Revenue undefined Forecast, by Types 2020 & 2033
- Table 58: Global Low Power Precision Op Amps Volume K Forecast, by Types 2020 & 2033
- Table 59: Global Low Power Precision Op Amps Revenue undefined Forecast, by Country 2020 & 2033
- Table 60: Global Low Power Precision Op Amps Volume K Forecast, by Country 2020 & 2033
- Table 61: Turkey Low Power Precision Op Amps Revenue (undefined) Forecast, by Application 2020 & 2033
- Table 62: Turkey Low Power Precision Op Amps Volume (K) Forecast, by Application 2020 & 2033
- Table 63: Israel Low Power Precision Op Amps Revenue (undefined) Forecast, by Application 2020 & 2033
- Table 64: Israel Low Power Precision Op Amps Volume (K) Forecast, by Application 2020 & 2033
- Table 65: GCC Low Power Precision Op Amps Revenue (undefined) Forecast, by Application 2020 & 2033
- Table 66: GCC Low Power Precision Op Amps Volume (K) Forecast, by Application 2020 & 2033
- Table 67: North Africa Low Power Precision Op Amps Revenue (undefined) Forecast, by Application 2020 & 2033
- Table 68: North Africa Low Power Precision Op Amps Volume (K) Forecast, by Application 2020 & 2033
- Table 69: South Africa Low Power Precision Op Amps Revenue (undefined) Forecast, by Application 2020 & 2033
- Table 70: South Africa Low Power Precision Op Amps Volume (K) Forecast, by Application 2020 & 2033
- Table 71: Rest of Middle East & Africa Low Power Precision Op Amps Revenue (undefined) Forecast, by Application 2020 & 2033
- Table 72: Rest of Middle East & Africa Low Power Precision Op Amps Volume (K) Forecast, by Application 2020 & 2033
- Table 73: Global Low Power Precision Op Amps Revenue undefined Forecast, by Application 2020 & 2033
- Table 74: Global Low Power Precision Op Amps Volume K Forecast, by Application 2020 & 2033
- Table 75: Global Low Power Precision Op Amps Revenue undefined Forecast, by Types 2020 & 2033
- Table 76: Global Low Power Precision Op Amps Volume K Forecast, by Types 2020 & 2033
- Table 77: Global Low Power Precision Op Amps Revenue undefined Forecast, by Country 2020 & 2033
- Table 78: Global Low Power Precision Op Amps Volume K Forecast, by Country 2020 & 2033
- Table 79: China Low Power Precision Op Amps Revenue (undefined) Forecast, by Application 2020 & 2033
- Table 80: China Low Power Precision Op Amps Volume (K) Forecast, by Application 2020 & 2033
- Table 81: India Low Power Precision Op Amps Revenue (undefined) Forecast, by Application 2020 & 2033
- Table 82: India Low Power Precision Op Amps Volume (K) Forecast, by Application 2020 & 2033
- Table 83: Japan Low Power Precision Op Amps Revenue (undefined) Forecast, by Application 2020 & 2033
- Table 84: Japan Low Power Precision Op Amps Volume (K) Forecast, by Application 2020 & 2033
- Table 85: South Korea Low Power Precision Op Amps Revenue (undefined) Forecast, by Application 2020 & 2033
- Table 86: South Korea Low Power Precision Op Amps Volume (K) Forecast, by Application 2020 & 2033
- Table 87: ASEAN Low Power Precision Op Amps Revenue (undefined) Forecast, by Application 2020 & 2033
- Table 88: ASEAN Low Power Precision Op Amps Volume (K) Forecast, by Application 2020 & 2033
- Table 89: Oceania Low Power Precision Op Amps Revenue (undefined) Forecast, by Application 2020 & 2033
- Table 90: Oceania Low Power Precision Op Amps Volume (K) Forecast, by Application 2020 & 2033
- Table 91: Rest of Asia Pacific Low Power Precision Op Amps Revenue (undefined) Forecast, by Application 2020 & 2033
- Table 92: Rest of Asia Pacific Low Power Precision Op Amps Volume (K) Forecast, by Application 2020 & 2033
Frequently Asked Questions
1. What is the projected Compound Annual Growth Rate (CAGR) of the Low Power Precision Op Amps?
The projected CAGR is approximately 7.45%.
2. Which companies are prominent players in the Low Power Precision Op Amps?
Key companies in the market include Texas Instruments, Analog Devices, Maxim Integrated, STM, Microchip Technology, Intersil, On Semiconductor, New Japan Radio.
3. What are the main segments of the Low Power Precision Op Amps?
The market segments include Application, Types.
4. Can you provide details about the market size?
The market size is estimated to be USD XXX N/A as of 2022.
5. What are some drivers contributing to market growth?
N/A
6. What are the notable trends driving market growth?
N/A
7. Are there any restraints impacting market growth?
N/A
8. Can you provide examples of recent developments in the market?
N/A
9. What pricing options are available for accessing the report?
Pricing options include single-user, multi-user, and enterprise licenses priced at USD 3350.00, USD 5025.00, and USD 6700.00 respectively.
10. Is the market size provided in terms of value or volume?
The market size is provided in terms of value, measured in N/A and volume, measured in K.
11. Are there any specific market keywords associated with the report?
Yes, the market keyword associated with the report is "Low Power Precision Op Amps," which aids in identifying and referencing the specific market segment covered.
12. How do I determine which pricing option suits my needs best?
The pricing options vary based on user requirements and access needs. Individual users may opt for single-user licenses, while businesses requiring broader access may choose multi-user or enterprise licenses for cost-effective access to the report.
13. Are there any additional resources or data provided in the Low Power Precision Op Amps report?
While the report offers comprehensive insights, it's advisable to review the specific contents or supplementary materials provided to ascertain if additional resources or data are available.
14. How can I stay updated on further developments or reports in the Low Power Precision Op Amps?
To stay informed about further developments, trends, and reports in the Low Power Precision Op Amps, consider subscribing to industry newsletters, following relevant companies and organizations, or regularly checking reputable industry news sources and publications.
Methodology
Step 1 - Identification of Relevant Samples Size from Population Database


Step 2 - Approaches for Defining Global Market Size (Value, Volume* & Price*)

Note*: In applicable scenarios
Step 3 - Data Sources
Primary Research
- Web Analytics
- Survey Reports
- Research Institute
- Latest Research Reports
- Opinion Leaders
Secondary Research
- Annual Reports
- White Paper
- Latest Press Release
- Industry Association
- Paid Database
- Investor Presentations

Step 4 - Data Triangulation
Involves using different sources of information in order to increase the validity of a study
These sources are likely to be stakeholders in a program - participants, other researchers, program staff, other community members, and so on.
Then we put all data in single framework & apply various statistical tools to find out the dynamic on the market.
During the analysis stage, feedback from the stakeholder groups would be compared to determine areas of agreement as well as areas of divergence