

Key Insights
The Middle East and Africa (MEA) cloud computing market is experiencing robust growth, driven by increasing digital transformation initiatives across various sectors, including government, finance, and telecommunications. The region's burgeoning startup ecosystem and a growing need for scalable, cost-effective IT infrastructure are further fueling this expansion. While precise market sizing data is unavailable, considering global cloud computing market trends and the rapid adoption rate in MEA, we can reasonably project a 2025 market value of approximately $5 billion, exhibiting a Compound Annual Growth Rate (CAGR) of 15-20% through 2033. Key drivers include the rising adoption of cloud-native applications, the increasing demand for data analytics and AI capabilities, and government initiatives promoting digital economies. Furthermore, the need for enhanced cybersecurity and disaster recovery solutions is pushing organizations towards cloud-based services. Despite these positive factors, challenges remain, including a lack of skilled professionals, data privacy concerns, and varying levels of digital infrastructure development across the region. These restraints, however, are unlikely to significantly impede the market's overall trajectory of substantial growth.
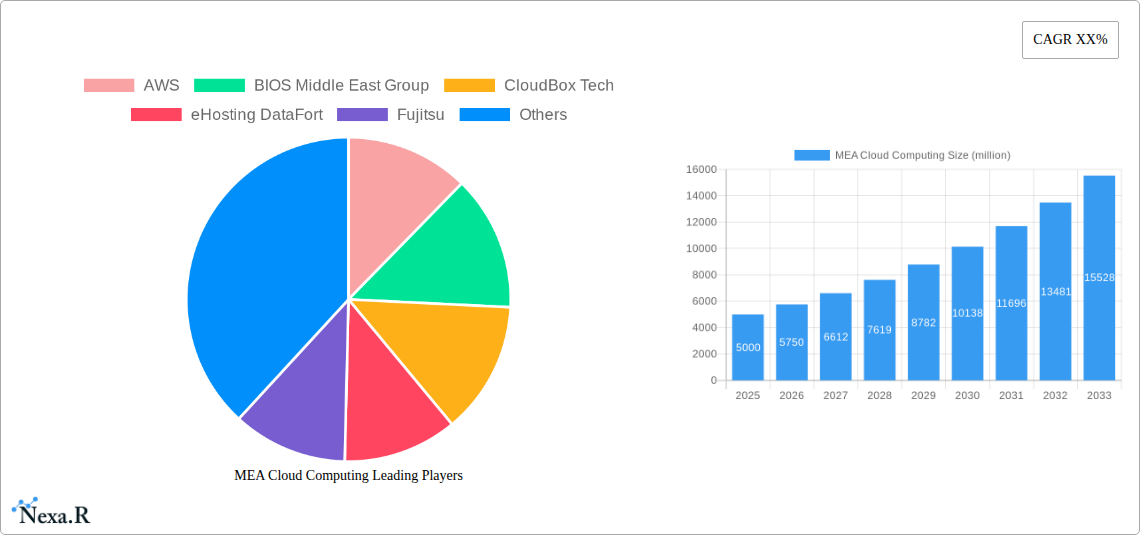
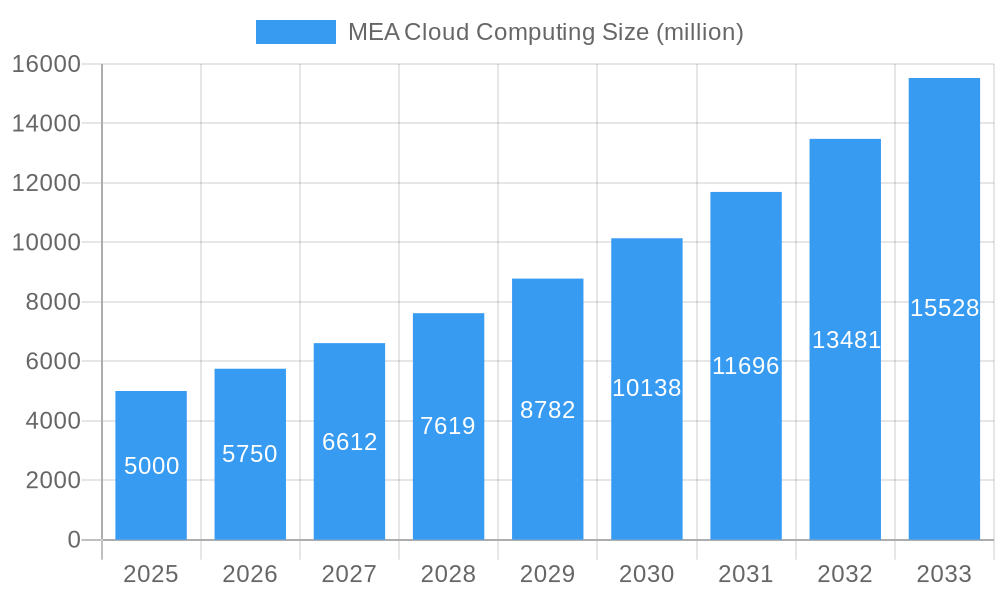
MEA Cloud Computing Market Size (In Billion)
The competitive landscape is characterized by a mix of global technology giants (AWS, Google, Microsoft, IBM) and regional players (eHosting DataFort, Injazat Data Systems, BIOS Middle East Group). These companies are actively investing in expanding their data center infrastructure and developing localized cloud solutions to cater to the specific needs of the MEA market. The market segmentation is expected to evolve with increasing specialization in industry-specific cloud services (e.g., healthcare, finance) and a rise in hybrid and multi-cloud deployments. This dynamic environment will favor providers that can offer flexible, secure, and regionally compliant solutions. Future growth will be significantly influenced by the expansion of 5G networks, the rise of edge computing, and the continued adoption of advanced technologies like blockchain and the Internet of Things (IoT).
MEA Cloud Computing Company Market Share
MEA Cloud Computing Market Report: 2019-2033
This comprehensive report provides a detailed analysis of the Middle East and Africa (MEA) cloud computing market, covering market dynamics, growth trends, dominant segments, key players, and future outlook. With a study period spanning 2019-2033, a base year of 2025, and a forecast period of 2025-2033, this report is an invaluable resource for industry professionals, investors, and strategic decision-makers. The report utilizes data expressed in millions of units.
MEA Cloud Computing Market Dynamics & Structure
This section analyzes the MEA cloud computing market's structure, focusing on market concentration, technological innovation, regulatory frameworks, competitive landscape, end-user demographics, and mergers & acquisitions (M&A) activity. The report finds a moderately consolidated market with key players holding significant market share. The rapid adoption of cloud technologies is driving intense competition, leading to strategic partnerships and M&A activity.
- Market Concentration: The top 5 players control approximately xx% of the market in 2025, with a projected xx% by 2033.
- Technological Innovation: The MEA region is witnessing rapid innovation in areas like AI, machine learning, and serverless computing. However, barriers to innovation include limited skilled workforce and high initial investment costs.
- Regulatory Frameworks: Government initiatives promoting digital transformation are creating a supportive regulatory environment, though data privacy regulations remain a key consideration.
- Competitive Substitutes: On-premise infrastructure and hybrid cloud models present some competition, but the advantages of cloud computing continue to drive market expansion.
- End-User Demographics: Increased cloud adoption across various sectors, including BFSI, government, and healthcare, is driving market growth. SMBs are adopting cloud solutions at an accelerated rate.
- M&A Trends: The number of M&A deals in the MEA cloud computing sector has increased steadily, reaching xx deals in 2024, projected to xx in 2033. This reflects consolidation and expansion strategies by major players.
MEA Cloud Computing Growth Trends & Insights
The MEA cloud computing market is experiencing robust growth, driven by increasing digital transformation initiatives, rising data volumes, and the need for scalable IT infrastructure. The market size reached xx million in 2024 and is projected to reach xx million by 2033, exhibiting a CAGR of xx% during the forecast period. This growth is fueled by factors such as:
- Increased Cloud Adoption: Various industry verticals are increasingly adopting cloud services due to scalability, cost-effectiveness, and improved operational efficiency.
- Technological Disruptions: The emergence of new cloud technologies, such as serverless computing and edge computing, is further driving market expansion.
- Shifting Consumer Behavior: Businesses are showing a preference for cloud-based solutions to enhance flexibility, agility and reduce IT costs. The growing demand for advanced cloud services, like AI and IoT, is fueling this transition.
Dominant Regions, Countries, or Segments in MEA Cloud Computing
The UAE and Saudi Arabia are currently the leading countries in the MEA cloud computing market, driven by substantial investments in digital infrastructure and government initiatives. South Africa shows promising growth potential. The Public Cloud segment holds the largest market share.
- Key Drivers in the UAE & Saudi Arabia:
- Significant investments in digital infrastructure projects.
- Government support and incentives for cloud adoption.
- Strong presence of multinational cloud providers.
- Growth Potential in South Africa: Expanding digital economy and increasing investment in technology infrastructure.
- Market Share and Growth Potential: The UAE holds an estimated xx% market share in 2025, with Saudi Arabia at xx%. South Africa’s market share is projected to increase from xx% in 2025 to xx% in 2033.
MEA Cloud Computing Product Landscape
The MEA cloud computing market offers a diverse range of products and services, including Infrastructure-as-a-Service (IaaS), Platform-as-a-Service (PaaS), and Software-as-a-Service (SaaS). Innovation is evident in areas like serverless computing, edge computing, and AI-powered cloud solutions. Key players are focusing on developing unique selling propositions by offering customized solutions tailored to the specific needs of MEA businesses. Performance metrics continue to improve with advancements in network speed and security protocols.
Key Drivers, Barriers & Challenges in MEA Cloud Computing
Key Drivers: The market’s growth is primarily driven by the rising need for scalable IT infrastructure, increasing digital transformation initiatives, and government support for cloud adoption. The cost-effectiveness of cloud services compared to on-premise solutions is also a significant factor.
Key Challenges & Restraints: Limited digital literacy and skills shortage, coupled with data security and privacy concerns, are major challenges. Regulatory complexities and high initial investment costs for cloud adoption also pose hurdles for smaller businesses. Competition among cloud providers is intense, impacting pricing strategies.
Emerging Opportunities in MEA Cloud Computing
Untapped opportunities exist in several sectors, including healthcare, education, and the growing Fintech industry. The adoption of cloud technologies in the public sector is expected to significantly grow. Furthermore, the increasing use of AI and IoT applications is opening up new avenues for cloud service providers.
Growth Accelerators in the MEA Cloud Computing Industry
Several factors will accelerate long-term growth. These include continued government support, increasing investment in digital infrastructure, partnerships between cloud providers and local businesses, and the expansion of high-speed internet access across the region. Furthermore, the focus on developing local cloud expertise will enhance the industry's overall growth trajectory.
Notable Milestones in MEA Cloud Computing Sector
- 2020: Launch of several regional cloud data centers by major providers.
- 2021: Increased government initiatives focusing on digital transformation.
- 2022: Significant investments in cybersecurity infrastructure by major cloud providers.
- 2023: Several strategic partnerships between cloud providers and local businesses were formed.
- 2024: Launch of new cloud-based services tailored to the specific needs of MEA businesses.
In-Depth MEA Cloud Computing Market Outlook
The MEA cloud computing market is poised for continued robust growth, driven by expanding digital economies, rising adoption rates, and government support. The increasing demand for innovative cloud-based solutions will present significant opportunities for cloud service providers. Strategic partnerships and investment in local talent will be crucial for maximizing market penetration and capturing the region's immense growth potential. The focus on security and data privacy will be paramount in building trust and driving further adoption.
MEA Cloud Computing Segmentation
-
1. Application
- 1.1. SMEs
- 1.2. Healthcare
- 1.3. Others
-
2. Types
- 2.1. Public Cloud
- 2.2. Private Cloud
MEA Cloud Computing Segmentation By Geography
-
1. North America
- 1.1. United States
- 1.2. Canada
- 1.3. Mexico
-
2. South America
- 2.1. Brazil
- 2.2. Argentina
- 2.3. Rest of South America
-
3. Europe
- 3.1. United Kingdom
- 3.2. Germany
- 3.3. France
- 3.4. Italy
- 3.5. Spain
- 3.6. Russia
- 3.7. Benelux
- 3.8. Nordics
- 3.9. Rest of Europe
-
4. Middle East & Africa
- 4.1. Turkey
- 4.2. Israel
- 4.3. GCC
- 4.4. North Africa
- 4.5. South Africa
- 4.6. Rest of Middle East & Africa
-
5. Asia Pacific
- 5.1. China
- 5.2. India
- 5.3. Japan
- 5.4. South Korea
- 5.5. ASEAN
- 5.6. Oceania
- 5.7. Rest of Asia Pacific
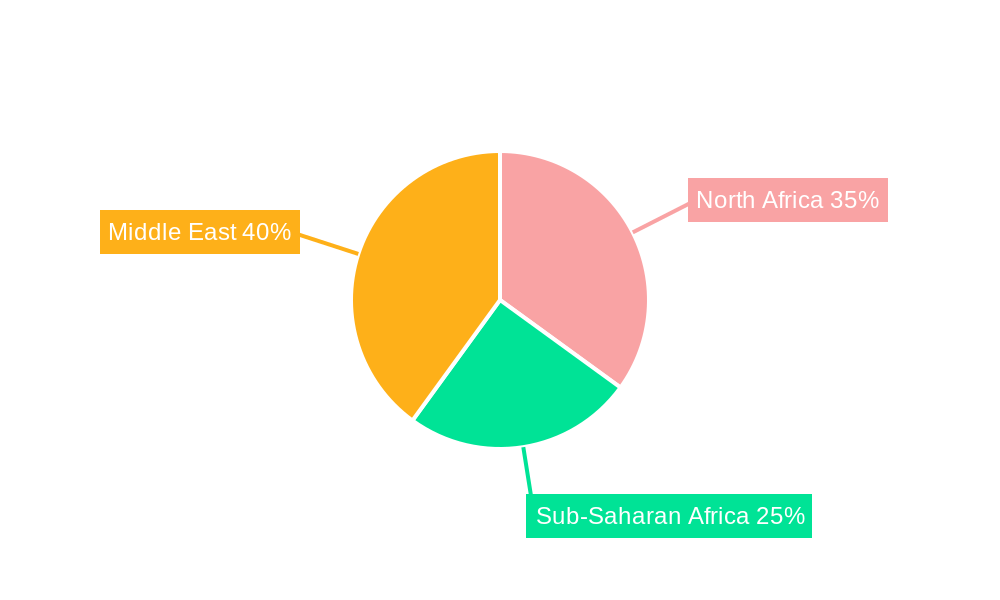
MEA Cloud Computing Regional Market Share
Geographic Coverage of MEA Cloud Computing
MEA Cloud Computing REPORT HIGHLIGHTS
| Aspects | Details |
|---|---|
| Study Period | 2020-2034 |
| Base Year | 2025 |
| Estimated Year | 2026 |
| Forecast Period | 2026-2034 |
| Historical Period | 2020-2025 |
| Growth Rate | CAGR of 18.8% from 2020-2034 |
| Segmentation |
|
Table of Contents
- 1. Introduction
- 1.1. Research Scope
- 1.2. Market Segmentation
- 1.3. Research Objective
- 1.4. Definitions and Assumptions
- 2. Executive Summary
- 2.1. Market Snapshot
- 3. Market Dynamics
- 3.1. Market Drivers
- 3.2. Market Restrains
- 3.3. Market Trends
- 3.4. Market Opportunities
- 4. Market Factor Analysis
- 4.1. Porters Five Forces
- 4.1.1. Bargaining Power of Suppliers
- 4.1.2. Bargaining Power of Buyers
- 4.1.3. Threat of New Entrants
- 4.1.4. Threat of Substitutes
- 4.1.5. Competitive Rivalry
- 4.2. PESTEL analysis
- 4.3. BCG Analysis
- 4.3.1. Stars (High Growth, High Market Share)
- 4.3.2. Cash Cows (Low Growth, High Market Share)
- 4.3.3. Question Mark (High Growth, Low Market Share)
- 4.3.4. Dogs (Low Growth, Low Market Share)
- 4.4. Ansoff Matrix Analysis
- 4.5. Supply Chain Analysis
- 4.6. Regulatory Landscape
- 4.7. Current Market Potential and Opportunity Assessment (TAM–SAM–SOM Framework)
- 4.8. NRP Analyst Note
- 4.1. Porters Five Forces
- 5. Market Analysis, Insights and Forecast 2021-2033
- 5.1. Market Analysis, Insights and Forecast - by Application
- 5.1.1. SMEs
- 5.1.2. Healthcare
- 5.1.3. Others
- 5.2. Market Analysis, Insights and Forecast - by Types
- 5.2.1. Public Cloud
- 5.2.2. Private Cloud
- 5.3. Market Analysis, Insights and Forecast - by Region
- 5.3.1. North America
- 5.3.2. South America
- 5.3.3. Europe
- 5.3.4. Middle East & Africa
- 5.3.5. Asia Pacific
- 5.1. Market Analysis, Insights and Forecast - by Application
- 6. Global MEA Cloud Computing Analysis, Insights and Forecast, 2021-2033
- 6.1. Market Analysis, Insights and Forecast - by Application
- 6.1.1. SMEs
- 6.1.2. Healthcare
- 6.1.3. Others
- 6.2. Market Analysis, Insights and Forecast - by Types
- 6.2.1. Public Cloud
- 6.2.2. Private Cloud
- 6.1. Market Analysis, Insights and Forecast - by Application
- 7. North America MEA Cloud Computing Analysis, Insights and Forecast, 2020-2032
- 7.1. Market Analysis, Insights and Forecast - by Application
- 7.1.1. SMEs
- 7.1.2. Healthcare
- 7.1.3. Others
- 7.2. Market Analysis, Insights and Forecast - by Types
- 7.2.1. Public Cloud
- 7.2.2. Private Cloud
- 7.1. Market Analysis, Insights and Forecast - by Application
- 8. South America MEA Cloud Computing Analysis, Insights and Forecast, 2020-2032
- 8.1. Market Analysis, Insights and Forecast - by Application
- 8.1.1. SMEs
- 8.1.2. Healthcare
- 8.1.3. Others
- 8.2. Market Analysis, Insights and Forecast - by Types
- 8.2.1. Public Cloud
- 8.2.2. Private Cloud
- 8.1. Market Analysis, Insights and Forecast - by Application
- 9. Europe MEA Cloud Computing Analysis, Insights and Forecast, 2020-2032
- 9.1. Market Analysis, Insights and Forecast - by Application
- 9.1.1. SMEs
- 9.1.2. Healthcare
- 9.1.3. Others
- 9.2. Market Analysis, Insights and Forecast - by Types
- 9.2.1. Public Cloud
- 9.2.2. Private Cloud
- 9.1. Market Analysis, Insights and Forecast - by Application
- 10. Middle East & Africa MEA Cloud Computing Analysis, Insights and Forecast, 2020-2032
- 10.1. Market Analysis, Insights and Forecast - by Application
- 10.1.1. SMEs
- 10.1.2. Healthcare
- 10.1.3. Others
- 10.2. Market Analysis, Insights and Forecast - by Types
- 10.2.1. Public Cloud
- 10.2.2. Private Cloud
- 10.1. Market Analysis, Insights and Forecast - by Application
- 11. Asia Pacific MEA Cloud Computing Analysis, Insights and Forecast, 2020-2032
- 11.1. Market Analysis, Insights and Forecast - by Application
- 11.1.1. SMEs
- 11.1.2. Healthcare
- 11.1.3. Others
- 11.2. Market Analysis, Insights and Forecast - by Types
- 11.2.1. Public Cloud
- 11.2.2. Private Cloud
- 11.1. Market Analysis, Insights and Forecast - by Application
- 12. Competitive Analysis
- 12.1. Company Profiles
- 12.1.1 AWS
- 12.1.1.1. Company Overview
- 12.1.1.2. Products
- 12.1.1.3. Company Financials
- 12.1.1.4. SWOT Analysis
- 12.1.2 BIOS Middle East Group
- 12.1.2.1. Company Overview
- 12.1.2.2. Products
- 12.1.2.3. Company Financials
- 12.1.2.4. SWOT Analysis
- 12.1.3 CloudBox Tech
- 12.1.3.1. Company Overview
- 12.1.3.2. Products
- 12.1.3.3. Company Financials
- 12.1.3.4. SWOT Analysis
- 12.1.4 eHosting DataFort
- 12.1.4.1. Company Overview
- 12.1.4.2. Products
- 12.1.4.3. Company Financials
- 12.1.4.4. SWOT Analysis
- 12.1.5 Fujitsu
- 12.1.5.1. Company Overview
- 12.1.5.2. Products
- 12.1.5.3. Company Financials
- 12.1.5.4. SWOT Analysis
- 12.1.6 Google
- 12.1.6.1. Company Overview
- 12.1.6.2. Products
- 12.1.6.3. Company Financials
- 12.1.6.4. SWOT Analysis
- 12.1.7 Gulf business Machines
- 12.1.7.1. Company Overview
- 12.1.7.2. Products
- 12.1.7.3. Company Financials
- 12.1.7.4. SWOT Analysis
- 12.1.8 IBM
- 12.1.8.1. Company Overview
- 12.1.8.2. Products
- 12.1.8.3. Company Financials
- 12.1.8.4. SWOT Analysis
- 12.1.9 Injazat Data Systems
- 12.1.9.1. Company Overview
- 12.1.9.2. Products
- 12.1.9.3. Company Financials
- 12.1.9.4. SWOT Analysis
- 12.1.10 Insomea Computer Solutions
- 12.1.10.1. Company Overview
- 12.1.10.2. Products
- 12.1.10.3. Company Financials
- 12.1.10.4. SWOT Analysis
- 12.1.11 Microsoft
- 12.1.11.1. Company Overview
- 12.1.11.2. Products
- 12.1.11.3. Company Financials
- 12.1.11.4. SWOT Analysis
- 12.1.12 Ooredoo
- 12.1.12.1. Company Overview
- 12.1.12.2. Products
- 12.1.12.3. Company Financials
- 12.1.12.4. SWOT Analysis
- 12.1.13 STC Cloud
- 12.1.13.1. Company Overview
- 12.1.13.2. Products
- 12.1.13.3. Company Financials
- 12.1.13.4. SWOT Analysis
- 12.1.1 AWS
- 12.2. Market Entropy
- 12.2.1 Company's Key Areas Served
- 12.2.2 Recent Developments
- 12.3. Company Market Share Analysis 2025
- 12.3.1 Top 5 Companies Market Share Analysis
- 12.3.2 Top 3 Companies Market Share Analysis
- 12.4. List of Potential Customers
- 13. Research Methodology
List of Figures
- Figure 1: Global MEA Cloud Computing Revenue Breakdown (undefined, %) by Region 2025 & 2033
- Figure 2: North America MEA Cloud Computing Revenue (undefined), by Application 2025 & 2033
- Figure 3: North America MEA Cloud Computing Revenue Share (%), by Application 2025 & 2033
- Figure 4: North America MEA Cloud Computing Revenue (undefined), by Types 2025 & 2033
- Figure 5: North America MEA Cloud Computing Revenue Share (%), by Types 2025 & 2033
- Figure 6: North America MEA Cloud Computing Revenue (undefined), by Country 2025 & 2033
- Figure 7: North America MEA Cloud Computing Revenue Share (%), by Country 2025 & 2033
- Figure 8: South America MEA Cloud Computing Revenue (undefined), by Application 2025 & 2033
- Figure 9: South America MEA Cloud Computing Revenue Share (%), by Application 2025 & 2033
- Figure 10: South America MEA Cloud Computing Revenue (undefined), by Types 2025 & 2033
- Figure 11: South America MEA Cloud Computing Revenue Share (%), by Types 2025 & 2033
- Figure 12: South America MEA Cloud Computing Revenue (undefined), by Country 2025 & 2033
- Figure 13: South America MEA Cloud Computing Revenue Share (%), by Country 2025 & 2033
- Figure 14: Europe MEA Cloud Computing Revenue (undefined), by Application 2025 & 2033
- Figure 15: Europe MEA Cloud Computing Revenue Share (%), by Application 2025 & 2033
- Figure 16: Europe MEA Cloud Computing Revenue (undefined), by Types 2025 & 2033
- Figure 17: Europe MEA Cloud Computing Revenue Share (%), by Types 2025 & 2033
- Figure 18: Europe MEA Cloud Computing Revenue (undefined), by Country 2025 & 2033
- Figure 19: Europe MEA Cloud Computing Revenue Share (%), by Country 2025 & 2033
- Figure 20: Middle East & Africa MEA Cloud Computing Revenue (undefined), by Application 2025 & 2033
- Figure 21: Middle East & Africa MEA Cloud Computing Revenue Share (%), by Application 2025 & 2033
- Figure 22: Middle East & Africa MEA Cloud Computing Revenue (undefined), by Types 2025 & 2033
- Figure 23: Middle East & Africa MEA Cloud Computing Revenue Share (%), by Types 2025 & 2033
- Figure 24: Middle East & Africa MEA Cloud Computing Revenue (undefined), by Country 2025 & 2033
- Figure 25: Middle East & Africa MEA Cloud Computing Revenue Share (%), by Country 2025 & 2033
- Figure 26: Asia Pacific MEA Cloud Computing Revenue (undefined), by Application 2025 & 2033
- Figure 27: Asia Pacific MEA Cloud Computing Revenue Share (%), by Application 2025 & 2033
- Figure 28: Asia Pacific MEA Cloud Computing Revenue (undefined), by Types 2025 & 2033
- Figure 29: Asia Pacific MEA Cloud Computing Revenue Share (%), by Types 2025 & 2033
- Figure 30: Asia Pacific MEA Cloud Computing Revenue (undefined), by Country 2025 & 2033
- Figure 31: Asia Pacific MEA Cloud Computing Revenue Share (%), by Country 2025 & 2033
List of Tables
- Table 1: Global MEA Cloud Computing Revenue undefined Forecast, by Application 2020 & 2033
- Table 2: Global MEA Cloud Computing Revenue undefined Forecast, by Types 2020 & 2033
- Table 3: Global MEA Cloud Computing Revenue undefined Forecast, by Region 2020 & 2033
- Table 4: Global MEA Cloud Computing Revenue undefined Forecast, by Application 2020 & 2033
- Table 5: Global MEA Cloud Computing Revenue undefined Forecast, by Types 2020 & 2033
- Table 6: Global MEA Cloud Computing Revenue undefined Forecast, by Country 2020 & 2033
- Table 7: United States MEA Cloud Computing Revenue (undefined) Forecast, by Application 2020 & 2033
- Table 8: Canada MEA Cloud Computing Revenue (undefined) Forecast, by Application 2020 & 2033
- Table 9: Mexico MEA Cloud Computing Revenue (undefined) Forecast, by Application 2020 & 2033
- Table 10: Global MEA Cloud Computing Revenue undefined Forecast, by Application 2020 & 2033
- Table 11: Global MEA Cloud Computing Revenue undefined Forecast, by Types 2020 & 2033
- Table 12: Global MEA Cloud Computing Revenue undefined Forecast, by Country 2020 & 2033
- Table 13: Brazil MEA Cloud Computing Revenue (undefined) Forecast, by Application 2020 & 2033
- Table 14: Argentina MEA Cloud Computing Revenue (undefined) Forecast, by Application 2020 & 2033
- Table 15: Rest of South America MEA Cloud Computing Revenue (undefined) Forecast, by Application 2020 & 2033
- Table 16: Global MEA Cloud Computing Revenue undefined Forecast, by Application 2020 & 2033
- Table 17: Global MEA Cloud Computing Revenue undefined Forecast, by Types 2020 & 2033
- Table 18: Global MEA Cloud Computing Revenue undefined Forecast, by Country 2020 & 2033
- Table 19: United Kingdom MEA Cloud Computing Revenue (undefined) Forecast, by Application 2020 & 2033
- Table 20: Germany MEA Cloud Computing Revenue (undefined) Forecast, by Application 2020 & 2033
- Table 21: France MEA Cloud Computing Revenue (undefined) Forecast, by Application 2020 & 2033
- Table 22: Italy MEA Cloud Computing Revenue (undefined) Forecast, by Application 2020 & 2033
- Table 23: Spain MEA Cloud Computing Revenue (undefined) Forecast, by Application 2020 & 2033
- Table 24: Russia MEA Cloud Computing Revenue (undefined) Forecast, by Application 2020 & 2033
- Table 25: Benelux MEA Cloud Computing Revenue (undefined) Forecast, by Application 2020 & 2033
- Table 26: Nordics MEA Cloud Computing Revenue (undefined) Forecast, by Application 2020 & 2033
- Table 27: Rest of Europe MEA Cloud Computing Revenue (undefined) Forecast, by Application 2020 & 2033
- Table 28: Global MEA Cloud Computing Revenue undefined Forecast, by Application 2020 & 2033
- Table 29: Global MEA Cloud Computing Revenue undefined Forecast, by Types 2020 & 2033
- Table 30: Global MEA Cloud Computing Revenue undefined Forecast, by Country 2020 & 2033
- Table 31: Turkey MEA Cloud Computing Revenue (undefined) Forecast, by Application 2020 & 2033
- Table 32: Israel MEA Cloud Computing Revenue (undefined) Forecast, by Application 2020 & 2033
- Table 33: GCC MEA Cloud Computing Revenue (undefined) Forecast, by Application 2020 & 2033
- Table 34: North Africa MEA Cloud Computing Revenue (undefined) Forecast, by Application 2020 & 2033
- Table 35: South Africa MEA Cloud Computing Revenue (undefined) Forecast, by Application 2020 & 2033
- Table 36: Rest of Middle East & Africa MEA Cloud Computing Revenue (undefined) Forecast, by Application 2020 & 2033
- Table 37: Global MEA Cloud Computing Revenue undefined Forecast, by Application 2020 & 2033
- Table 38: Global MEA Cloud Computing Revenue undefined Forecast, by Types 2020 & 2033
- Table 39: Global MEA Cloud Computing Revenue undefined Forecast, by Country 2020 & 2033
- Table 40: China MEA Cloud Computing Revenue (undefined) Forecast, by Application 2020 & 2033
- Table 41: India MEA Cloud Computing Revenue (undefined) Forecast, by Application 2020 & 2033
- Table 42: Japan MEA Cloud Computing Revenue (undefined) Forecast, by Application 2020 & 2033
- Table 43: South Korea MEA Cloud Computing Revenue (undefined) Forecast, by Application 2020 & 2033
- Table 44: ASEAN MEA Cloud Computing Revenue (undefined) Forecast, by Application 2020 & 2033
- Table 45: Oceania MEA Cloud Computing Revenue (undefined) Forecast, by Application 2020 & 2033
- Table 46: Rest of Asia Pacific MEA Cloud Computing Revenue (undefined) Forecast, by Application 2020 & 2033
Frequently Asked Questions
1. What is the projected Compound Annual Growth Rate (CAGR) of the MEA Cloud Computing?
The projected CAGR is approximately 18.8%.
2. Which companies are prominent players in the MEA Cloud Computing?
Key companies in the market include AWS, BIOS Middle East Group, CloudBox Tech, eHosting DataFort, Fujitsu, Google, Gulf business Machines, IBM, Injazat Data Systems, Insomea Computer Solutions, Microsoft, Ooredoo, STC Cloud.
3. What are the main segments of the MEA Cloud Computing?
The market segments include Application, Types.
4. Can you provide details about the market size?
The market size is estimated to be USD XXX N/A as of 2022.
5. What are some drivers contributing to market growth?
N/A
6. What are the notable trends driving market growth?
N/A
7. Are there any restraints impacting market growth?
N/A
8. Can you provide examples of recent developments in the market?
N/A
9. What pricing options are available for accessing the report?
Pricing options include single-user, multi-user, and enterprise licenses priced at USD 3350.00, USD 5025.00, and USD 6700.00 respectively.
10. Is the market size provided in terms of value or volume?
The market size is provided in terms of value, measured in N/A.
11. Are there any specific market keywords associated with the report?
Yes, the market keyword associated with the report is "MEA Cloud Computing," which aids in identifying and referencing the specific market segment covered.
12. How do I determine which pricing option suits my needs best?
The pricing options vary based on user requirements and access needs. Individual users may opt for single-user licenses, while businesses requiring broader access may choose multi-user or enterprise licenses for cost-effective access to the report.
13. Are there any additional resources or data provided in the MEA Cloud Computing report?
While the report offers comprehensive insights, it's advisable to review the specific contents or supplementary materials provided to ascertain if additional resources or data are available.
14. How can I stay updated on further developments or reports in the MEA Cloud Computing?
To stay informed about further developments, trends, and reports in the MEA Cloud Computing, consider subscribing to industry newsletters, following relevant companies and organizations, or regularly checking reputable industry news sources and publications.
Methodology
Step 1 - Identification of Relevant Samples Size from Population Database


Step 2 - Approaches for Defining Global Market Size (Value, Volume* & Price*)

Note*: In applicable scenarios
Step 3 - Data Sources
Primary Research
- Web Analytics
- Survey Reports
- Research Institute
- Latest Research Reports
- Opinion Leaders
Secondary Research
- Annual Reports
- White Paper
- Latest Press Release
- Industry Association
- Paid Database
- Investor Presentations

Step 4 - Data Triangulation
Involves using different sources of information in order to increase the validity of a study
These sources are likely to be stakeholders in a program - participants, other researchers, program staff, other community members, and so on.
Then we put all data in single framework & apply various statistical tools to find out the dynamic on the market.
During the analysis stage, feedback from the stakeholder groups would be compared to determine areas of agreement as well as areas of divergence