

Key Insights
The MEA Talent Management Software market is poised for significant expansion, projected to reach $0.41 Million by 2025, with a robust Compound Annual Growth Rate (CAGR) of 8.38% anticipated through 2033. This growth is fueled by an increasing recognition among businesses in the Middle East and Africa of the critical role strategic human capital management plays in achieving organizational objectives and fostering competitive advantage. Key drivers include the escalating demand for integrated solutions that streamline recruitment, onboarding, performance management, and employee development processes. Furthermore, the growing emphasis on employee engagement and retention, particularly in light of the "Great Resignation" and evolving workforce expectations, is compelling organizations to invest in sophisticated talent management tools. The digital transformation initiatives across various sectors in the MEA region are also creating fertile ground for the adoption of cloud-based talent management solutions, offering scalability and accessibility.
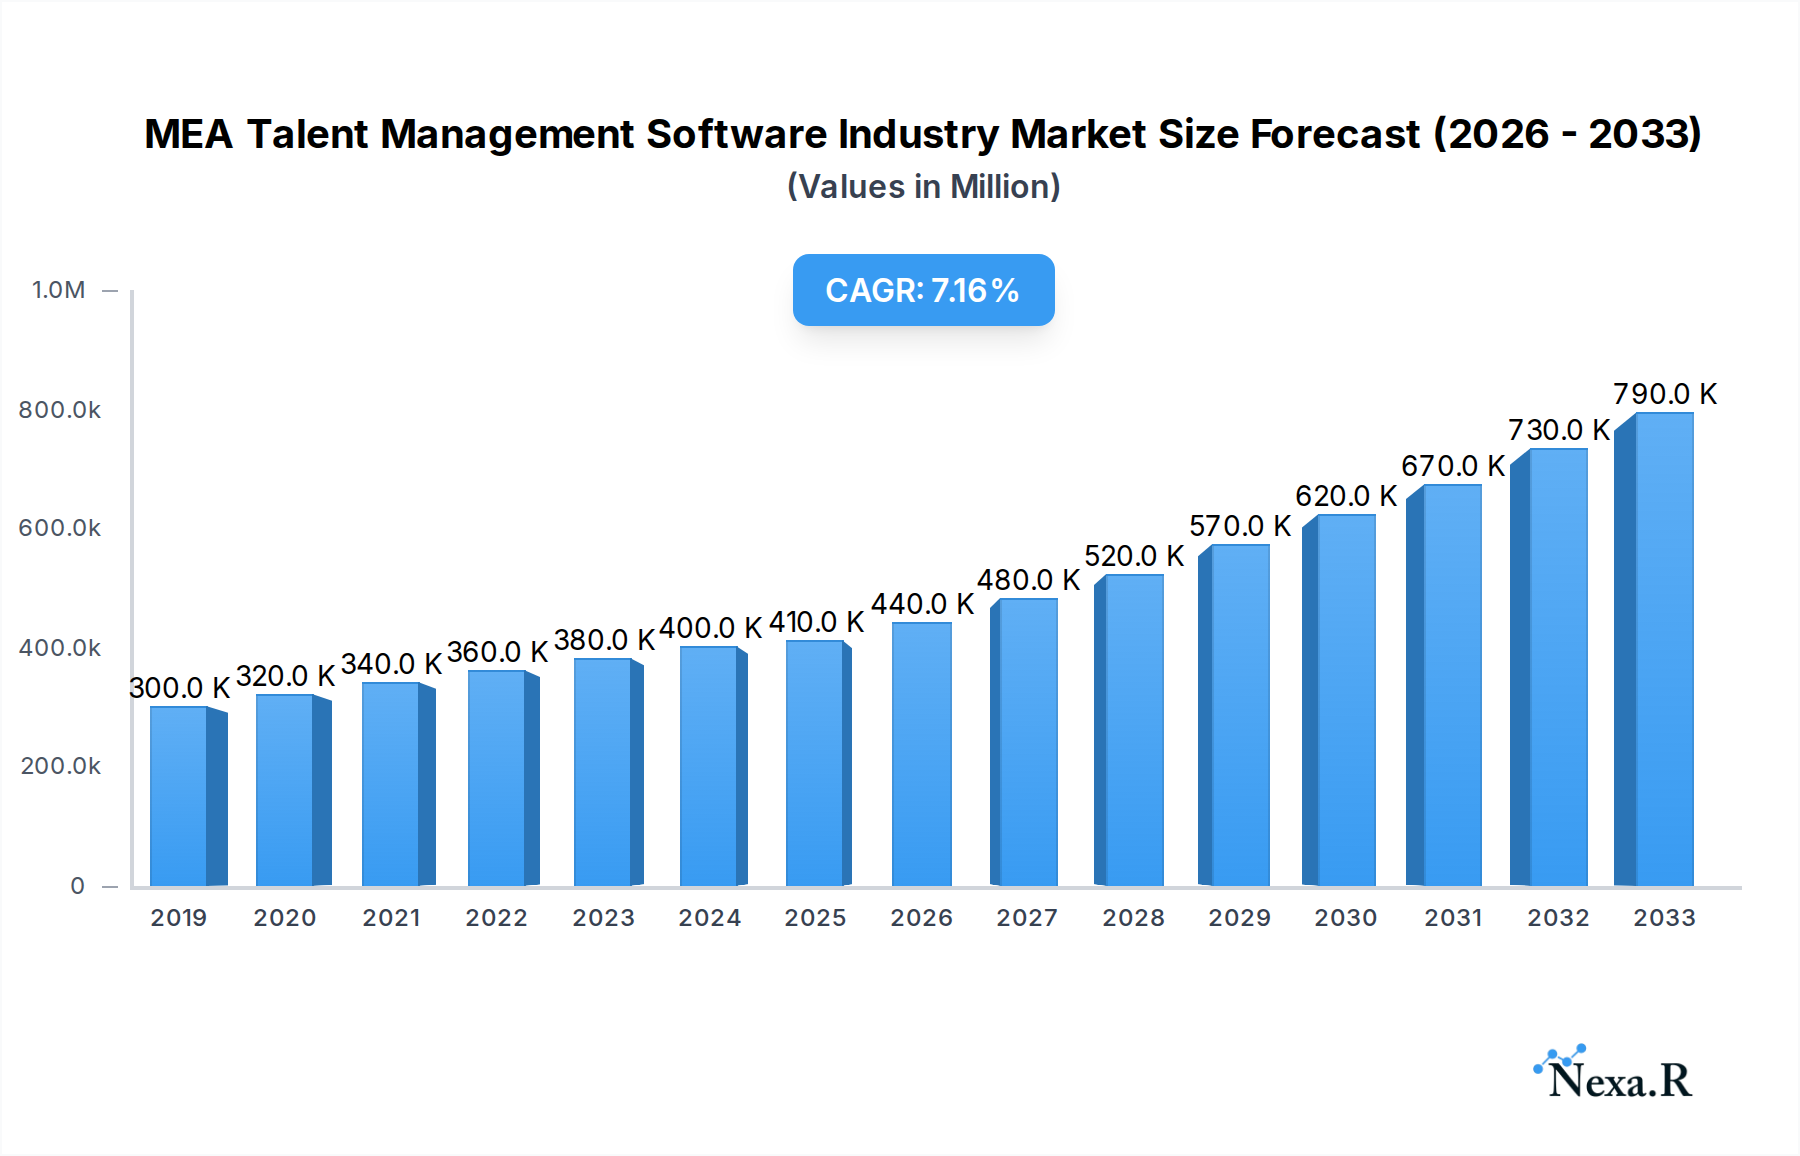
MEA Talent Management Software Industry Market Size (In Million)
The MEA talent management software landscape is characterized by a diverse range of segments addressing specific HR needs. Workforce Scheduling and Workforce Analytics are crucial for optimizing labor costs and gaining insights into workforce productivity. Time and Attendance Management systems are fundamental for accurate payroll processing and compliance. Performance and Goal Management tools are essential for aligning individual contributions with organizational strategies and driving employee development. Absence and Leave Management ensures smooth operational continuity and compliance with labor laws. The market is segmented by deployment modes, with a notable shift towards cloud-based solutions due to their flexibility, cost-effectiveness, and ease of implementation compared to traditional on-premise systems. The adoption of these solutions spans across vital end-user verticals such as BFSI, Consumer Goods and Retail, Healthcare, and Manufacturing, all striving to attract, develop, and retain top talent in their respective competitive arenas.

MEA Talent Management Software Industry Company Market Share
Unlock critical insights into the dynamic Middle East & Africa (MEA) Talent Management Software (TMS) industry. This in-depth report provides a comprehensive analysis of market trends, key players, growth drivers, and future opportunities, essential for strategic decision-making. Covering the period from 2019 to 2033, with a base year of 2025 and a forecast period of 2025–2033, this report offers a detailed view of the market's evolution and potential.
MEA Talent Management Software Industry Market Dynamics & Structure
The MEA Talent Management Software industry is characterized by a moderately concentrated market, driven by increasing adoption of cloud-based solutions and a growing emphasis on employee development and retention across various end-user verticals. Key technological innovation drivers include advancements in AI and machine learning for predictive analytics, automation of HR processes, and enhanced user experience. Regulatory frameworks, while evolving, are increasingly supportive of digital transformation in HR, particularly in areas like data privacy and workforce compliance. Competitive product substitutes exist in the form of integrated HR suites and standalone niche solutions, but the dedicated TMS market continues to gain traction. End-user demographics are shifting towards younger, tech-savvy workforces demanding more personalized and efficient talent management experiences. Mergers and acquisitions (M&A) trends, with an estimated xx deal volumes historically, indicate a consolidation phase as larger players acquire innovative startups to expand their offerings and market reach. For instance, the acquisition of Reflexis Systems Inc. by Zebra Technologies underscored the growing importance of workforce management solutions. Barriers to innovation include the cost of implementing advanced TMS solutions and the need for skilled IT personnel to manage and integrate these systems.
- Market Concentration: Moderately concentrated, with a few key players holding significant market share.
- Technological Innovation Drivers: AI/ML for analytics, automation, enhanced UX, predictive capabilities.
- Regulatory Frameworks: Evolving, with a trend towards supporting digital HR transformation and data privacy.
- Competitive Substitutes: Integrated HR suites, niche standalone HR tools.
- End-User Demographics: Younger, tech-savvy workforce driving demand for personalized solutions.
- M&A Trends: Active consolidation, with xx deals in the historical period, driven by expansion and acquisition of specialized capabilities.
- Innovation Barriers: Implementation costs, demand for skilled IT professionals.
MEA Talent Management Software Industry Growth Trends & Insights
The MEA Talent Management Software market is poised for robust expansion, driven by increasing digitalization efforts across the region and a growing recognition of the strategic importance of human capital. The market size is projected to grow from an estimated $XXX million in 2025 to $XXX million by 2033, exhibiting a Compound Annual Growth Rate (CAGR) of XX% during the forecast period. Adoption rates are accelerating, particularly for cloud-based TMS solutions, due to their scalability, cost-effectiveness, and accessibility. Technological disruptions, such as the integration of AI for personalized learning paths and advanced recruitment analytics, are reshaping how organizations manage their talent. Consumer behavior shifts are evident, with employees expecting more sophisticated and user-friendly HR tools that mirror their experiences with consumer applications. This is pushing TMS providers to focus on intuitive interfaces and mobile accessibility. The penetration of TMS solutions is expected to deepen significantly, especially within larger enterprises and rapidly growing sectors like healthcare and retail. The shift towards remote and hybrid work models is further fueling the demand for robust digital tools that can effectively manage a dispersed workforce, monitor performance, and foster engagement. The increasing focus on employee well-being and retention is also a significant catalyst for TMS adoption, as organizations seek to identify and nurture top talent and mitigate attrition risks.
Dominant Regions, Countries, or Segments in MEA Talent Management Software Industry
The Cloud deployment mode is emerging as the dominant force within the MEA Talent Management Software industry, significantly outpacing on-premise solutions. This dominance is propelled by the inherent advantages of cloud-based TMS, including scalability, flexibility, reduced IT infrastructure costs, and quicker deployment times. The Middle East, particularly countries like the United Arab Emirates and Saudi Arabia, are leading this shift due to strong government initiatives promoting digital transformation and a conducive business environment for technology adoption.
- Deployment Mode Dominance (Cloud):
- Scalability and Flexibility: Cloud solutions easily adapt to fluctuating business needs, accommodating growth or contraction without significant hardware investments.
- Cost-Effectiveness: Reduced upfront capital expenditure on hardware and software licenses, with predictable subscription-based pricing.
- Accessibility: Enables remote access for employees and HR professionals, crucial for the growing remote and hybrid workforces in MEA.
- Faster Deployment: Quicker implementation cycles compared to on-premise solutions, allowing businesses to realize benefits sooner.
- Automatic Updates and Maintenance: Providers handle software updates and maintenance, reducing the burden on internal IT teams.
Among the End-user Verticals, Consumer Goods and Retail is exhibiting significant market leadership, driven by the sector's high employee turnover, the need for efficient workforce scheduling and time and attendance management, and the increasing focus on employee experience to improve customer service. The sheer volume of frontline workers in this sector necessitates sophisticated TMS solutions.
- End-user Vertical Dominance (Consumer Goods and Retail):
- Large Workforce Management Needs: High employee numbers require robust tools for scheduling, time tracking, and payroll.
- Frontline Worker Focus: Emphasis on employee engagement and retention in a high-turnover industry.
- Performance Management: Need for tools to track sales performance and identify high-performing individuals.
- Compliance and Labor Laws: Complex labor regulations require accurate time and attendance tracking.
- Seasonal Fluctuations: Ability to easily scale workforce and schedules during peak seasons.
Within the Type segment, Workforce Scheduling and Workforce Analytics is a key driver of market growth. The ability to optimize labor costs through efficient scheduling and gain actionable insights from workforce data is paramount for businesses across MEA.
- Type Dominance (Workforce Scheduling and Workforce Analytics):
- Cost Optimization: Efficiently aligning staffing levels with demand reduces labor expenses.
- Productivity Enhancement: Ensuring the right staff are in place at the right times maximizes operational efficiency.
- Data-Driven Decision Making: Analytics provide insights into labor costs, employee performance, and scheduling effectiveness.
- Predictive Staffing: Forecasting future staffing needs based on historical data and business trends.
- Employee Satisfaction: Optimized schedules can lead to better work-life balance for employees.
MEA Talent Management Software Industry Product Landscape
The MEA Talent Management Software industry is witnessing a surge in product innovations focused on AI-driven analytics, personalized employee experiences, and seamless integration capabilities. Solutions are increasingly offering advanced features like predictive performance forecasting, personalized learning and development pathways, and sophisticated employee engagement tools. Companies are prioritizing mobile-first design and intuitive user interfaces to cater to a diverse workforce. The integration of advanced analytics allows for deeper insights into talent acquisition, performance management, and succession planning, empowering organizations to make data-driven decisions. Unique selling propositions often revolve around specialized modules for specific HR functions, robust reporting dashboards, and the ability to customize workflows to align with unique organizational needs. Technological advancements are also emphasizing enhanced security protocols and compliance with regional data protection regulations.
Key Drivers, Barriers & Challenges in MEA Talent Management Software Industry
Key Drivers:
- Digital Transformation Initiatives: Government and corporate drives to digitize operations are a primary catalyst.
- Growing Demand for Skilled Workforce: Companies are investing in talent development and retention to bridge skill gaps.
- Increasing Employee Expectations: A tech-savvy workforce demands modern, user-friendly HR tools.
- Focus on Operational Efficiency: Businesses are seeking to optimize labor costs and improve productivity.
- Cloud Adoption: The widespread acceptance and benefits of cloud computing fuel TMS adoption.
Barriers & Challenges:
- Implementation Costs: The initial investment in sophisticated TMS can be a deterrent for smaller businesses.
- Data Security and Privacy Concerns: Ensuring compliance with regional data protection laws and safeguarding sensitive employee information is crucial.
- Lack of Skilled IT Professionals: Integrating and managing complex TMS solutions requires specialized expertise.
- Resistance to Change: Overcoming employee and management resistance to new HR technologies can be challenging.
- Fragmented Market: A diverse range of providers can make selecting the right solution complex for buyers.
Emerging Opportunities in MEA Talent Management Software Industry
Emerging opportunities in the MEA TMS market lie in catering to the burgeoning SME sector, which is increasingly recognizing the need for efficient HR practices. There's a growing demand for specialized TMS solutions focused on specific industries like healthcare and education, which have unique workforce management requirements. The development of AI-powered chatbots for HR support and employee self-service portals presents a significant opportunity to enhance user experience and streamline HR operations. Furthermore, the trend towards a more engaged and purpose-driven workforce is creating demand for TMS features that support employee well-being, diversity and inclusion initiatives, and personalized career development paths. The expansion of remote and hybrid work models also opens avenues for TMS providers to offer solutions that facilitate effective virtual team management and collaboration.
Growth Accelerators in the MEA Talent Management Software Industry Industry
Long-term growth in the MEA Talent Management Software industry will be significantly accelerated by advancements in artificial intelligence and machine learning, enabling more predictive and personalized talent strategies. Strategic partnerships between TMS providers and other HR technology vendors, as well as with consultancies, will broaden market reach and offer integrated solutions. Market expansion strategies focusing on underserved regions within MEA and niche industry verticals will unlock new revenue streams. The increasing emphasis on data analytics and business intelligence within HR functions will further drive the adoption of sophisticated TMS capabilities. Furthermore, evolving regulatory landscapes that promote employee welfare and fair labor practices will indirectly boost the demand for comprehensive talent management solutions.
Key Players Shaping the MEA Talent Management Software Industry Market
- Workday Inc
- Reflexis Systems Inc
- NICE Systems Ltd
- Roubler UK Limited Company
- IBM Corporation
- Blue Yonder Group Inc
- Active Operations Management International LLP
- Sage Group PLC
- Kronos Incorporated (UKG Inc )
- 7shifts
- ServiceMax Inc
- Infor Group
- Atoss Software AG
- Oracle Corporation
- ADP LLC
- Tamigo UK Ltd
- SISQUAL
- WorkForce Software LLC
- SAP SE
- Mitrefinch Ltd
- Kirona Solutions Limited
Notable Milestones in MEA Talent Management Software Industry Sector
- January 2023: BrightPlan launched a new workforce financial wellness gauge in MEA, offering AI-powered data-driven insights to identify workforce strengths and gaps.
- October 2022: Darwinbox expanded its presence in the Middle East by opening a new office at Dubai International Financial Centre (DIFC), strengthening its connections with regional enterprises, investors, and partners.
In-Depth MEA Talent Management Software Industry Market Outlook
The MEA Talent Management Software industry presents a promising future, driven by ongoing digital transformation and a strategic focus on human capital. Growth accelerators like AI-powered analytics, personalized employee development, and enhanced engagement tools will shape the market. The increasing adoption of cloud-based solutions, coupled with a growing understanding of the ROI from effective talent management, positions the industry for sustained expansion. Strategic partnerships and market expansion into emerging economies within MEA will further fuel this growth. Organizations that leverage advanced TMS capabilities will be best positioned to attract, develop, and retain top talent, thereby gaining a significant competitive advantage in the dynamic MEA business landscape.
MEA Talent Management Software Industry Segmentation
-
1. Type
- 1.1. Workforce Scheduling and Workforce Analytics
- 1.2. Time and Attendance Management
- 1.3. Performance and Goal Management
- 1.4. Absence and Leave Management
- 1.5. Other So
-
2. Deployment Mode
- 2.1. On-premise
- 2.2. Cloud
-
3. End-user Vertical
- 3.1. BFSI
- 3.2. Consumer Goods and Retail
- 3.3. Automotive
- 3.4. Energy and Utilities
- 3.5. Healthcare
- 3.6. Manufacturing
- 3.7. Other End-user Verticals
MEA Talent Management Software Industry Segmentation By Geography
-
1. North America
- 1.1. United States
- 1.2. Canada
- 1.3. Mexico
-
2. South America
- 2.1. Brazil
- 2.2. Argentina
- 2.3. Rest of South America
-
3. Europe
- 3.1. United Kingdom
- 3.2. Germany
- 3.3. France
- 3.4. Italy
- 3.5. Spain
- 3.6. Russia
- 3.7. Benelux
- 3.8. Nordics
- 3.9. Rest of Europe
-
4. Middle East & Africa
- 4.1. Turkey
- 4.2. Israel
- 4.3. GCC
- 4.4. North Africa
- 4.5. South Africa
- 4.6. Rest of Middle East & Africa
-
5. Asia Pacific
- 5.1. China
- 5.2. India
- 5.3. Japan
- 5.4. South Korea
- 5.5. ASEAN
- 5.6. Oceania
- 5.7. Rest of Asia Pacific
MEA Talent Management Software Industry Regional Market Share
Geographic Coverage of MEA Talent Management Software Industry
MEA Talent Management Software Industry REPORT HIGHLIGHTS
| Aspects | Details |
|---|---|
| Study Period | 2020-2034 |
| Base Year | 2025 |
| Estimated Year | 2026 |
| Forecast Period | 2026-2034 |
| Historical Period | 2020-2025 |
| Growth Rate | CAGR of 8.38% from 2020-2034 |
| Segmentation |
|
Table of Contents
- 1. Introduction
- 1.1. Research Scope
- 1.2. Market Segmentation
- 1.3. Research Objective
- 1.4. Definitions and Assumptions
- 2. Executive Summary
- 2.1. Market Snapshot
- 3. Market Dynamics
- 3.1. Market Drivers
- 3.2. Market Restrains
- 3.3. Market Trends
- 3.4. Market Opportunities
- 4. Market Factor Analysis
- 4.1. Porters Five Forces
- 4.1.1. Bargaining Power of Suppliers
- 4.1.2. Bargaining Power of Buyers
- 4.1.3. Threat of New Entrants
- 4.1.4. Threat of Substitutes
- 4.1.5. Competitive Rivalry
- 4.2. PESTEL analysis
- 4.3. BCG Analysis
- 4.3.1. Stars (High Growth, High Market Share)
- 4.3.2. Cash Cows (Low Growth, High Market Share)
- 4.3.3. Question Mark (High Growth, Low Market Share)
- 4.3.4. Dogs (Low Growth, Low Market Share)
- 4.4. Ansoff Matrix Analysis
- 4.5. Supply Chain Analysis
- 4.6. Regulatory Landscape
- 4.7. Current Market Potential and Opportunity Assessment (TAM–SAM–SOM Framework)
- 4.8. NRP Analyst Note
- 4.1. Porters Five Forces
- 5. Market Analysis, Insights and Forecast 2021-2033
- 5.1. Market Analysis, Insights and Forecast - by Type
- 5.1.1. Workforce Scheduling and Workforce Analytics
- 5.1.2. Time and Attendance Management
- 5.1.3. Performance and Goal Management
- 5.1.4. Absence and Leave Management
- 5.1.5. Other So
- 5.2. Market Analysis, Insights and Forecast - by Deployment Mode
- 5.2.1. On-premise
- 5.2.2. Cloud
- 5.3. Market Analysis, Insights and Forecast - by End-user Vertical
- 5.3.1. BFSI
- 5.3.2. Consumer Goods and Retail
- 5.3.3. Automotive
- 5.3.4. Energy and Utilities
- 5.3.5. Healthcare
- 5.3.6. Manufacturing
- 5.3.7. Other End-user Verticals
- 5.4. Market Analysis, Insights and Forecast - by Region
- 5.4.1. North America
- 5.4.2. South America
- 5.4.3. Europe
- 5.4.4. Middle East & Africa
- 5.4.5. Asia Pacific
- 5.1. Market Analysis, Insights and Forecast - by Type
- 6. Global MEA Talent Management Software Industry Analysis, Insights and Forecast, 2021-2033
- 6.1. Market Analysis, Insights and Forecast - by Type
- 6.1.1. Workforce Scheduling and Workforce Analytics
- 6.1.2. Time and Attendance Management
- 6.1.3. Performance and Goal Management
- 6.1.4. Absence and Leave Management
- 6.1.5. Other So
- 6.2. Market Analysis, Insights and Forecast - by Deployment Mode
- 6.2.1. On-premise
- 6.2.2. Cloud
- 6.3. Market Analysis, Insights and Forecast - by End-user Vertical
- 6.3.1. BFSI
- 6.3.2. Consumer Goods and Retail
- 6.3.3. Automotive
- 6.3.4. Energy and Utilities
- 6.3.5. Healthcare
- 6.3.6. Manufacturing
- 6.3.7. Other End-user Verticals
- 6.1. Market Analysis, Insights and Forecast - by Type
- 7. North America MEA Talent Management Software Industry Analysis, Insights and Forecast, 2020-2032
- 7.1. Market Analysis, Insights and Forecast - by Type
- 7.1.1. Workforce Scheduling and Workforce Analytics
- 7.1.2. Time and Attendance Management
- 7.1.3. Performance and Goal Management
- 7.1.4. Absence and Leave Management
- 7.1.5. Other So
- 7.2. Market Analysis, Insights and Forecast - by Deployment Mode
- 7.2.1. On-premise
- 7.2.2. Cloud
- 7.3. Market Analysis, Insights and Forecast - by End-user Vertical
- 7.3.1. BFSI
- 7.3.2. Consumer Goods and Retail
- 7.3.3. Automotive
- 7.3.4. Energy and Utilities
- 7.3.5. Healthcare
- 7.3.6. Manufacturing
- 7.3.7. Other End-user Verticals
- 7.1. Market Analysis, Insights and Forecast - by Type
- 8. South America MEA Talent Management Software Industry Analysis, Insights and Forecast, 2020-2032
- 8.1. Market Analysis, Insights and Forecast - by Type
- 8.1.1. Workforce Scheduling and Workforce Analytics
- 8.1.2. Time and Attendance Management
- 8.1.3. Performance and Goal Management
- 8.1.4. Absence and Leave Management
- 8.1.5. Other So
- 8.2. Market Analysis, Insights and Forecast - by Deployment Mode
- 8.2.1. On-premise
- 8.2.2. Cloud
- 8.3. Market Analysis, Insights and Forecast - by End-user Vertical
- 8.3.1. BFSI
- 8.3.2. Consumer Goods and Retail
- 8.3.3. Automotive
- 8.3.4. Energy and Utilities
- 8.3.5. Healthcare
- 8.3.6. Manufacturing
- 8.3.7. Other End-user Verticals
- 8.1. Market Analysis, Insights and Forecast - by Type
- 9. Europe MEA Talent Management Software Industry Analysis, Insights and Forecast, 2020-2032
- 9.1. Market Analysis, Insights and Forecast - by Type
- 9.1.1. Workforce Scheduling and Workforce Analytics
- 9.1.2. Time and Attendance Management
- 9.1.3. Performance and Goal Management
- 9.1.4. Absence and Leave Management
- 9.1.5. Other So
- 9.2. Market Analysis, Insights and Forecast - by Deployment Mode
- 9.2.1. On-premise
- 9.2.2. Cloud
- 9.3. Market Analysis, Insights and Forecast - by End-user Vertical
- 9.3.1. BFSI
- 9.3.2. Consumer Goods and Retail
- 9.3.3. Automotive
- 9.3.4. Energy and Utilities
- 9.3.5. Healthcare
- 9.3.6. Manufacturing
- 9.3.7. Other End-user Verticals
- 9.1. Market Analysis, Insights and Forecast - by Type
- 10. Middle East & Africa MEA Talent Management Software Industry Analysis, Insights and Forecast, 2020-2032
- 10.1. Market Analysis, Insights and Forecast - by Type
- 10.1.1. Workforce Scheduling and Workforce Analytics
- 10.1.2. Time and Attendance Management
- 10.1.3. Performance and Goal Management
- 10.1.4. Absence and Leave Management
- 10.1.5. Other So
- 10.2. Market Analysis, Insights and Forecast - by Deployment Mode
- 10.2.1. On-premise
- 10.2.2. Cloud
- 10.3. Market Analysis, Insights and Forecast - by End-user Vertical
- 10.3.1. BFSI
- 10.3.2. Consumer Goods and Retail
- 10.3.3. Automotive
- 10.3.4. Energy and Utilities
- 10.3.5. Healthcare
- 10.3.6. Manufacturing
- 10.3.7. Other End-user Verticals
- 10.1. Market Analysis, Insights and Forecast - by Type
- 11. Asia Pacific MEA Talent Management Software Industry Analysis, Insights and Forecast, 2020-2032
- 11.1. Market Analysis, Insights and Forecast - by Type
- 11.1.1. Workforce Scheduling and Workforce Analytics
- 11.1.2. Time and Attendance Management
- 11.1.3. Performance and Goal Management
- 11.1.4. Absence and Leave Management
- 11.1.5. Other So
- 11.2. Market Analysis, Insights and Forecast - by Deployment Mode
- 11.2.1. On-premise
- 11.2.2. Cloud
- 11.3. Market Analysis, Insights and Forecast - by End-user Vertical
- 11.3.1. BFSI
- 11.3.2. Consumer Goods and Retail
- 11.3.3. Automotive
- 11.3.4. Energy and Utilities
- 11.3.5. Healthcare
- 11.3.6. Manufacturing
- 11.3.7. Other End-user Verticals
- 11.1. Market Analysis, Insights and Forecast - by Type
- 12. Competitive Analysis
- 12.1. Company Profiles
- 12.1.1 Workday Inc
- 12.1.1.1. Company Overview
- 12.1.1.2. Products
- 12.1.1.3. Company Financials
- 12.1.1.4. SWOT Analysis
- 12.1.2 Reflexis Systems Inc
- 12.1.2.1. Company Overview
- 12.1.2.2. Products
- 12.1.2.3. Company Financials
- 12.1.2.4. SWOT Analysis
- 12.1.3 NICE Systems Ltd
- 12.1.3.1. Company Overview
- 12.1.3.2. Products
- 12.1.3.3. Company Financials
- 12.1.3.4. SWOT Analysis
- 12.1.4 Roubler UK Limited Company
- 12.1.4.1. Company Overview
- 12.1.4.2. Products
- 12.1.4.3. Company Financials
- 12.1.4.4. SWOT Analysis
- 12.1.5 IBM Corporation
- 12.1.5.1. Company Overview
- 12.1.5.2. Products
- 12.1.5.3. Company Financials
- 12.1.5.4. SWOT Analysis
- 12.1.6 Blue Yonder Group Inc
- 12.1.6.1. Company Overview
- 12.1.6.2. Products
- 12.1.6.3. Company Financials
- 12.1.6.4. SWOT Analysis
- 12.1.7 Active Operations Management International LLP
- 12.1.7.1. Company Overview
- 12.1.7.2. Products
- 12.1.7.3. Company Financials
- 12.1.7.4. SWOT Analysis
- 12.1.8 Sage Group PLC
- 12.1.8.1. Company Overview
- 12.1.8.2. Products
- 12.1.8.3. Company Financials
- 12.1.8.4. SWOT Analysis
- 12.1.9 Kronos Incorporated (UKG Inc )
- 12.1.9.1. Company Overview
- 12.1.9.2. Products
- 12.1.9.3. Company Financials
- 12.1.9.4. SWOT Analysis
- 12.1.10 7shifts
- 12.1.10.1. Company Overview
- 12.1.10.2. Products
- 12.1.10.3. Company Financials
- 12.1.10.4. SWOT Analysis
- 12.1.11 ServiceMax Inc
- 12.1.11.1. Company Overview
- 12.1.11.2. Products
- 12.1.11.3. Company Financials
- 12.1.11.4. SWOT Analysis
- 12.1.12 Infor Group
- 12.1.12.1. Company Overview
- 12.1.12.2. Products
- 12.1.12.3. Company Financials
- 12.1.12.4. SWOT Analysis
- 12.1.13 Atoss Software AG
- 12.1.13.1. Company Overview
- 12.1.13.2. Products
- 12.1.13.3. Company Financials
- 12.1.13.4. SWOT Analysis
- 12.1.14 Oracle Corporation
- 12.1.14.1. Company Overview
- 12.1.14.2. Products
- 12.1.14.3. Company Financials
- 12.1.14.4. SWOT Analysis
- 12.1.15 ADP LLC
- 12.1.15.1. Company Overview
- 12.1.15.2. Products
- 12.1.15.3. Company Financials
- 12.1.15.4. SWOT Analysis
- 12.1.16 Tamigo UK Ltd
- 12.1.16.1. Company Overview
- 12.1.16.2. Products
- 12.1.16.3. Company Financials
- 12.1.16.4. SWOT Analysis
- 12.1.17 SISQUAL
- 12.1.17.1. Company Overview
- 12.1.17.2. Products
- 12.1.17.3. Company Financials
- 12.1.17.4. SWOT Analysis
- 12.1.18 WorkForce Software LLC
- 12.1.18.1. Company Overview
- 12.1.18.2. Products
- 12.1.18.3. Company Financials
- 12.1.18.4. SWOT Analysis
- 12.1.19 SAP SE
- 12.1.19.1. Company Overview
- 12.1.19.2. Products
- 12.1.19.3. Company Financials
- 12.1.19.4. SWOT Analysis
- 12.1.20 Mitrefinch Ltd
- 12.1.20.1. Company Overview
- 12.1.20.2. Products
- 12.1.20.3. Company Financials
- 12.1.20.4. SWOT Analysis
- 12.1.21 Kirona Solutions Limited
- 12.1.21.1. Company Overview
- 12.1.21.2. Products
- 12.1.21.3. Company Financials
- 12.1.21.4. SWOT Analysis
- 12.1.1 Workday Inc
- 12.2. Market Entropy
- 12.2.1 Company's Key Areas Served
- 12.2.2 Recent Developments
- 12.3. Company Market Share Analysis 2025
- 12.3.1 Top 5 Companies Market Share Analysis
- 12.3.2 Top 3 Companies Market Share Analysis
- 12.4. List of Potential Customers
- 13. Research Methodology
List of Figures
- Figure 1: Global MEA Talent Management Software Industry Revenue Breakdown (Million, %) by Region 2025 & 2033
- Figure 2: Global MEA Talent Management Software Industry Volume Breakdown (K Unit, %) by Region 2025 & 2033
- Figure 3: North America MEA Talent Management Software Industry Revenue (Million), by Type 2025 & 2033
- Figure 4: North America MEA Talent Management Software Industry Volume (K Unit), by Type 2025 & 2033
- Figure 5: North America MEA Talent Management Software Industry Revenue Share (%), by Type 2025 & 2033
- Figure 6: North America MEA Talent Management Software Industry Volume Share (%), by Type 2025 & 2033
- Figure 7: North America MEA Talent Management Software Industry Revenue (Million), by Deployment Mode 2025 & 2033
- Figure 8: North America MEA Talent Management Software Industry Volume (K Unit), by Deployment Mode 2025 & 2033
- Figure 9: North America MEA Talent Management Software Industry Revenue Share (%), by Deployment Mode 2025 & 2033
- Figure 10: North America MEA Talent Management Software Industry Volume Share (%), by Deployment Mode 2025 & 2033
- Figure 11: North America MEA Talent Management Software Industry Revenue (Million), by End-user Vertical 2025 & 2033
- Figure 12: North America MEA Talent Management Software Industry Volume (K Unit), by End-user Vertical 2025 & 2033
- Figure 13: North America MEA Talent Management Software Industry Revenue Share (%), by End-user Vertical 2025 & 2033
- Figure 14: North America MEA Talent Management Software Industry Volume Share (%), by End-user Vertical 2025 & 2033
- Figure 15: North America MEA Talent Management Software Industry Revenue (Million), by Country 2025 & 2033
- Figure 16: North America MEA Talent Management Software Industry Volume (K Unit), by Country 2025 & 2033
- Figure 17: North America MEA Talent Management Software Industry Revenue Share (%), by Country 2025 & 2033
- Figure 18: North America MEA Talent Management Software Industry Volume Share (%), by Country 2025 & 2033
- Figure 19: South America MEA Talent Management Software Industry Revenue (Million), by Type 2025 & 2033
- Figure 20: South America MEA Talent Management Software Industry Volume (K Unit), by Type 2025 & 2033
- Figure 21: South America MEA Talent Management Software Industry Revenue Share (%), by Type 2025 & 2033
- Figure 22: South America MEA Talent Management Software Industry Volume Share (%), by Type 2025 & 2033
- Figure 23: South America MEA Talent Management Software Industry Revenue (Million), by Deployment Mode 2025 & 2033
- Figure 24: South America MEA Talent Management Software Industry Volume (K Unit), by Deployment Mode 2025 & 2033
- Figure 25: South America MEA Talent Management Software Industry Revenue Share (%), by Deployment Mode 2025 & 2033
- Figure 26: South America MEA Talent Management Software Industry Volume Share (%), by Deployment Mode 2025 & 2033
- Figure 27: South America MEA Talent Management Software Industry Revenue (Million), by End-user Vertical 2025 & 2033
- Figure 28: South America MEA Talent Management Software Industry Volume (K Unit), by End-user Vertical 2025 & 2033
- Figure 29: South America MEA Talent Management Software Industry Revenue Share (%), by End-user Vertical 2025 & 2033
- Figure 30: South America MEA Talent Management Software Industry Volume Share (%), by End-user Vertical 2025 & 2033
- Figure 31: South America MEA Talent Management Software Industry Revenue (Million), by Country 2025 & 2033
- Figure 32: South America MEA Talent Management Software Industry Volume (K Unit), by Country 2025 & 2033
- Figure 33: South America MEA Talent Management Software Industry Revenue Share (%), by Country 2025 & 2033
- Figure 34: South America MEA Talent Management Software Industry Volume Share (%), by Country 2025 & 2033
- Figure 35: Europe MEA Talent Management Software Industry Revenue (Million), by Type 2025 & 2033
- Figure 36: Europe MEA Talent Management Software Industry Volume (K Unit), by Type 2025 & 2033
- Figure 37: Europe MEA Talent Management Software Industry Revenue Share (%), by Type 2025 & 2033
- Figure 38: Europe MEA Talent Management Software Industry Volume Share (%), by Type 2025 & 2033
- Figure 39: Europe MEA Talent Management Software Industry Revenue (Million), by Deployment Mode 2025 & 2033
- Figure 40: Europe MEA Talent Management Software Industry Volume (K Unit), by Deployment Mode 2025 & 2033
- Figure 41: Europe MEA Talent Management Software Industry Revenue Share (%), by Deployment Mode 2025 & 2033
- Figure 42: Europe MEA Talent Management Software Industry Volume Share (%), by Deployment Mode 2025 & 2033
- Figure 43: Europe MEA Talent Management Software Industry Revenue (Million), by End-user Vertical 2025 & 2033
- Figure 44: Europe MEA Talent Management Software Industry Volume (K Unit), by End-user Vertical 2025 & 2033
- Figure 45: Europe MEA Talent Management Software Industry Revenue Share (%), by End-user Vertical 2025 & 2033
- Figure 46: Europe MEA Talent Management Software Industry Volume Share (%), by End-user Vertical 2025 & 2033
- Figure 47: Europe MEA Talent Management Software Industry Revenue (Million), by Country 2025 & 2033
- Figure 48: Europe MEA Talent Management Software Industry Volume (K Unit), by Country 2025 & 2033
- Figure 49: Europe MEA Talent Management Software Industry Revenue Share (%), by Country 2025 & 2033
- Figure 50: Europe MEA Talent Management Software Industry Volume Share (%), by Country 2025 & 2033
- Figure 51: Middle East & Africa MEA Talent Management Software Industry Revenue (Million), by Type 2025 & 2033
- Figure 52: Middle East & Africa MEA Talent Management Software Industry Volume (K Unit), by Type 2025 & 2033
- Figure 53: Middle East & Africa MEA Talent Management Software Industry Revenue Share (%), by Type 2025 & 2033
- Figure 54: Middle East & Africa MEA Talent Management Software Industry Volume Share (%), by Type 2025 & 2033
- Figure 55: Middle East & Africa MEA Talent Management Software Industry Revenue (Million), by Deployment Mode 2025 & 2033
- Figure 56: Middle East & Africa MEA Talent Management Software Industry Volume (K Unit), by Deployment Mode 2025 & 2033
- Figure 57: Middle East & Africa MEA Talent Management Software Industry Revenue Share (%), by Deployment Mode 2025 & 2033
- Figure 58: Middle East & Africa MEA Talent Management Software Industry Volume Share (%), by Deployment Mode 2025 & 2033
- Figure 59: Middle East & Africa MEA Talent Management Software Industry Revenue (Million), by End-user Vertical 2025 & 2033
- Figure 60: Middle East & Africa MEA Talent Management Software Industry Volume (K Unit), by End-user Vertical 2025 & 2033
- Figure 61: Middle East & Africa MEA Talent Management Software Industry Revenue Share (%), by End-user Vertical 2025 & 2033
- Figure 62: Middle East & Africa MEA Talent Management Software Industry Volume Share (%), by End-user Vertical 2025 & 2033
- Figure 63: Middle East & Africa MEA Talent Management Software Industry Revenue (Million), by Country 2025 & 2033
- Figure 64: Middle East & Africa MEA Talent Management Software Industry Volume (K Unit), by Country 2025 & 2033
- Figure 65: Middle East & Africa MEA Talent Management Software Industry Revenue Share (%), by Country 2025 & 2033
- Figure 66: Middle East & Africa MEA Talent Management Software Industry Volume Share (%), by Country 2025 & 2033
- Figure 67: Asia Pacific MEA Talent Management Software Industry Revenue (Million), by Type 2025 & 2033
- Figure 68: Asia Pacific MEA Talent Management Software Industry Volume (K Unit), by Type 2025 & 2033
- Figure 69: Asia Pacific MEA Talent Management Software Industry Revenue Share (%), by Type 2025 & 2033
- Figure 70: Asia Pacific MEA Talent Management Software Industry Volume Share (%), by Type 2025 & 2033
- Figure 71: Asia Pacific MEA Talent Management Software Industry Revenue (Million), by Deployment Mode 2025 & 2033
- Figure 72: Asia Pacific MEA Talent Management Software Industry Volume (K Unit), by Deployment Mode 2025 & 2033
- Figure 73: Asia Pacific MEA Talent Management Software Industry Revenue Share (%), by Deployment Mode 2025 & 2033
- Figure 74: Asia Pacific MEA Talent Management Software Industry Volume Share (%), by Deployment Mode 2025 & 2033
- Figure 75: Asia Pacific MEA Talent Management Software Industry Revenue (Million), by End-user Vertical 2025 & 2033
- Figure 76: Asia Pacific MEA Talent Management Software Industry Volume (K Unit), by End-user Vertical 2025 & 2033
- Figure 77: Asia Pacific MEA Talent Management Software Industry Revenue Share (%), by End-user Vertical 2025 & 2033
- Figure 78: Asia Pacific MEA Talent Management Software Industry Volume Share (%), by End-user Vertical 2025 & 2033
- Figure 79: Asia Pacific MEA Talent Management Software Industry Revenue (Million), by Country 2025 & 2033
- Figure 80: Asia Pacific MEA Talent Management Software Industry Volume (K Unit), by Country 2025 & 2033
- Figure 81: Asia Pacific MEA Talent Management Software Industry Revenue Share (%), by Country 2025 & 2033
- Figure 82: Asia Pacific MEA Talent Management Software Industry Volume Share (%), by Country 2025 & 2033
List of Tables
- Table 1: Global MEA Talent Management Software Industry Revenue Million Forecast, by Type 2020 & 2033
- Table 2: Global MEA Talent Management Software Industry Volume K Unit Forecast, by Type 2020 & 2033
- Table 3: Global MEA Talent Management Software Industry Revenue Million Forecast, by Deployment Mode 2020 & 2033
- Table 4: Global MEA Talent Management Software Industry Volume K Unit Forecast, by Deployment Mode 2020 & 2033
- Table 5: Global MEA Talent Management Software Industry Revenue Million Forecast, by End-user Vertical 2020 & 2033
- Table 6: Global MEA Talent Management Software Industry Volume K Unit Forecast, by End-user Vertical 2020 & 2033
- Table 7: Global MEA Talent Management Software Industry Revenue Million Forecast, by Region 2020 & 2033
- Table 8: Global MEA Talent Management Software Industry Volume K Unit Forecast, by Region 2020 & 2033
- Table 9: Global MEA Talent Management Software Industry Revenue Million Forecast, by Type 2020 & 2033
- Table 10: Global MEA Talent Management Software Industry Volume K Unit Forecast, by Type 2020 & 2033
- Table 11: Global MEA Talent Management Software Industry Revenue Million Forecast, by Deployment Mode 2020 & 2033
- Table 12: Global MEA Talent Management Software Industry Volume K Unit Forecast, by Deployment Mode 2020 & 2033
- Table 13: Global MEA Talent Management Software Industry Revenue Million Forecast, by End-user Vertical 2020 & 2033
- Table 14: Global MEA Talent Management Software Industry Volume K Unit Forecast, by End-user Vertical 2020 & 2033
- Table 15: Global MEA Talent Management Software Industry Revenue Million Forecast, by Country 2020 & 2033
- Table 16: Global MEA Talent Management Software Industry Volume K Unit Forecast, by Country 2020 & 2033
- Table 17: United States MEA Talent Management Software Industry Revenue (Million) Forecast, by Application 2020 & 2033
- Table 18: United States MEA Talent Management Software Industry Volume (K Unit) Forecast, by Application 2020 & 2033
- Table 19: Canada MEA Talent Management Software Industry Revenue (Million) Forecast, by Application 2020 & 2033
- Table 20: Canada MEA Talent Management Software Industry Volume (K Unit) Forecast, by Application 2020 & 2033
- Table 21: Mexico MEA Talent Management Software Industry Revenue (Million) Forecast, by Application 2020 & 2033
- Table 22: Mexico MEA Talent Management Software Industry Volume (K Unit) Forecast, by Application 2020 & 2033
- Table 23: Global MEA Talent Management Software Industry Revenue Million Forecast, by Type 2020 & 2033
- Table 24: Global MEA Talent Management Software Industry Volume K Unit Forecast, by Type 2020 & 2033
- Table 25: Global MEA Talent Management Software Industry Revenue Million Forecast, by Deployment Mode 2020 & 2033
- Table 26: Global MEA Talent Management Software Industry Volume K Unit Forecast, by Deployment Mode 2020 & 2033
- Table 27: Global MEA Talent Management Software Industry Revenue Million Forecast, by End-user Vertical 2020 & 2033
- Table 28: Global MEA Talent Management Software Industry Volume K Unit Forecast, by End-user Vertical 2020 & 2033
- Table 29: Global MEA Talent Management Software Industry Revenue Million Forecast, by Country 2020 & 2033
- Table 30: Global MEA Talent Management Software Industry Volume K Unit Forecast, by Country 2020 & 2033
- Table 31: Brazil MEA Talent Management Software Industry Revenue (Million) Forecast, by Application 2020 & 2033
- Table 32: Brazil MEA Talent Management Software Industry Volume (K Unit) Forecast, by Application 2020 & 2033
- Table 33: Argentina MEA Talent Management Software Industry Revenue (Million) Forecast, by Application 2020 & 2033
- Table 34: Argentina MEA Talent Management Software Industry Volume (K Unit) Forecast, by Application 2020 & 2033
- Table 35: Rest of South America MEA Talent Management Software Industry Revenue (Million) Forecast, by Application 2020 & 2033
- Table 36: Rest of South America MEA Talent Management Software Industry Volume (K Unit) Forecast, by Application 2020 & 2033
- Table 37: Global MEA Talent Management Software Industry Revenue Million Forecast, by Type 2020 & 2033
- Table 38: Global MEA Talent Management Software Industry Volume K Unit Forecast, by Type 2020 & 2033
- Table 39: Global MEA Talent Management Software Industry Revenue Million Forecast, by Deployment Mode 2020 & 2033
- Table 40: Global MEA Talent Management Software Industry Volume K Unit Forecast, by Deployment Mode 2020 & 2033
- Table 41: Global MEA Talent Management Software Industry Revenue Million Forecast, by End-user Vertical 2020 & 2033
- Table 42: Global MEA Talent Management Software Industry Volume K Unit Forecast, by End-user Vertical 2020 & 2033
- Table 43: Global MEA Talent Management Software Industry Revenue Million Forecast, by Country 2020 & 2033
- Table 44: Global MEA Talent Management Software Industry Volume K Unit Forecast, by Country 2020 & 2033
- Table 45: United Kingdom MEA Talent Management Software Industry Revenue (Million) Forecast, by Application 2020 & 2033
- Table 46: United Kingdom MEA Talent Management Software Industry Volume (K Unit) Forecast, by Application 2020 & 2033
- Table 47: Germany MEA Talent Management Software Industry Revenue (Million) Forecast, by Application 2020 & 2033
- Table 48: Germany MEA Talent Management Software Industry Volume (K Unit) Forecast, by Application 2020 & 2033
- Table 49: France MEA Talent Management Software Industry Revenue (Million) Forecast, by Application 2020 & 2033
- Table 50: France MEA Talent Management Software Industry Volume (K Unit) Forecast, by Application 2020 & 2033
- Table 51: Italy MEA Talent Management Software Industry Revenue (Million) Forecast, by Application 2020 & 2033
- Table 52: Italy MEA Talent Management Software Industry Volume (K Unit) Forecast, by Application 2020 & 2033
- Table 53: Spain MEA Talent Management Software Industry Revenue (Million) Forecast, by Application 2020 & 2033
- Table 54: Spain MEA Talent Management Software Industry Volume (K Unit) Forecast, by Application 2020 & 2033
- Table 55: Russia MEA Talent Management Software Industry Revenue (Million) Forecast, by Application 2020 & 2033
- Table 56: Russia MEA Talent Management Software Industry Volume (K Unit) Forecast, by Application 2020 & 2033
- Table 57: Benelux MEA Talent Management Software Industry Revenue (Million) Forecast, by Application 2020 & 2033
- Table 58: Benelux MEA Talent Management Software Industry Volume (K Unit) Forecast, by Application 2020 & 2033
- Table 59: Nordics MEA Talent Management Software Industry Revenue (Million) Forecast, by Application 2020 & 2033
- Table 60: Nordics MEA Talent Management Software Industry Volume (K Unit) Forecast, by Application 2020 & 2033
- Table 61: Rest of Europe MEA Talent Management Software Industry Revenue (Million) Forecast, by Application 2020 & 2033
- Table 62: Rest of Europe MEA Talent Management Software Industry Volume (K Unit) Forecast, by Application 2020 & 2033
- Table 63: Global MEA Talent Management Software Industry Revenue Million Forecast, by Type 2020 & 2033
- Table 64: Global MEA Talent Management Software Industry Volume K Unit Forecast, by Type 2020 & 2033
- Table 65: Global MEA Talent Management Software Industry Revenue Million Forecast, by Deployment Mode 2020 & 2033
- Table 66: Global MEA Talent Management Software Industry Volume K Unit Forecast, by Deployment Mode 2020 & 2033
- Table 67: Global MEA Talent Management Software Industry Revenue Million Forecast, by End-user Vertical 2020 & 2033
- Table 68: Global MEA Talent Management Software Industry Volume K Unit Forecast, by End-user Vertical 2020 & 2033
- Table 69: Global MEA Talent Management Software Industry Revenue Million Forecast, by Country 2020 & 2033
- Table 70: Global MEA Talent Management Software Industry Volume K Unit Forecast, by Country 2020 & 2033
- Table 71: Turkey MEA Talent Management Software Industry Revenue (Million) Forecast, by Application 2020 & 2033
- Table 72: Turkey MEA Talent Management Software Industry Volume (K Unit) Forecast, by Application 2020 & 2033
- Table 73: Israel MEA Talent Management Software Industry Revenue (Million) Forecast, by Application 2020 & 2033
- Table 74: Israel MEA Talent Management Software Industry Volume (K Unit) Forecast, by Application 2020 & 2033
- Table 75: GCC MEA Talent Management Software Industry Revenue (Million) Forecast, by Application 2020 & 2033
- Table 76: GCC MEA Talent Management Software Industry Volume (K Unit) Forecast, by Application 2020 & 2033
- Table 77: North Africa MEA Talent Management Software Industry Revenue (Million) Forecast, by Application 2020 & 2033
- Table 78: North Africa MEA Talent Management Software Industry Volume (K Unit) Forecast, by Application 2020 & 2033
- Table 79: South Africa MEA Talent Management Software Industry Revenue (Million) Forecast, by Application 2020 & 2033
- Table 80: South Africa MEA Talent Management Software Industry Volume (K Unit) Forecast, by Application 2020 & 2033
- Table 81: Rest of Middle East & Africa MEA Talent Management Software Industry Revenue (Million) Forecast, by Application 2020 & 2033
- Table 82: Rest of Middle East & Africa MEA Talent Management Software Industry Volume (K Unit) Forecast, by Application 2020 & 2033
- Table 83: Global MEA Talent Management Software Industry Revenue Million Forecast, by Type 2020 & 2033
- Table 84: Global MEA Talent Management Software Industry Volume K Unit Forecast, by Type 2020 & 2033
- Table 85: Global MEA Talent Management Software Industry Revenue Million Forecast, by Deployment Mode 2020 & 2033
- Table 86: Global MEA Talent Management Software Industry Volume K Unit Forecast, by Deployment Mode 2020 & 2033
- Table 87: Global MEA Talent Management Software Industry Revenue Million Forecast, by End-user Vertical 2020 & 2033
- Table 88: Global MEA Talent Management Software Industry Volume K Unit Forecast, by End-user Vertical 2020 & 2033
- Table 89: Global MEA Talent Management Software Industry Revenue Million Forecast, by Country 2020 & 2033
- Table 90: Global MEA Talent Management Software Industry Volume K Unit Forecast, by Country 2020 & 2033
- Table 91: China MEA Talent Management Software Industry Revenue (Million) Forecast, by Application 2020 & 2033
- Table 92: China MEA Talent Management Software Industry Volume (K Unit) Forecast, by Application 2020 & 2033
- Table 93: India MEA Talent Management Software Industry Revenue (Million) Forecast, by Application 2020 & 2033
- Table 94: India MEA Talent Management Software Industry Volume (K Unit) Forecast, by Application 2020 & 2033
- Table 95: Japan MEA Talent Management Software Industry Revenue (Million) Forecast, by Application 2020 & 2033
- Table 96: Japan MEA Talent Management Software Industry Volume (K Unit) Forecast, by Application 2020 & 2033
- Table 97: South Korea MEA Talent Management Software Industry Revenue (Million) Forecast, by Application 2020 & 2033
- Table 98: South Korea MEA Talent Management Software Industry Volume (K Unit) Forecast, by Application 2020 & 2033
- Table 99: ASEAN MEA Talent Management Software Industry Revenue (Million) Forecast, by Application 2020 & 2033
- Table 100: ASEAN MEA Talent Management Software Industry Volume (K Unit) Forecast, by Application 2020 & 2033
- Table 101: Oceania MEA Talent Management Software Industry Revenue (Million) Forecast, by Application 2020 & 2033
- Table 102: Oceania MEA Talent Management Software Industry Volume (K Unit) Forecast, by Application 2020 & 2033
- Table 103: Rest of Asia Pacific MEA Talent Management Software Industry Revenue (Million) Forecast, by Application 2020 & 2033
- Table 104: Rest of Asia Pacific MEA Talent Management Software Industry Volume (K Unit) Forecast, by Application 2020 & 2033
Frequently Asked Questions
1. What is the projected Compound Annual Growth Rate (CAGR) of the MEA Talent Management Software Industry?
The projected CAGR is approximately 8.38%.
2. Which companies are prominent players in the MEA Talent Management Software Industry?
Key companies in the market include Workday Inc, Reflexis Systems Inc, NICE Systems Ltd, Roubler UK Limited Company, IBM Corporation, Blue Yonder Group Inc, Active Operations Management International LLP, Sage Group PLC, Kronos Incorporated (UKG Inc ), 7shifts, ServiceMax Inc, Infor Group, Atoss Software AG, Oracle Corporation, ADP LLC, Tamigo UK Ltd, SISQUAL, WorkForce Software LLC, SAP SE, Mitrefinch Ltd, Kirona Solutions Limited.
3. What are the main segments of the MEA Talent Management Software Industry?
The market segments include Type, Deployment Mode, End-user Vertical.
4. Can you provide details about the market size?
The market size is estimated to be USD 0.41 Million as of 2022.
5. What are some drivers contributing to market growth?
Increasing Adoption of Internet of Things (IoT) and Cloud-based Solutions Expanding the Market; Growing Adoption of Analytical Solutions and WFM by SMEs Driving Market Growth.
6. What are the notable trends driving market growth?
Workforce Scheduling and Workforce Analytics Type is Expected to Hold Significant Market Share.
7. Are there any restraints impacting market growth?
; Availability of open-source alternatives.
8. Can you provide examples of recent developments in the market?
January 2023: BrightPlan, a United States-based company, launched a new workforce financial wellness gauge, providing data-driven insights for organizations to uncover key workforce strengths and gaps in the Middle East and Africa region. BrightPlan's Total Financial Wellness solution, powered by patented AI technology, transforms raw data into valuable insights and advice for employers and employees.
9. What pricing options are available for accessing the report?
Pricing options include single-user, multi-user, and enterprise licenses priced at USD 4750, USD 4950, and USD 6800 respectively.
10. Is the market size provided in terms of value or volume?
The market size is provided in terms of value, measured in Million and volume, measured in K Unit.
11. Are there any specific market keywords associated with the report?
Yes, the market keyword associated with the report is "MEA Talent Management Software Industry," which aids in identifying and referencing the specific market segment covered.
12. How do I determine which pricing option suits my needs best?
The pricing options vary based on user requirements and access needs. Individual users may opt for single-user licenses, while businesses requiring broader access may choose multi-user or enterprise licenses for cost-effective access to the report.
13. Are there any additional resources or data provided in the MEA Talent Management Software Industry report?
While the report offers comprehensive insights, it's advisable to review the specific contents or supplementary materials provided to ascertain if additional resources or data are available.
14. How can I stay updated on further developments or reports in the MEA Talent Management Software Industry?
To stay informed about further developments, trends, and reports in the MEA Talent Management Software Industry, consider subscribing to industry newsletters, following relevant companies and organizations, or regularly checking reputable industry news sources and publications.
Methodology
Step 1 - Identification of Relevant Samples Size from Population Database


Step 2 - Approaches for Defining Global Market Size (Value, Volume* & Price*)

Note*: In applicable scenarios
Step 3 - Data Sources
Primary Research
- Web Analytics
- Survey Reports
- Research Institute
- Latest Research Reports
- Opinion Leaders
Secondary Research
- Annual Reports
- White Paper
- Latest Press Release
- Industry Association
- Paid Database
- Investor Presentations

Step 4 - Data Triangulation
Involves using different sources of information in order to increase the validity of a study
These sources are likely to be stakeholders in a program - participants, other researchers, program staff, other community members, and so on.
Then we put all data in single framework & apply various statistical tools to find out the dynamic on the market.
During the analysis stage, feedback from the stakeholder groups would be compared to determine areas of agreement as well as areas of divergence