

Key Insights
The medical X-ray equipment and imaging software market is experiencing robust growth, driven by technological advancements, an aging global population necessitating increased diagnostic procedures, and the rising prevalence of chronic diseases. The market's 4.60% CAGR from 2019-2024 indicates a consistent upward trajectory, projected to continue into the forecast period (2025-2033). Key drivers include the development of advanced imaging technologies like AI-powered image analysis and improved 3D/4D imaging capabilities, offering enhanced diagnostic accuracy and reduced radiation exposure. Furthermore, the increasing adoption of minimally invasive procedures and the growing preference for outpatient settings are contributing to market expansion. Segmentation reveals a significant share held by hospitals and diagnostic centers, with 3D and computed tomography (CT) technologies leading in terms of type and technology, respectively. While the market faces restraints like high equipment costs and stringent regulatory approvals, the overall outlook remains positive due to the continuous demand for advanced diagnostic tools and the ongoing expansion of healthcare infrastructure globally.
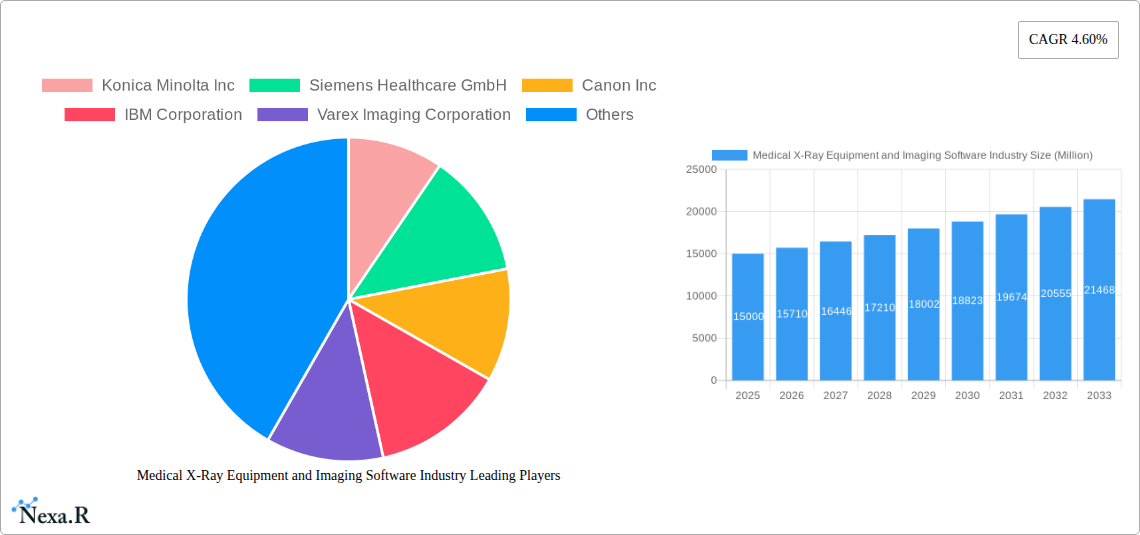
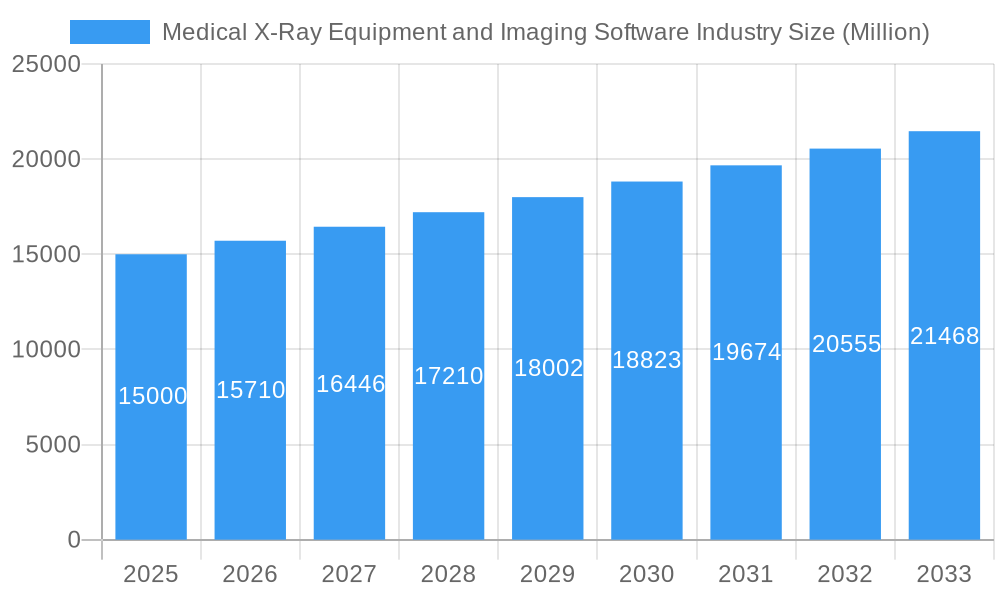
Medical X-Ray Equipment and Imaging Software Industry Market Size (In Billion)
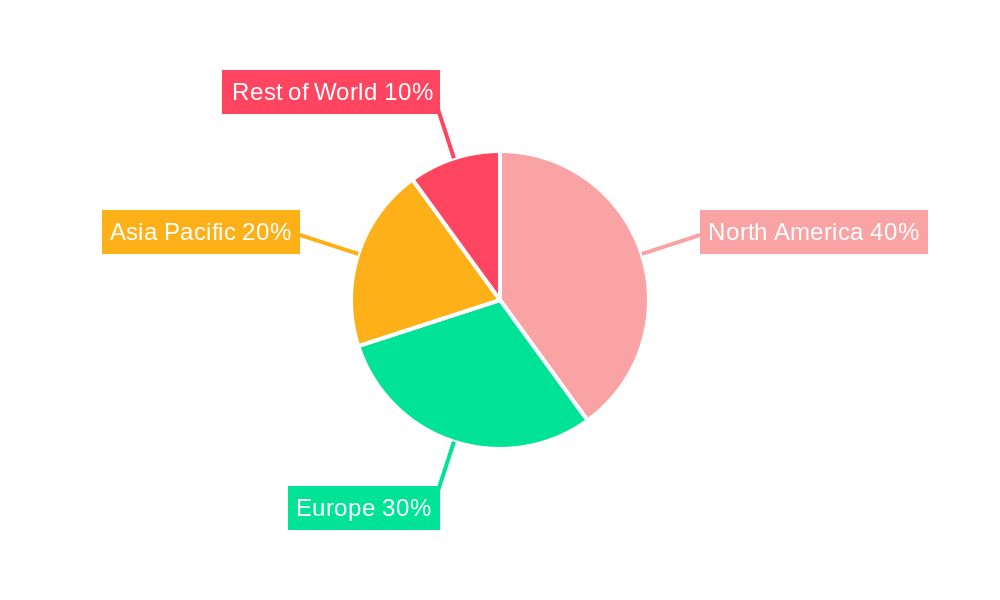
North America and Europe currently dominate the market, owing to established healthcare systems and high healthcare expenditure. However, rapidly developing economies in the Asia-Pacific region are exhibiting significant growth potential, fueled by increasing investments in healthcare infrastructure and rising disposable incomes. The competitive landscape is characterized by the presence of established players like GE Healthcare, Siemens Healthcare, and Canon, alongside emerging companies focusing on innovative solutions. Strategic alliances, mergers, and acquisitions are anticipated to shape the market dynamics in the coming years, as companies strive to expand their product portfolios and global reach. The market is also witnessing a growing demand for cloud-based imaging software and tele-radiology solutions, which streamline workflows and facilitate remote diagnostics. This shift towards digitalization and connectivity is expected to be a key trend influencing market growth throughout the forecast period.
Medical X-Ray Equipment and Imaging Software Industry Company Market Share
Medical X-Ray Equipment and Imaging Software Industry Market Report: 2019-2033
This comprehensive report provides a detailed analysis of the Medical X-Ray Equipment and Imaging Software industry, covering market dynamics, growth trends, regional segmentation, product landscape, key players, and future outlook. The study period spans from 2019 to 2033, with 2025 serving as the base and estimated year. The report utilizes a combination of qualitative and quantitative data to offer valuable insights for industry professionals, investors, and stakeholders. The market is segmented by type (Equipment, Software), technology (Radiography/Mammography, Computed Tomography, Fluoroscopy/Angiography), and end-user (Hospitals, Diagnostic Centers, Research Centers). The total market value in 2025 is estimated at xx Million.
Medical X-Ray Equipment and Imaging Software Industry Market Dynamics & Structure
The medical X-ray equipment and imaging software market is characterized by a moderately consolidated structure with several major players holding significant market share. Market concentration is influenced by technological advancements, regulatory approvals, and strategic mergers and acquisitions (M&A). The industry witnesses continuous innovation in areas like AI-powered image analysis, 3D imaging, and mobile X-ray systems. Stringent regulatory frameworks, particularly concerning safety and efficacy, shape product development and market access. Competitively, the market faces substitution pressures from alternative imaging modalities like ultrasound and MRI, although X-ray remains a cornerstone of medical imaging due to its cost-effectiveness and wide availability. The end-user demographic is broad, spanning hospitals, diagnostic centers, and research institutions, with growth heavily influenced by healthcare infrastructure development and increasing prevalence of chronic diseases. M&A activity has been moderate, with strategic acquisitions driving consolidation and expansion into new technologies or geographical markets. The overall deal volume during 2019-2024 was approximately xx deals, leading to a market share shift among leading players.
- Market Concentration: Moderately Consolidated (Top 5 players hold approximately xx% market share in 2025).
- Technological Innovation Drivers: AI-powered image analysis, 3D/4D imaging, mobile X-ray systems, cloud-based solutions.
- Regulatory Frameworks: Stringent safety and efficacy standards impacting product development and approvals. Variations across regions.
- Competitive Product Substitutes: Ultrasound, MRI, CT scans.
- End-User Demographics: Hospitals (xx%), Diagnostic Centers (xx%), Research Centers (xx%).
- M&A Trends: Moderate activity focused on technology integration and geographical expansion.
Medical X-Ray Equipment and Imaging Software Industry Growth Trends & Insights
The global medical X-ray equipment and imaging software market exhibited robust growth between 2019 and 2024, with a Compound Annual Growth Rate (CAGR) of xx%. This growth is projected to continue during the forecast period (2025-2033), driven by technological advancements, rising prevalence of chronic diseases requiring frequent imaging, and increasing healthcare expenditure globally. The adoption rate of advanced imaging technologies, such as 3D and AI-powered systems, is increasing steadily, improving diagnostic accuracy and efficiency. Consumer behavior is shifting towards minimally invasive procedures and personalized medicine, further fueling demand for advanced imaging solutions. The market is also witnessing significant technological disruptions, with the integration of AI and machine learning enhancing image quality, diagnostics, and workflow automation. Furthermore, the growing adoption of telemedicine and remote diagnostics is creating new opportunities for the market. Market penetration of advanced imaging technologies remains relatively low in emerging economies, signifying significant untapped potential.
- Market Size Evolution: From xx Million in 2019 to xx Million in 2024, reaching an estimated xx Million in 2025.
- CAGR (2019-2024): xx%
- Projected CAGR (2025-2033): xx%
- Market Penetration (Advanced Imaging Technologies): xx% in 2025, projected to reach xx% by 2033.
Dominant Regions, Countries, or Segments in Medical X-Ray Equipment and Imaging Software Industry
North America currently dominates the medical X-ray equipment and imaging software market, followed by Europe and Asia-Pacific. This dominance is attributed to factors such as advanced healthcare infrastructure, high healthcare expenditure, and early adoption of advanced technologies. However, the Asia-Pacific region is projected to witness the highest growth rate during the forecast period, driven by expanding healthcare infrastructure, increasing prevalence of chronic diseases, and rising disposable incomes.
- By Type: Equipment holds the largest market share (xx%), followed by Software (xx%). The 2D segment currently dominates over 3D; however, 3D is showing a faster growth rate.
- By Technology: Radiography/Mammography segment holds the largest market share, driven by its widespread use and relatively lower cost. Computed Tomography (CT) is experiencing significant growth due to its high diagnostic accuracy.
- By End-User: Hospitals constitute the largest end-user segment, followed by diagnostic centers and research centers.
- Key Drivers: Increasing healthcare expenditure, rising prevalence of chronic diseases, technological advancements, supportive government initiatives, robust healthcare infrastructure (particularly in North America and Europe).
- Growth Potential: Highest in Asia-Pacific region, driven by increasing healthcare investment and improving healthcare infrastructure.
Medical X-Ray Equipment and Imaging Software Industry Product Landscape
The medical X-ray equipment and imaging software market offers a wide array of products, ranging from traditional 2D radiography systems to advanced 3D/4D imaging systems and AI-powered image analysis software. Recent innovations include mobile X-ray systems with enhanced portability and image quality, improved image processing algorithms for enhanced diagnostic accuracy, and cloud-based platforms for improved collaboration and data management. Key features driving product differentiation include image quality, ease of use, portability, integration capabilities, and AI-powered functionalities. Technological advancements focus on improving image clarity, reducing radiation dose, and enhancing workflow efficiency.
Key Drivers, Barriers & Challenges in Medical X-Ray Equipment and Imaging Software Industry
Key Drivers: Increasing prevalence of chronic diseases requiring frequent imaging, technological advancements enhancing diagnostic capabilities and efficiency, rising healthcare expenditure, and government initiatives promoting healthcare infrastructure development.
Key Challenges & Restraints: High cost of advanced imaging systems limiting accessibility in resource-constrained settings, stringent regulatory requirements increasing time and cost of product approvals, intense competition among established players and emerging market entrants, supply chain disruptions affecting manufacturing and distribution, cybersecurity concerns related to data storage and management. The overall impact of these challenges is an estimated xx% reduction in projected market growth in the next 5 years.
Emerging Opportunities in Medical X-Ray Equipment and Imaging Software Industry
Emerging opportunities exist in developing economies with expanding healthcare infrastructure, the integration of AI and machine learning for improved diagnostics and workflow automation, the development of mobile and portable X-ray systems for remote healthcare settings, and the growth of telemedicine and remote diagnostics requiring improved imaging and software solutions. Further, increasing demand for personalized medicine and minimally invasive procedures are creating niche opportunities for specific imaging solutions.
Growth Accelerators in the Medical X-Ray Equipment and Imaging Software Industry Industry
The long-term growth of the medical X-ray equipment and imaging software industry is expected to be driven by continued technological innovation in areas such as AI and machine learning, strategic partnerships between equipment manufacturers and software developers, expansion into emerging markets with growing healthcare infrastructure, and the increasing adoption of cloud-based platforms for data management and collaboration. Government support for healthcare infrastructure development and initiatives promoting early detection of diseases also play a significant role.
Key Players Shaping the Medical X-Ray Equipment and Imaging Software Market
Notable Milestones in Medical X-Ray Equipment and Imaging Software Industry Sector
- July 2023: Shimadzu Corporation launched the MobileDaRt Evolution MX8 version k type mobile X-ray system with Dynamic Digital Radiography (DDR) functionality.
- May 2023: Carestream Health introduced the DRX-Rise Mobile X-ray System, expanding its mobile X-ray portfolio with improved imaging performance, ease of use, and productivity.
In-Depth Medical X-Ray Equipment and Imaging Software Industry Market Outlook
The future of the medical X-ray equipment and imaging software market is promising, driven by the continued adoption of advanced technologies, expansion into emerging markets, and growing demand for improved diagnostic accuracy and efficiency. Strategic partnerships, technological innovations, and proactive regulatory measures will be crucial for sustained growth. The market is poised for significant expansion, offering substantial opportunities for both established players and new entrants. The continued integration of AI and improved data analytics will be key drivers of future innovation and market growth.
Medical X-Ray Equipment and Imaging Software Industry Segmentation
-
1. Type
- 1.1. Equipment
- 1.2. Software
-
2. Technology
- 2.1. Radiography/Mammography
- 2.2. Computed Tomography
- 2.3. Fluoroscopy/Angiography
-
3. Image Type
- 3.1. 2-Dimensional
- 3.2. 3-Dimensional
-
4. End-user
- 4.1. Hospitals
- 4.2. Diagnostic Centers
- 4.3. Research Centers
Medical X-Ray Equipment and Imaging Software Industry Segmentation By Geography
- 1. North America
- 2. Europe
- 3. Asia
- 4. Australia and New Zealand
- 5. Middle East and Africa
- 6. Latin America
Medical X-Ray Equipment and Imaging Software Industry Regional Market Share
Geographic Coverage of Medical X-Ray Equipment and Imaging Software Industry
Medical X-Ray Equipment and Imaging Software Industry REPORT HIGHLIGHTS
| Aspects | Details |
|---|---|
| Study Period | 2020-2034 |
| Base Year | 2025 |
| Estimated Year | 2026 |
| Forecast Period | 2026-2034 |
| Historical Period | 2020-2025 |
| Growth Rate | CAGR of 4.60% from 2020-2034 |
| Segmentation |
|
Table of Contents
- 1. Introduction
- 1.1. Research Scope
- 1.2. Market Segmentation
- 1.3. Research Objective
- 1.4. Definitions and Assumptions
- 2. Executive Summary
- 2.1. Market Snapshot
- 3. Market Dynamics
- 3.1. Market Drivers
- 3.2. Market Restrains
- 3.3. Market Trends
- 3.4. Market Opportunities
- 4. Market Factor Analysis
- 4.1. Porters Five Forces
- 4.1.1. Bargaining Power of Suppliers
- 4.1.2. Bargaining Power of Buyers
- 4.1.3. Threat of New Entrants
- 4.1.4. Threat of Substitutes
- 4.1.5. Competitive Rivalry
- 4.2. PESTEL analysis
- 4.3. BCG Analysis
- 4.3.1. Stars (High Growth, High Market Share)
- 4.3.2. Cash Cows (Low Growth, High Market Share)
- 4.3.3. Question Mark (High Growth, Low Market Share)
- 4.3.4. Dogs (Low Growth, Low Market Share)
- 4.4. Ansoff Matrix Analysis
- 4.5. Supply Chain Analysis
- 4.6. Regulatory Landscape
- 4.7. Current Market Potential and Opportunity Assessment (TAM–SAM–SOM Framework)
- 4.8. NRP Analyst Note
- 4.1. Porters Five Forces
- 5. Market Analysis, Insights and Forecast 2021-2033
- 5.1. Market Analysis, Insights and Forecast - by Type
- 5.1.1. Equipment
- 5.1.2. Software
- 5.2. Market Analysis, Insights and Forecast - by Technology
- 5.2.1. Radiography/Mammography
- 5.2.2. Computed Tomography
- 5.2.3. Fluoroscopy/Angiography
- 5.3. Market Analysis, Insights and Forecast - by Image Type
- 5.3.1. 2-Dimensional
- 5.3.2. 3-Dimensional
- 5.4. Market Analysis, Insights and Forecast - by End-user
- 5.4.1. Hospitals
- 5.4.2. Diagnostic Centers
- 5.4.3. Research Centers
- 5.5. Market Analysis, Insights and Forecast - by Region
- 5.5.1. North America
- 5.5.2. Europe
- 5.5.3. Asia
- 5.5.4. Australia and New Zealand
- 5.5.5. Middle East and Africa
- 5.5.6. Latin America
- 5.1. Market Analysis, Insights and Forecast - by Type
- 6. Global Medical X-Ray Equipment and Imaging Software Industry Analysis, Insights and Forecast, 2021-2033
- 6.1. Market Analysis, Insights and Forecast - by Type
- 6.1.1. Equipment
- 6.1.2. Software
- 6.2. Market Analysis, Insights and Forecast - by Technology
- 6.2.1. Radiography/Mammography
- 6.2.2. Computed Tomography
- 6.2.3. Fluoroscopy/Angiography
- 6.3. Market Analysis, Insights and Forecast - by Image Type
- 6.3.1. 2-Dimensional
- 6.3.2. 3-Dimensional
- 6.4. Market Analysis, Insights and Forecast - by End-user
- 6.4.1. Hospitals
- 6.4.2. Diagnostic Centers
- 6.4.3. Research Centers
- 6.1. Market Analysis, Insights and Forecast - by Type
- 7. North America Medical X-Ray Equipment and Imaging Software Industry Analysis, Insights and Forecast, 2020-2032
- 7.1. Market Analysis, Insights and Forecast - by Type
- 7.1.1. Equipment
- 7.1.2. Software
- 7.2. Market Analysis, Insights and Forecast - by Technology
- 7.2.1. Radiography/Mammography
- 7.2.2. Computed Tomography
- 7.2.3. Fluoroscopy/Angiography
- 7.3. Market Analysis, Insights and Forecast - by Image Type
- 7.3.1. 2-Dimensional
- 7.3.2. 3-Dimensional
- 7.4. Market Analysis, Insights and Forecast - by End-user
- 7.4.1. Hospitals
- 7.4.2. Diagnostic Centers
- 7.4.3. Research Centers
- 7.1. Market Analysis, Insights and Forecast - by Type
- 8. Europe Medical X-Ray Equipment and Imaging Software Industry Analysis, Insights and Forecast, 2020-2032
- 8.1. Market Analysis, Insights and Forecast - by Type
- 8.1.1. Equipment
- 8.1.2. Software
- 8.2. Market Analysis, Insights and Forecast - by Technology
- 8.2.1. Radiography/Mammography
- 8.2.2. Computed Tomography
- 8.2.3. Fluoroscopy/Angiography
- 8.3. Market Analysis, Insights and Forecast - by Image Type
- 8.3.1. 2-Dimensional
- 8.3.2. 3-Dimensional
- 8.4. Market Analysis, Insights and Forecast - by End-user
- 8.4.1. Hospitals
- 8.4.2. Diagnostic Centers
- 8.4.3. Research Centers
- 8.1. Market Analysis, Insights and Forecast - by Type
- 9. Asia Medical X-Ray Equipment and Imaging Software Industry Analysis, Insights and Forecast, 2020-2032
- 9.1. Market Analysis, Insights and Forecast - by Type
- 9.1.1. Equipment
- 9.1.2. Software
- 9.2. Market Analysis, Insights and Forecast - by Technology
- 9.2.1. Radiography/Mammography
- 9.2.2. Computed Tomography
- 9.2.3. Fluoroscopy/Angiography
- 9.3. Market Analysis, Insights and Forecast - by Image Type
- 9.3.1. 2-Dimensional
- 9.3.2. 3-Dimensional
- 9.4. Market Analysis, Insights and Forecast - by End-user
- 9.4.1. Hospitals
- 9.4.2. Diagnostic Centers
- 9.4.3. Research Centers
- 9.1. Market Analysis, Insights and Forecast - by Type
- 10. Australia and New Zealand Medical X-Ray Equipment and Imaging Software Industry Analysis, Insights and Forecast, 2020-2032
- 10.1. Market Analysis, Insights and Forecast - by Type
- 10.1.1. Equipment
- 10.1.2. Software
- 10.2. Market Analysis, Insights and Forecast - by Technology
- 10.2.1. Radiography/Mammography
- 10.2.2. Computed Tomography
- 10.2.3. Fluoroscopy/Angiography
- 10.3. Market Analysis, Insights and Forecast - by Image Type
- 10.3.1. 2-Dimensional
- 10.3.2. 3-Dimensional
- 10.4. Market Analysis, Insights and Forecast - by End-user
- 10.4.1. Hospitals
- 10.4.2. Diagnostic Centers
- 10.4.3. Research Centers
- 10.1. Market Analysis, Insights and Forecast - by Type
- 11. Middle East and Africa Medical X-Ray Equipment and Imaging Software Industry Analysis, Insights and Forecast, 2020-2032
- 11.1. Market Analysis, Insights and Forecast - by Type
- 11.1.1. Equipment
- 11.1.2. Software
- 11.2. Market Analysis, Insights and Forecast - by Technology
- 11.2.1. Radiography/Mammography
- 11.2.2. Computed Tomography
- 11.2.3. Fluoroscopy/Angiography
- 11.3. Market Analysis, Insights and Forecast - by Image Type
- 11.3.1. 2-Dimensional
- 11.3.2. 3-Dimensional
- 11.4. Market Analysis, Insights and Forecast - by End-user
- 11.4.1. Hospitals
- 11.4.2. Diagnostic Centers
- 11.4.3. Research Centers
- 11.1. Market Analysis, Insights and Forecast - by Type
- 12. Latin America Medical X-Ray Equipment and Imaging Software Industry Analysis, Insights and Forecast, 2020-2032
- 12.1. Market Analysis, Insights and Forecast - by Type
- 12.1.1. Equipment
- 12.1.2. Software
- 12.2. Market Analysis, Insights and Forecast - by Technology
- 12.2.1. Radiography/Mammography
- 12.2.2. Computed Tomography
- 12.2.3. Fluoroscopy/Angiography
- 12.3. Market Analysis, Insights and Forecast - by Image Type
- 12.3.1. 2-Dimensional
- 12.3.2. 3-Dimensional
- 12.4. Market Analysis, Insights and Forecast - by End-user
- 12.4.1. Hospitals
- 12.4.2. Diagnostic Centers
- 12.4.3. Research Centers
- 12.1. Market Analysis, Insights and Forecast - by Type
- 13. Competitive Analysis
- 13.1. Company Profiles
- 13.1.1 Konica Minolta Inc
- 13.1.1.1. Company Overview
- 13.1.1.2. Products
- 13.1.1.3. Company Financials
- 13.1.1.4. SWOT Analysis
- 13.1.2 Siemens Healthcare GmbH
- 13.1.2.1. Company Overview
- 13.1.2.2. Products
- 13.1.2.3. Company Financials
- 13.1.2.4. SWOT Analysis
- 13.1.3 Canon Inc
- 13.1.3.1. Company Overview
- 13.1.3.2. Products
- 13.1.3.3. Company Financials
- 13.1.3.4. SWOT Analysis
- 13.1.4 IBM Corporation
- 13.1.4.1. Company Overview
- 13.1.4.2. Products
- 13.1.4.3. Company Financials
- 13.1.4.4. SWOT Analysis
- 13.1.5 Varex Imaging Corporation
- 13.1.5.1. Company Overview
- 13.1.5.2. Products
- 13.1.5.3. Company Financials
- 13.1.5.4. SWOT Analysis
- 13.1.6 Hitachi Ltd
- 13.1.6.1. Company Overview
- 13.1.6.2. Products
- 13.1.6.3. Company Financials
- 13.1.6.4. SWOT Analysis
- 13.1.7 Shimazdu Corporation
- 13.1.7.1. Company Overview
- 13.1.7.2. Products
- 13.1.7.3. Company Financials
- 13.1.7.4. SWOT Analysis
- 13.1.8 Hologic Inc
- 13.1.8.1. Company Overview
- 13.1.8.2. Products
- 13.1.8.3. Company Financials
- 13.1.8.4. SWOT Analysis
- 13.1.9 Koninklijke Philips NV
- 13.1.9.1. Company Overview
- 13.1.9.2. Products
- 13.1.9.3. Company Financials
- 13.1.9.4. SWOT Analysis
- 13.1.10 GE Healthcare Inc
- 13.1.10.1. Company Overview
- 13.1.10.2. Products
- 13.1.10.3. Company Financials
- 13.1.10.4. SWOT Analysis
- 13.1.11 Carestream Health Inc
- 13.1.11.1. Company Overview
- 13.1.11.2. Products
- 13.1.11.3. Company Financials
- 13.1.11.4. SWOT Analysis
- 13.1.12 Fujifilm Holdings Corporation
- 13.1.12.1. Company Overview
- 13.1.12.2. Products
- 13.1.12.3. Company Financials
- 13.1.12.4. SWOT Analysis
- 13.1.1 Konica Minolta Inc
- 13.2. Market Entropy
- 13.2.1 Company's Key Areas Served
- 13.2.2 Recent Developments
- 13.3. Company Market Share Analysis 2025
- 13.3.1 Top 5 Companies Market Share Analysis
- 13.3.2 Top 3 Companies Market Share Analysis
- 13.4. List of Potential Customers
- 14. Research Methodology
List of Figures
- Figure 1: Global Medical X-Ray Equipment and Imaging Software Industry Revenue Breakdown (Million, %) by Region 2025 & 2033
- Figure 2: Global Medical X-Ray Equipment and Imaging Software Industry Volume Breakdown (K Unit, %) by Region 2025 & 2033
- Figure 3: North America Medical X-Ray Equipment and Imaging Software Industry Revenue (Million), by Type 2025 & 2033
- Figure 4: North America Medical X-Ray Equipment and Imaging Software Industry Volume (K Unit), by Type 2025 & 2033
- Figure 5: North America Medical X-Ray Equipment and Imaging Software Industry Revenue Share (%), by Type 2025 & 2033
- Figure 6: North America Medical X-Ray Equipment and Imaging Software Industry Volume Share (%), by Type 2025 & 2033
- Figure 7: North America Medical X-Ray Equipment and Imaging Software Industry Revenue (Million), by Technology 2025 & 2033
- Figure 8: North America Medical X-Ray Equipment and Imaging Software Industry Volume (K Unit), by Technology 2025 & 2033
- Figure 9: North America Medical X-Ray Equipment and Imaging Software Industry Revenue Share (%), by Technology 2025 & 2033
- Figure 10: North America Medical X-Ray Equipment and Imaging Software Industry Volume Share (%), by Technology 2025 & 2033
- Figure 11: North America Medical X-Ray Equipment and Imaging Software Industry Revenue (Million), by Image Type 2025 & 2033
- Figure 12: North America Medical X-Ray Equipment and Imaging Software Industry Volume (K Unit), by Image Type 2025 & 2033
- Figure 13: North America Medical X-Ray Equipment and Imaging Software Industry Revenue Share (%), by Image Type 2025 & 2033
- Figure 14: North America Medical X-Ray Equipment and Imaging Software Industry Volume Share (%), by Image Type 2025 & 2033
- Figure 15: North America Medical X-Ray Equipment and Imaging Software Industry Revenue (Million), by End-user 2025 & 2033
- Figure 16: North America Medical X-Ray Equipment and Imaging Software Industry Volume (K Unit), by End-user 2025 & 2033
- Figure 17: North America Medical X-Ray Equipment and Imaging Software Industry Revenue Share (%), by End-user 2025 & 2033
- Figure 18: North America Medical X-Ray Equipment and Imaging Software Industry Volume Share (%), by End-user 2025 & 2033
- Figure 19: North America Medical X-Ray Equipment and Imaging Software Industry Revenue (Million), by Country 2025 & 2033
- Figure 20: North America Medical X-Ray Equipment and Imaging Software Industry Volume (K Unit), by Country 2025 & 2033
- Figure 21: North America Medical X-Ray Equipment and Imaging Software Industry Revenue Share (%), by Country 2025 & 2033
- Figure 22: North America Medical X-Ray Equipment and Imaging Software Industry Volume Share (%), by Country 2025 & 2033
- Figure 23: Europe Medical X-Ray Equipment and Imaging Software Industry Revenue (Million), by Type 2025 & 2033
- Figure 24: Europe Medical X-Ray Equipment and Imaging Software Industry Volume (K Unit), by Type 2025 & 2033
- Figure 25: Europe Medical X-Ray Equipment and Imaging Software Industry Revenue Share (%), by Type 2025 & 2033
- Figure 26: Europe Medical X-Ray Equipment and Imaging Software Industry Volume Share (%), by Type 2025 & 2033
- Figure 27: Europe Medical X-Ray Equipment and Imaging Software Industry Revenue (Million), by Technology 2025 & 2033
- Figure 28: Europe Medical X-Ray Equipment and Imaging Software Industry Volume (K Unit), by Technology 2025 & 2033
- Figure 29: Europe Medical X-Ray Equipment and Imaging Software Industry Revenue Share (%), by Technology 2025 & 2033
- Figure 30: Europe Medical X-Ray Equipment and Imaging Software Industry Volume Share (%), by Technology 2025 & 2033
- Figure 31: Europe Medical X-Ray Equipment and Imaging Software Industry Revenue (Million), by Image Type 2025 & 2033
- Figure 32: Europe Medical X-Ray Equipment and Imaging Software Industry Volume (K Unit), by Image Type 2025 & 2033
- Figure 33: Europe Medical X-Ray Equipment and Imaging Software Industry Revenue Share (%), by Image Type 2025 & 2033
- Figure 34: Europe Medical X-Ray Equipment and Imaging Software Industry Volume Share (%), by Image Type 2025 & 2033
- Figure 35: Europe Medical X-Ray Equipment and Imaging Software Industry Revenue (Million), by End-user 2025 & 2033
- Figure 36: Europe Medical X-Ray Equipment and Imaging Software Industry Volume (K Unit), by End-user 2025 & 2033
- Figure 37: Europe Medical X-Ray Equipment and Imaging Software Industry Revenue Share (%), by End-user 2025 & 2033
- Figure 38: Europe Medical X-Ray Equipment and Imaging Software Industry Volume Share (%), by End-user 2025 & 2033
- Figure 39: Europe Medical X-Ray Equipment and Imaging Software Industry Revenue (Million), by Country 2025 & 2033
- Figure 40: Europe Medical X-Ray Equipment and Imaging Software Industry Volume (K Unit), by Country 2025 & 2033
- Figure 41: Europe Medical X-Ray Equipment and Imaging Software Industry Revenue Share (%), by Country 2025 & 2033
- Figure 42: Europe Medical X-Ray Equipment and Imaging Software Industry Volume Share (%), by Country 2025 & 2033
- Figure 43: Asia Medical X-Ray Equipment and Imaging Software Industry Revenue (Million), by Type 2025 & 2033
- Figure 44: Asia Medical X-Ray Equipment and Imaging Software Industry Volume (K Unit), by Type 2025 & 2033
- Figure 45: Asia Medical X-Ray Equipment and Imaging Software Industry Revenue Share (%), by Type 2025 & 2033
- Figure 46: Asia Medical X-Ray Equipment and Imaging Software Industry Volume Share (%), by Type 2025 & 2033
- Figure 47: Asia Medical X-Ray Equipment and Imaging Software Industry Revenue (Million), by Technology 2025 & 2033
- Figure 48: Asia Medical X-Ray Equipment and Imaging Software Industry Volume (K Unit), by Technology 2025 & 2033
- Figure 49: Asia Medical X-Ray Equipment and Imaging Software Industry Revenue Share (%), by Technology 2025 & 2033
- Figure 50: Asia Medical X-Ray Equipment and Imaging Software Industry Volume Share (%), by Technology 2025 & 2033
- Figure 51: Asia Medical X-Ray Equipment and Imaging Software Industry Revenue (Million), by Image Type 2025 & 2033
- Figure 52: Asia Medical X-Ray Equipment and Imaging Software Industry Volume (K Unit), by Image Type 2025 & 2033
- Figure 53: Asia Medical X-Ray Equipment and Imaging Software Industry Revenue Share (%), by Image Type 2025 & 2033
- Figure 54: Asia Medical X-Ray Equipment and Imaging Software Industry Volume Share (%), by Image Type 2025 & 2033
- Figure 55: Asia Medical X-Ray Equipment and Imaging Software Industry Revenue (Million), by End-user 2025 & 2033
- Figure 56: Asia Medical X-Ray Equipment and Imaging Software Industry Volume (K Unit), by End-user 2025 & 2033
- Figure 57: Asia Medical X-Ray Equipment and Imaging Software Industry Revenue Share (%), by End-user 2025 & 2033
- Figure 58: Asia Medical X-Ray Equipment and Imaging Software Industry Volume Share (%), by End-user 2025 & 2033
- Figure 59: Asia Medical X-Ray Equipment and Imaging Software Industry Revenue (Million), by Country 2025 & 2033
- Figure 60: Asia Medical X-Ray Equipment and Imaging Software Industry Volume (K Unit), by Country 2025 & 2033
- Figure 61: Asia Medical X-Ray Equipment and Imaging Software Industry Revenue Share (%), by Country 2025 & 2033
- Figure 62: Asia Medical X-Ray Equipment and Imaging Software Industry Volume Share (%), by Country 2025 & 2033
- Figure 63: Australia and New Zealand Medical X-Ray Equipment and Imaging Software Industry Revenue (Million), by Type 2025 & 2033
- Figure 64: Australia and New Zealand Medical X-Ray Equipment and Imaging Software Industry Volume (K Unit), by Type 2025 & 2033
- Figure 65: Australia and New Zealand Medical X-Ray Equipment and Imaging Software Industry Revenue Share (%), by Type 2025 & 2033
- Figure 66: Australia and New Zealand Medical X-Ray Equipment and Imaging Software Industry Volume Share (%), by Type 2025 & 2033
- Figure 67: Australia and New Zealand Medical X-Ray Equipment and Imaging Software Industry Revenue (Million), by Technology 2025 & 2033
- Figure 68: Australia and New Zealand Medical X-Ray Equipment and Imaging Software Industry Volume (K Unit), by Technology 2025 & 2033
- Figure 69: Australia and New Zealand Medical X-Ray Equipment and Imaging Software Industry Revenue Share (%), by Technology 2025 & 2033
- Figure 70: Australia and New Zealand Medical X-Ray Equipment and Imaging Software Industry Volume Share (%), by Technology 2025 & 2033
- Figure 71: Australia and New Zealand Medical X-Ray Equipment and Imaging Software Industry Revenue (Million), by Image Type 2025 & 2033
- Figure 72: Australia and New Zealand Medical X-Ray Equipment and Imaging Software Industry Volume (K Unit), by Image Type 2025 & 2033
- Figure 73: Australia and New Zealand Medical X-Ray Equipment and Imaging Software Industry Revenue Share (%), by Image Type 2025 & 2033
- Figure 74: Australia and New Zealand Medical X-Ray Equipment and Imaging Software Industry Volume Share (%), by Image Type 2025 & 2033
- Figure 75: Australia and New Zealand Medical X-Ray Equipment and Imaging Software Industry Revenue (Million), by End-user 2025 & 2033
- Figure 76: Australia and New Zealand Medical X-Ray Equipment and Imaging Software Industry Volume (K Unit), by End-user 2025 & 2033
- Figure 77: Australia and New Zealand Medical X-Ray Equipment and Imaging Software Industry Revenue Share (%), by End-user 2025 & 2033
- Figure 78: Australia and New Zealand Medical X-Ray Equipment and Imaging Software Industry Volume Share (%), by End-user 2025 & 2033
- Figure 79: Australia and New Zealand Medical X-Ray Equipment and Imaging Software Industry Revenue (Million), by Country 2025 & 2033
- Figure 80: Australia and New Zealand Medical X-Ray Equipment and Imaging Software Industry Volume (K Unit), by Country 2025 & 2033
- Figure 81: Australia and New Zealand Medical X-Ray Equipment and Imaging Software Industry Revenue Share (%), by Country 2025 & 2033
- Figure 82: Australia and New Zealand Medical X-Ray Equipment and Imaging Software Industry Volume Share (%), by Country 2025 & 2033
- Figure 83: Middle East and Africa Medical X-Ray Equipment and Imaging Software Industry Revenue (Million), by Type 2025 & 2033
- Figure 84: Middle East and Africa Medical X-Ray Equipment and Imaging Software Industry Volume (K Unit), by Type 2025 & 2033
- Figure 85: Middle East and Africa Medical X-Ray Equipment and Imaging Software Industry Revenue Share (%), by Type 2025 & 2033
- Figure 86: Middle East and Africa Medical X-Ray Equipment and Imaging Software Industry Volume Share (%), by Type 2025 & 2033
- Figure 87: Middle East and Africa Medical X-Ray Equipment and Imaging Software Industry Revenue (Million), by Technology 2025 & 2033
- Figure 88: Middle East and Africa Medical X-Ray Equipment and Imaging Software Industry Volume (K Unit), by Technology 2025 & 2033
- Figure 89: Middle East and Africa Medical X-Ray Equipment and Imaging Software Industry Revenue Share (%), by Technology 2025 & 2033
- Figure 90: Middle East and Africa Medical X-Ray Equipment and Imaging Software Industry Volume Share (%), by Technology 2025 & 2033
- Figure 91: Middle East and Africa Medical X-Ray Equipment and Imaging Software Industry Revenue (Million), by Image Type 2025 & 2033
- Figure 92: Middle East and Africa Medical X-Ray Equipment and Imaging Software Industry Volume (K Unit), by Image Type 2025 & 2033
- Figure 93: Middle East and Africa Medical X-Ray Equipment and Imaging Software Industry Revenue Share (%), by Image Type 2025 & 2033
- Figure 94: Middle East and Africa Medical X-Ray Equipment and Imaging Software Industry Volume Share (%), by Image Type 2025 & 2033
- Figure 95: Middle East and Africa Medical X-Ray Equipment and Imaging Software Industry Revenue (Million), by End-user 2025 & 2033
- Figure 96: Middle East and Africa Medical X-Ray Equipment and Imaging Software Industry Volume (K Unit), by End-user 2025 & 2033
- Figure 97: Middle East and Africa Medical X-Ray Equipment and Imaging Software Industry Revenue Share (%), by End-user 2025 & 2033
- Figure 98: Middle East and Africa Medical X-Ray Equipment and Imaging Software Industry Volume Share (%), by End-user 2025 & 2033
- Figure 99: Middle East and Africa Medical X-Ray Equipment and Imaging Software Industry Revenue (Million), by Country 2025 & 2033
- Figure 100: Middle East and Africa Medical X-Ray Equipment and Imaging Software Industry Volume (K Unit), by Country 2025 & 2033
- Figure 101: Middle East and Africa Medical X-Ray Equipment and Imaging Software Industry Revenue Share (%), by Country 2025 & 2033
- Figure 102: Middle East and Africa Medical X-Ray Equipment and Imaging Software Industry Volume Share (%), by Country 2025 & 2033
- Figure 103: Latin America Medical X-Ray Equipment and Imaging Software Industry Revenue (Million), by Type 2025 & 2033
- Figure 104: Latin America Medical X-Ray Equipment and Imaging Software Industry Volume (K Unit), by Type 2025 & 2033
- Figure 105: Latin America Medical X-Ray Equipment and Imaging Software Industry Revenue Share (%), by Type 2025 & 2033
- Figure 106: Latin America Medical X-Ray Equipment and Imaging Software Industry Volume Share (%), by Type 2025 & 2033
- Figure 107: Latin America Medical X-Ray Equipment and Imaging Software Industry Revenue (Million), by Technology 2025 & 2033
- Figure 108: Latin America Medical X-Ray Equipment and Imaging Software Industry Volume (K Unit), by Technology 2025 & 2033
- Figure 109: Latin America Medical X-Ray Equipment and Imaging Software Industry Revenue Share (%), by Technology 2025 & 2033
- Figure 110: Latin America Medical X-Ray Equipment and Imaging Software Industry Volume Share (%), by Technology 2025 & 2033
- Figure 111: Latin America Medical X-Ray Equipment and Imaging Software Industry Revenue (Million), by Image Type 2025 & 2033
- Figure 112: Latin America Medical X-Ray Equipment and Imaging Software Industry Volume (K Unit), by Image Type 2025 & 2033
- Figure 113: Latin America Medical X-Ray Equipment and Imaging Software Industry Revenue Share (%), by Image Type 2025 & 2033
- Figure 114: Latin America Medical X-Ray Equipment and Imaging Software Industry Volume Share (%), by Image Type 2025 & 2033
- Figure 115: Latin America Medical X-Ray Equipment and Imaging Software Industry Revenue (Million), by End-user 2025 & 2033
- Figure 116: Latin America Medical X-Ray Equipment and Imaging Software Industry Volume (K Unit), by End-user 2025 & 2033
- Figure 117: Latin America Medical X-Ray Equipment and Imaging Software Industry Revenue Share (%), by End-user 2025 & 2033
- Figure 118: Latin America Medical X-Ray Equipment and Imaging Software Industry Volume Share (%), by End-user 2025 & 2033
- Figure 119: Latin America Medical X-Ray Equipment and Imaging Software Industry Revenue (Million), by Country 2025 & 2033
- Figure 120: Latin America Medical X-Ray Equipment and Imaging Software Industry Volume (K Unit), by Country 2025 & 2033
- Figure 121: Latin America Medical X-Ray Equipment and Imaging Software Industry Revenue Share (%), by Country 2025 & 2033
- Figure 122: Latin America Medical X-Ray Equipment and Imaging Software Industry Volume Share (%), by Country 2025 & 2033
List of Tables
- Table 1: Global Medical X-Ray Equipment and Imaging Software Industry Revenue Million Forecast, by Type 2020 & 2033
- Table 2: Global Medical X-Ray Equipment and Imaging Software Industry Volume K Unit Forecast, by Type 2020 & 2033
- Table 3: Global Medical X-Ray Equipment and Imaging Software Industry Revenue Million Forecast, by Technology 2020 & 2033
- Table 4: Global Medical X-Ray Equipment and Imaging Software Industry Volume K Unit Forecast, by Technology 2020 & 2033
- Table 5: Global Medical X-Ray Equipment and Imaging Software Industry Revenue Million Forecast, by Image Type 2020 & 2033
- Table 6: Global Medical X-Ray Equipment and Imaging Software Industry Volume K Unit Forecast, by Image Type 2020 & 2033
- Table 7: Global Medical X-Ray Equipment and Imaging Software Industry Revenue Million Forecast, by End-user 2020 & 2033
- Table 8: Global Medical X-Ray Equipment and Imaging Software Industry Volume K Unit Forecast, by End-user 2020 & 2033
- Table 9: Global Medical X-Ray Equipment and Imaging Software Industry Revenue Million Forecast, by Region 2020 & 2033
- Table 10: Global Medical X-Ray Equipment and Imaging Software Industry Volume K Unit Forecast, by Region 2020 & 2033
- Table 11: Global Medical X-Ray Equipment and Imaging Software Industry Revenue Million Forecast, by Type 2020 & 2033
- Table 12: Global Medical X-Ray Equipment and Imaging Software Industry Volume K Unit Forecast, by Type 2020 & 2033
- Table 13: Global Medical X-Ray Equipment and Imaging Software Industry Revenue Million Forecast, by Technology 2020 & 2033
- Table 14: Global Medical X-Ray Equipment and Imaging Software Industry Volume K Unit Forecast, by Technology 2020 & 2033
- Table 15: Global Medical X-Ray Equipment and Imaging Software Industry Revenue Million Forecast, by Image Type 2020 & 2033
- Table 16: Global Medical X-Ray Equipment and Imaging Software Industry Volume K Unit Forecast, by Image Type 2020 & 2033
- Table 17: Global Medical X-Ray Equipment and Imaging Software Industry Revenue Million Forecast, by End-user 2020 & 2033
- Table 18: Global Medical X-Ray Equipment and Imaging Software Industry Volume K Unit Forecast, by End-user 2020 & 2033
- Table 19: Global Medical X-Ray Equipment and Imaging Software Industry Revenue Million Forecast, by Country 2020 & 2033
- Table 20: Global Medical X-Ray Equipment and Imaging Software Industry Volume K Unit Forecast, by Country 2020 & 2033
- Table 21: Global Medical X-Ray Equipment and Imaging Software Industry Revenue Million Forecast, by Type 2020 & 2033
- Table 22: Global Medical X-Ray Equipment and Imaging Software Industry Volume K Unit Forecast, by Type 2020 & 2033
- Table 23: Global Medical X-Ray Equipment and Imaging Software Industry Revenue Million Forecast, by Technology 2020 & 2033
- Table 24: Global Medical X-Ray Equipment and Imaging Software Industry Volume K Unit Forecast, by Technology 2020 & 2033
- Table 25: Global Medical X-Ray Equipment and Imaging Software Industry Revenue Million Forecast, by Image Type 2020 & 2033
- Table 26: Global Medical X-Ray Equipment and Imaging Software Industry Volume K Unit Forecast, by Image Type 2020 & 2033
- Table 27: Global Medical X-Ray Equipment and Imaging Software Industry Revenue Million Forecast, by End-user 2020 & 2033
- Table 28: Global Medical X-Ray Equipment and Imaging Software Industry Volume K Unit Forecast, by End-user 2020 & 2033
- Table 29: Global Medical X-Ray Equipment and Imaging Software Industry Revenue Million Forecast, by Country 2020 & 2033
- Table 30: Global Medical X-Ray Equipment and Imaging Software Industry Volume K Unit Forecast, by Country 2020 & 2033
- Table 31: Global Medical X-Ray Equipment and Imaging Software Industry Revenue Million Forecast, by Type 2020 & 2033
- Table 32: Global Medical X-Ray Equipment and Imaging Software Industry Volume K Unit Forecast, by Type 2020 & 2033
- Table 33: Global Medical X-Ray Equipment and Imaging Software Industry Revenue Million Forecast, by Technology 2020 & 2033
- Table 34: Global Medical X-Ray Equipment and Imaging Software Industry Volume K Unit Forecast, by Technology 2020 & 2033
- Table 35: Global Medical X-Ray Equipment and Imaging Software Industry Revenue Million Forecast, by Image Type 2020 & 2033
- Table 36: Global Medical X-Ray Equipment and Imaging Software Industry Volume K Unit Forecast, by Image Type 2020 & 2033
- Table 37: Global Medical X-Ray Equipment and Imaging Software Industry Revenue Million Forecast, by End-user 2020 & 2033
- Table 38: Global Medical X-Ray Equipment and Imaging Software Industry Volume K Unit Forecast, by End-user 2020 & 2033
- Table 39: Global Medical X-Ray Equipment and Imaging Software Industry Revenue Million Forecast, by Country 2020 & 2033
- Table 40: Global Medical X-Ray Equipment and Imaging Software Industry Volume K Unit Forecast, by Country 2020 & 2033
- Table 41: Global Medical X-Ray Equipment and Imaging Software Industry Revenue Million Forecast, by Type 2020 & 2033
- Table 42: Global Medical X-Ray Equipment and Imaging Software Industry Volume K Unit Forecast, by Type 2020 & 2033
- Table 43: Global Medical X-Ray Equipment and Imaging Software Industry Revenue Million Forecast, by Technology 2020 & 2033
- Table 44: Global Medical X-Ray Equipment and Imaging Software Industry Volume K Unit Forecast, by Technology 2020 & 2033
- Table 45: Global Medical X-Ray Equipment and Imaging Software Industry Revenue Million Forecast, by Image Type 2020 & 2033
- Table 46: Global Medical X-Ray Equipment and Imaging Software Industry Volume K Unit Forecast, by Image Type 2020 & 2033
- Table 47: Global Medical X-Ray Equipment and Imaging Software Industry Revenue Million Forecast, by End-user 2020 & 2033
- Table 48: Global Medical X-Ray Equipment and Imaging Software Industry Volume K Unit Forecast, by End-user 2020 & 2033
- Table 49: Global Medical X-Ray Equipment and Imaging Software Industry Revenue Million Forecast, by Country 2020 & 2033
- Table 50: Global Medical X-Ray Equipment and Imaging Software Industry Volume K Unit Forecast, by Country 2020 & 2033
- Table 51: Global Medical X-Ray Equipment and Imaging Software Industry Revenue Million Forecast, by Type 2020 & 2033
- Table 52: Global Medical X-Ray Equipment and Imaging Software Industry Volume K Unit Forecast, by Type 2020 & 2033
- Table 53: Global Medical X-Ray Equipment and Imaging Software Industry Revenue Million Forecast, by Technology 2020 & 2033
- Table 54: Global Medical X-Ray Equipment and Imaging Software Industry Volume K Unit Forecast, by Technology 2020 & 2033
- Table 55: Global Medical X-Ray Equipment and Imaging Software Industry Revenue Million Forecast, by Image Type 2020 & 2033
- Table 56: Global Medical X-Ray Equipment and Imaging Software Industry Volume K Unit Forecast, by Image Type 2020 & 2033
- Table 57: Global Medical X-Ray Equipment and Imaging Software Industry Revenue Million Forecast, by End-user 2020 & 2033
- Table 58: Global Medical X-Ray Equipment and Imaging Software Industry Volume K Unit Forecast, by End-user 2020 & 2033
- Table 59: Global Medical X-Ray Equipment and Imaging Software Industry Revenue Million Forecast, by Country 2020 & 2033
- Table 60: Global Medical X-Ray Equipment and Imaging Software Industry Volume K Unit Forecast, by Country 2020 & 2033
- Table 61: Global Medical X-Ray Equipment and Imaging Software Industry Revenue Million Forecast, by Type 2020 & 2033
- Table 62: Global Medical X-Ray Equipment and Imaging Software Industry Volume K Unit Forecast, by Type 2020 & 2033
- Table 63: Global Medical X-Ray Equipment and Imaging Software Industry Revenue Million Forecast, by Technology 2020 & 2033
- Table 64: Global Medical X-Ray Equipment and Imaging Software Industry Volume K Unit Forecast, by Technology 2020 & 2033
- Table 65: Global Medical X-Ray Equipment and Imaging Software Industry Revenue Million Forecast, by Image Type 2020 & 2033
- Table 66: Global Medical X-Ray Equipment and Imaging Software Industry Volume K Unit Forecast, by Image Type 2020 & 2033
- Table 67: Global Medical X-Ray Equipment and Imaging Software Industry Revenue Million Forecast, by End-user 2020 & 2033
- Table 68: Global Medical X-Ray Equipment and Imaging Software Industry Volume K Unit Forecast, by End-user 2020 & 2033
- Table 69: Global Medical X-Ray Equipment and Imaging Software Industry Revenue Million Forecast, by Country 2020 & 2033
- Table 70: Global Medical X-Ray Equipment and Imaging Software Industry Volume K Unit Forecast, by Country 2020 & 2033
Frequently Asked Questions
1. What is the projected Compound Annual Growth Rate (CAGR) of the Medical X-Ray Equipment and Imaging Software Industry?
The projected CAGR is approximately 4.60%.
2. Which companies are prominent players in the Medical X-Ray Equipment and Imaging Software Industry?
Key companies in the market include Konica Minolta Inc, Siemens Healthcare GmbH, Canon Inc, IBM Corporation, Varex Imaging Corporation, Hitachi Ltd, Shimazdu Corporation, Hologic Inc , Koninklijke Philips NV, GE Healthcare Inc, Carestream Health Inc, Fujifilm Holdings Corporation.
3. What are the main segments of the Medical X-Ray Equipment and Imaging Software Industry?
The market segments include Type, Technology, Image Type, End-user.
4. Can you provide details about the market size?
The market size is estimated to be USD XX Million as of 2022.
5. What are some drivers contributing to market growth?
Increasing Incidences of Diseases and Growing Geriatric Population; Rising Investments in Healthcare Industry and Favorable Government Initiatives.
6. What are the notable trends driving market growth?
Diagnostic Centers Majorly Drive the Market Demand.
7. Are there any restraints impacting market growth?
Stringent Regulations and Validator Guidelines; Security Issues Associated with the Software.
8. Can you provide examples of recent developments in the market?
July 2023 - Shimadzu Corporation announced the release of a new mobile X-ray system known as MobileDaRt Evolution MX8 version k type, which is equipped with serial radiography functionality known as Dynamic Digital Radiography (DDR). It displays a series of static images captured at high speed as a moving image.
9. What pricing options are available for accessing the report?
Pricing options include single-user, multi-user, and enterprise licenses priced at USD 4750, USD 5250, and USD 8750 respectively.
10. Is the market size provided in terms of value or volume?
The market size is provided in terms of value, measured in Million and volume, measured in K Unit.
11. Are there any specific market keywords associated with the report?
Yes, the market keyword associated with the report is "Medical X-Ray Equipment and Imaging Software Industry," which aids in identifying and referencing the specific market segment covered.
12. How do I determine which pricing option suits my needs best?
The pricing options vary based on user requirements and access needs. Individual users may opt for single-user licenses, while businesses requiring broader access may choose multi-user or enterprise licenses for cost-effective access to the report.
13. Are there any additional resources or data provided in the Medical X-Ray Equipment and Imaging Software Industry report?
While the report offers comprehensive insights, it's advisable to review the specific contents or supplementary materials provided to ascertain if additional resources or data are available.
14. How can I stay updated on further developments or reports in the Medical X-Ray Equipment and Imaging Software Industry?
To stay informed about further developments, trends, and reports in the Medical X-Ray Equipment and Imaging Software Industry, consider subscribing to industry newsletters, following relevant companies and organizations, or regularly checking reputable industry news sources and publications.
Methodology
Step 1 - Identification of Relevant Samples Size from Population Database


Step 2 - Approaches for Defining Global Market Size (Value, Volume* & Price*)

Note*: In applicable scenarios
Step 3 - Data Sources
Primary Research
- Web Analytics
- Survey Reports
- Research Institute
- Latest Research Reports
- Opinion Leaders
Secondary Research
- Annual Reports
- White Paper
- Latest Press Release
- Industry Association
- Paid Database
- Investor Presentations

Step 4 - Data Triangulation
Involves using different sources of information in order to increase the validity of a study
These sources are likely to be stakeholders in a program - participants, other researchers, program staff, other community members, and so on.
Then we put all data in single framework & apply various statistical tools to find out the dynamic on the market.
During the analysis stage, feedback from the stakeholder groups would be compared to determine areas of agreement as well as areas of divergence