

Key Insights
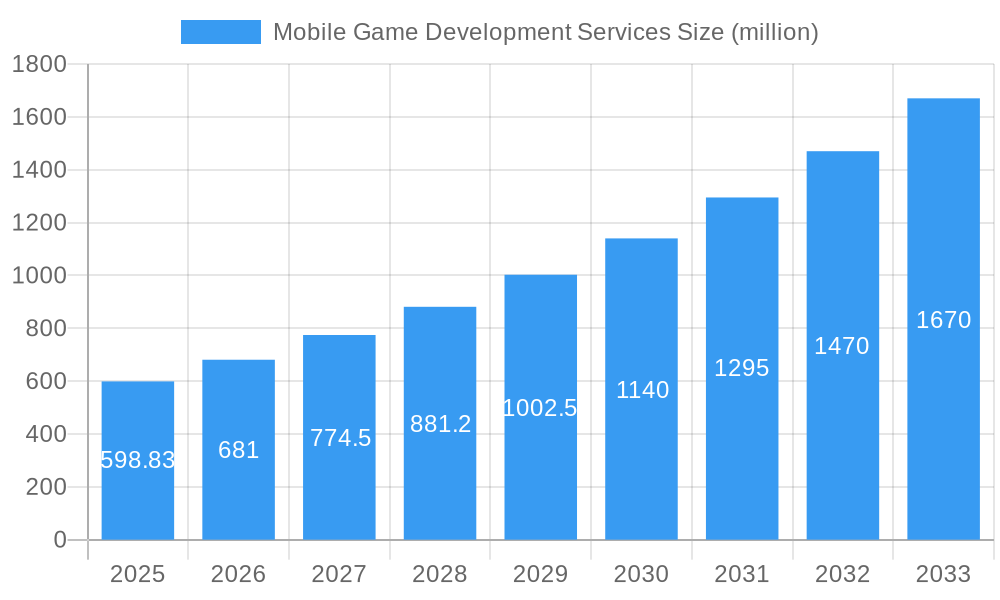
The global mobile game development services market is poised for significant expansion, projected to reach $598.83 million by 2025. This growth is fueled by an impressive CAGR of 13.62% over the forecast period. The increasing penetration of smartphones worldwide, coupled with a burgeoning demand for engaging and immersive gaming experiences, forms the bedrock of this robust market trajectory. The proliferation of advanced mobile technologies, including 5G connectivity and increasingly powerful mobile processors, is enabling developers to create more sophisticated and graphically rich games, further stimulating consumer interest and spending. Furthermore, the rise of esports and competitive mobile gaming is creating new avenues for development and monetization, attracting both casual and professional gamers. The market is segmented into personal and commercial applications, with both online and offline gaming types contributing to its dynamism. Key drivers include evolving consumer entertainment preferences, the accessibility of mobile gaming platforms, and strategic investments by game development companies.
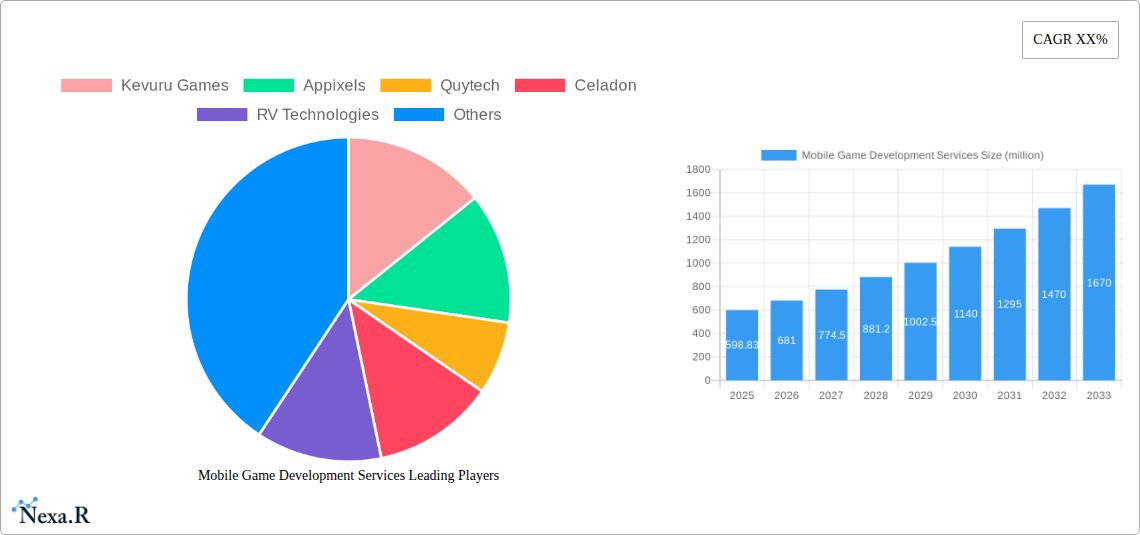
Mobile Game Development Services Market Size (In Million)
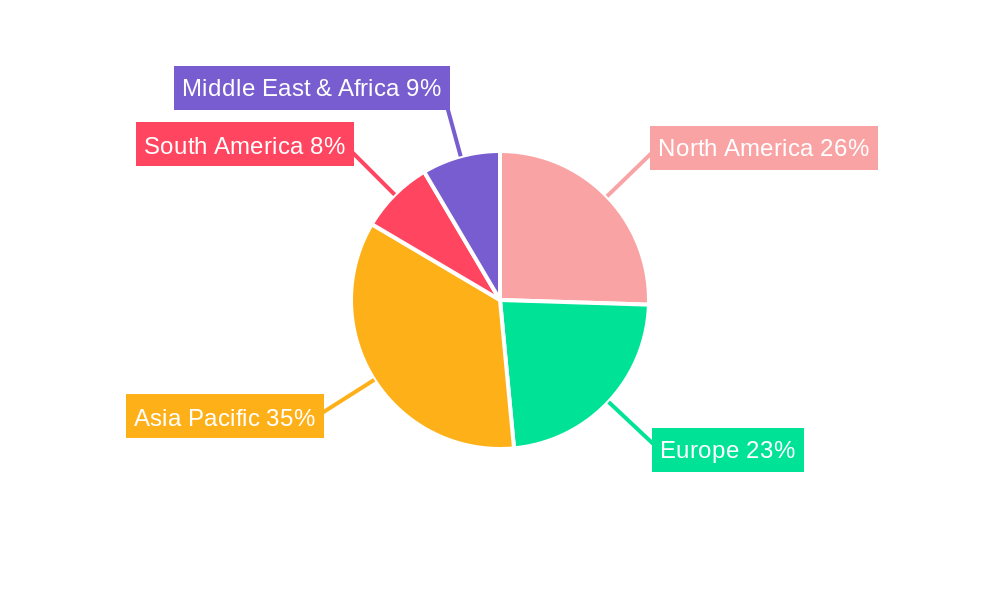
The mobile game development services landscape is characterized by intense competition and rapid innovation, with a wide array of companies actively contributing to market growth. Geographically, the Asia Pacific region is anticipated to lead market share due to its massive smartphone user base and rapid adoption of new gaming technologies, closely followed by North America and Europe, which boast mature gaming markets and high disposable incomes. Emerging economies within South America and the Middle East & Africa are also showing promising growth potential. Trends such as the integration of augmented reality (AR) and virtual reality (VR) into mobile games, the continued rise of hyper-casual games, and the increasing demand for cross-platform development are shaping the industry. While the market presents significant opportunities, potential restraints could include the rising cost of game development, increasing competition for user attention, and evolving regulatory landscapes in certain regions.
Mobile Game Development Services Company Market Share
Mobile Game Development Services Market Dynamics & Structure
The mobile game development services market is characterized by a dynamic blend of intense competition and rapid innovation. Market concentration remains moderately fragmented, with a notable presence of both established global players and agile specialized studios. Technological innovation is primarily driven by advancements in rendering engines (e.g., Unity, Unreal Engine), AI integration for smarter gameplay, and the increasing adoption of augmented reality (AR) and virtual reality (VR) technologies to create more immersive experiences. Regulatory frameworks, particularly concerning data privacy (e.g., GDPR, CCPA) and in-app purchase regulations, are evolving and impacting development practices. Competitive product substitutes include alternative entertainment forms and other digital service categories, but the sheer accessibility and diverse content of mobile games maintain their dominance. End-user demographics are increasingly broad, encompassing all age groups and socioeconomic strata, with a growing demand for hyper-casual, casual, and increasingly sophisticated RPG and strategy titles. Mergers and Acquisitions (M&A) trends are on the rise as larger entities seek to acquire specialized talent, proprietary technology, or expand their existing game portfolios.
- Market Concentration: Moderately fragmented with a mix of large studios and niche providers.
- Technological Innovation: Driven by AR/VR integration, AI, and advanced game engines.
- Regulatory Frameworks: Increasing focus on data privacy and in-app purchase policies.
- Competitive Substitutes: Broad entertainment options, but mobile gaming's accessibility is a key advantage.
- End-User Demographics: Expansive, covering all age groups and preferences for diverse game genres.
- M&A Trends: Active consolidation as companies seek strategic growth and talent acquisition.
Mobile Game Development Services Growth Trends & Insights
The mobile game development services market has witnessed an extraordinary evolution in market size, driven by an ever-increasing global smartphone penetration and a continuously expanding player base. Over the Historical Period (2019–2024), the market experienced robust growth, fueled by the democratization of game development tools and the rise of the free-to-play model, which significantly lowered the barrier to entry for consumers. As of the Base Year (2025), the global market size is projected to reach approximately $120 billion, with an estimated CAGR of 14.5% projected throughout the Forecast Period (2025–2033). This impressive trajectory is sustained by escalating adoption rates across emerging economies, where mobile devices often serve as the primary computing platform. Technological disruptions are a constant, from the introduction of 5G networks enhancing real-time multiplayer experiences and reducing latency, to the refinement of cloud gaming technologies that enable high-fidelity graphics on less powerful devices.
Consumer behavior shifts are profoundly influencing market dynamics. There's a discernible trend towards more engaged gameplay, with players spending longer sessions and exhibiting a greater willingness to engage with in-app purchases and subscriptions, especially for titles offering compelling narratives or competitive multiplayer environments. The demand for live-ops services – continuous content updates, events, and community management – has surged, requiring developers to offer ongoing support post-launch. Furthermore, the influence of social media and influencer marketing on game discovery and adoption rates cannot be overstated. Platforms like TikTok and YouTube have become critical channels for showcasing new titles and fostering community engagement. The rise of cross-platform play, allowing users to seamlessly transition between mobile, PC, and console experiences, is also a significant growth accelerator, expanding the potential audience for any given title. The Study Period (2019–2033) highlights a sustained period of innovation and expansion, with 2025 serving as a pivotal year for the integration of next-generation technologies and the maturation of existing monetization strategies. The market penetration of mobile gaming, already substantial, is expected to deepen further as advancements in hardware and software continue to push the boundaries of what's possible on a mobile device.
Dominant Regions, Countries, or Segments in Mobile Game Development Services
The global mobile game development services market's growth is significantly shaped by distinct regional strengths and evolving segment dominance. Among the Application segments, Commercial applications currently drive a larger portion of the market revenue, accounting for an estimated 65% of the total market value in 2025, with a projected CAGR of 15.2% during the Forecast Period (2025–2033). This dominance stems from the substantial investments made by businesses in mobile gaming for marketing, brand engagement, and direct monetization through in-app purchases and advertisements. Personal applications, while smaller in immediate revenue, are experiencing a rapid growth rate, fueled by indie developers and hobbyists creating niche titles and a rising demand for personalized gaming experiences.
In terms of Types, Online mobile games represent the larger segment, estimated at 75% of the market in 2025, with a projected CAGR of 14.8%. The inherent interactivity, social features, and continuous content updates offered by online games are highly appealing to a global audience. Offline mobile games, while offering convenience and accessibility without internet connectivity, hold a smaller but stable market share, projected to grow at a more modest CAGR of 12.1%.
Geographically, Asia Pacific is the dominant region, contributing approximately 40% of the global mobile game development services market revenue in 2025, with an anticipated CAGR of 16.0% through 2033. This dominance is attributed to several key drivers:
- Massive Smartphone Penetration: Countries like China, India, and South Korea boast some of the highest smartphone adoption rates globally.
- Large and Engaged Youth Population: A youthful demographic with a high propensity for gaming and digital entertainment.
- Economic Growth and Disposable Income: Increasing purchasing power fuels spending on in-app purchases and premium game content.
- Favorable Regulatory Environments: While evolving, certain markets have historically fostered growth in the gaming sector.
- Technological Infrastructure: Widespread availability of high-speed internet and affordable mobile data plans.
Within Asia Pacific, China alone is expected to command over 25% of the global market share in 2025, driven by its colossal player base and a mature mobile gaming ecosystem. North America and Europe follow, with significant contributions driven by high disposable incomes, advanced technological infrastructure, and a well-established gaming culture. However, the growth potential in emerging markets in Southeast Asia and Latin America is substantial, making them key areas for future expansion and innovation.
Mobile Game Development Services Product Landscape
The product landscape for mobile game development services is characterized by its diversity and continuous innovation. Developers are increasingly focusing on creating games that offer rich, immersive experiences, leveraging cutting-edge technologies such as advanced 3D graphics, realistic physics engines, and AI-driven non-player characters (NPCs). Unique selling propositions often lie in novel gameplay mechanics, compelling storytelling, and cross-platform compatibility. Performance metrics are paramount, with emphasis on smooth frame rates, low battery consumption, and responsive user interfaces. The integration of social features, esports capabilities, and personalized content delivery are key technological advancements driving product differentiation in this competitive market.
Key Drivers, Barriers & Challenges in Mobile Game Development Services
Key Drivers:
- Ubiquitous Smartphone Adoption: The widespread availability of smartphones as primary computing devices fuels demand.
- Growing Demand for Entertainment: Mobile games offer an accessible and diverse form of entertainment for a global audience.
- Advancements in Mobile Technology: Improved processing power, graphical capabilities, and network speeds enable more sophisticated games.
- Rise of the Free-to-Play Model: Lowered entry barriers attract a massive player base, driving in-app revenue.
- Emergence of Hyper-Casual Games: Simple, addictive gameplay loops appeal to a broad, casual audience.
Barriers & Challenges:
- Market Saturation and Discoverability: The sheer volume of games makes it difficult for new titles to gain visibility.
- High User Acquisition Costs: Acquiring new players can be expensive, especially for competitive titles.
- Monetization Strategies: Balancing revenue generation with player experience and avoiding predatory practices is crucial.
- Evolving Regulatory Landscapes: Data privacy laws and in-app purchase regulations can impact development and monetization.
- Talent Shortages: Skilled mobile game developers, artists, and designers are in high demand, leading to recruitment challenges.
- Maintaining Player Engagement: Retaining players over the long term requires continuous content updates and effective live-ops.
Emerging Opportunities in Mobile Game Development Services
Emerging opportunities in mobile game development services lie in the continued exploration of Extended Reality (XR) – encompassing AR and VR – to create truly immersive gaming experiences. The growth of cloud gaming platforms will enable more complex games to be accessible on mobile devices, expanding the scope of potential titles. Furthermore, the integration of blockchain technology for NFTs and play-to-earn mechanics presents a novel monetization and ownership model that could redefine player engagement. Untapped markets in developing regions, with their rapidly growing smartphone user base, offer significant potential for localized and culturally relevant game content. Evolving consumer preferences towards more narrative-driven and social gaming experiences also present opportunities for developers to create engaging multiplayer adventures and persistent virtual worlds.
Growth Accelerators in the Mobile Game Development Services Industry
Several catalysts are accelerating the long-term growth of the mobile game development services industry. Technological breakthroughs, such as advancements in real-time rendering and AI-powered procedural content generation, are enabling developers to create more visually stunning and dynamically engaging games than ever before. Strategic partnerships between game developers, hardware manufacturers, and platform holders are crucial for optimizing performance and expanding reach. Market expansion strategies, particularly targeting emerging economies with increasing disposable incomes and smartphone penetration, represent a significant growth avenue. The increasing adoption of subscription models and the rise of mobile esports are also creating new revenue streams and fostering dedicated player communities, further solidifying the industry's growth trajectory.
Key Players Shaping the Mobile Game Development Services Market
- Kevuru Games
- Appixels
- Quytech
- Celadon
- RV Technologies
- MindInventory
- Sparx IT Solutions
- Gamio
- Whimsy Games
- MMC Global
- TekRevol
- Appstirr
- DevBatch
- 300Mind
- Zaptech Solutions
- Queppelin
- Cubix
- Aaryavarta
- Yug Technology
- TechAhead
- Beta Soft Technology
Notable Milestones in Mobile Game Development Services Sector
- 2019: Increased adoption of cloud-based development tools, streamlining collaboration.
- 2020: Surge in hyper-casual game popularity, redefining mobile game accessibility.
- 2021: Growing investment in AR/VR mobile game experiences, pushing immersive boundaries.
- 2022: Significant advancements in mobile chipset capabilities, enabling console-quality graphics.
- 2023: Rise of play-to-earn models and NFT integration, exploring new monetization paradigms.
- 2024: Continued refinement of live-ops strategies for sustained player engagement and revenue.
In-Depth Mobile Game Development Services Market Outlook
The mobile game development services market is poised for continued robust expansion, driven by relentless technological innovation and evolving consumer engagement. Growth accelerators such as the increasing sophistication of AI in game design, the widespread adoption of 5G for enhanced online play, and the exploration of immersive XR technologies will fuel new avenues for development and monetization. Strategic partnerships and the strategic targeting of emerging markets will be pivotal in capturing a larger global audience. The market outlook suggests a future where mobile gaming is not only a primary entertainment source but also a platform for social interaction, competitive esports, and potentially new digital economies, underscoring significant future market potential and exciting strategic opportunities for all stakeholders.
Mobile Game Development Services Segmentation
-
1. Application
- 1.1. Personal
- 1.2. Commercial
-
2. Types
- 2.1. Online
- 2.2. Offline
Mobile Game Development Services Segmentation By Geography
-
1. North America
- 1.1. United States
- 1.2. Canada
- 1.3. Mexico
-
2. South America
- 2.1. Brazil
- 2.2. Argentina
- 2.3. Rest of South America
-
3. Europe
- 3.1. United Kingdom
- 3.2. Germany
- 3.3. France
- 3.4. Italy
- 3.5. Spain
- 3.6. Russia
- 3.7. Benelux
- 3.8. Nordics
- 3.9. Rest of Europe
-
4. Middle East & Africa
- 4.1. Turkey
- 4.2. Israel
- 4.3. GCC
- 4.4. North Africa
- 4.5. South Africa
- 4.6. Rest of Middle East & Africa
-
5. Asia Pacific
- 5.1. China
- 5.2. India
- 5.3. Japan
- 5.4. South Korea
- 5.5. ASEAN
- 5.6. Oceania
- 5.7. Rest of Asia Pacific
Mobile Game Development Services Regional Market Share
Geographic Coverage of Mobile Game Development Services
Mobile Game Development Services REPORT HIGHLIGHTS
| Aspects | Details |
|---|---|
| Study Period | 2020-2034 |
| Base Year | 2025 |
| Estimated Year | 2026 |
| Forecast Period | 2026-2034 |
| Historical Period | 2020-2025 |
| Growth Rate | CAGR of 13.62% from 2020-2034 |
| Segmentation |
|
Table of Contents
- 1. Introduction
- 1.1. Research Scope
- 1.2. Market Segmentation
- 1.3. Research Objective
- 1.4. Definitions and Assumptions
- 2. Executive Summary
- 2.1. Market Snapshot
- 3. Market Dynamics
- 3.1. Market Drivers
- 3.2. Market Restrains
- 3.3. Market Trends
- 3.4. Market Opportunities
- 4. Market Factor Analysis
- 4.1. Porters Five Forces
- 4.1.1. Bargaining Power of Suppliers
- 4.1.2. Bargaining Power of Buyers
- 4.1.3. Threat of New Entrants
- 4.1.4. Threat of Substitutes
- 4.1.5. Competitive Rivalry
- 4.2. PESTEL analysis
- 4.3. BCG Analysis
- 4.3.1. Stars (High Growth, High Market Share)
- 4.3.2. Cash Cows (Low Growth, High Market Share)
- 4.3.3. Question Mark (High Growth, Low Market Share)
- 4.3.4. Dogs (Low Growth, Low Market Share)
- 4.4. Ansoff Matrix Analysis
- 4.5. Supply Chain Analysis
- 4.6. Regulatory Landscape
- 4.7. Current Market Potential and Opportunity Assessment (TAM–SAM–SOM Framework)
- 4.8. NRP Analyst Note
- 4.1. Porters Five Forces
- 5. Market Analysis, Insights and Forecast 2021-2033
- 5.1. Market Analysis, Insights and Forecast - by Application
- 5.1.1. Personal
- 5.1.2. Commercial
- 5.2. Market Analysis, Insights and Forecast - by Types
- 5.2.1. Online
- 5.2.2. Offline
- 5.3. Market Analysis, Insights and Forecast - by Region
- 5.3.1. North America
- 5.3.2. South America
- 5.3.3. Europe
- 5.3.4. Middle East & Africa
- 5.3.5. Asia Pacific
- 5.1. Market Analysis, Insights and Forecast - by Application
- 6. Global Mobile Game Development Services Analysis, Insights and Forecast, 2021-2033
- 6.1. Market Analysis, Insights and Forecast - by Application
- 6.1.1. Personal
- 6.1.2. Commercial
- 6.2. Market Analysis, Insights and Forecast - by Types
- 6.2.1. Online
- 6.2.2. Offline
- 6.1. Market Analysis, Insights and Forecast - by Application
- 7. North America Mobile Game Development Services Analysis, Insights and Forecast, 2020-2032
- 7.1. Market Analysis, Insights and Forecast - by Application
- 7.1.1. Personal
- 7.1.2. Commercial
- 7.2. Market Analysis, Insights and Forecast - by Types
- 7.2.1. Online
- 7.2.2. Offline
- 7.1. Market Analysis, Insights and Forecast - by Application
- 8. South America Mobile Game Development Services Analysis, Insights and Forecast, 2020-2032
- 8.1. Market Analysis, Insights and Forecast - by Application
- 8.1.1. Personal
- 8.1.2. Commercial
- 8.2. Market Analysis, Insights and Forecast - by Types
- 8.2.1. Online
- 8.2.2. Offline
- 8.1. Market Analysis, Insights and Forecast - by Application
- 9. Europe Mobile Game Development Services Analysis, Insights and Forecast, 2020-2032
- 9.1. Market Analysis, Insights and Forecast - by Application
- 9.1.1. Personal
- 9.1.2. Commercial
- 9.2. Market Analysis, Insights and Forecast - by Types
- 9.2.1. Online
- 9.2.2. Offline
- 9.1. Market Analysis, Insights and Forecast - by Application
- 10. Middle East & Africa Mobile Game Development Services Analysis, Insights and Forecast, 2020-2032
- 10.1. Market Analysis, Insights and Forecast - by Application
- 10.1.1. Personal
- 10.1.2. Commercial
- 10.2. Market Analysis, Insights and Forecast - by Types
- 10.2.1. Online
- 10.2.2. Offline
- 10.1. Market Analysis, Insights and Forecast - by Application
- 11. Asia Pacific Mobile Game Development Services Analysis, Insights and Forecast, 2020-2032
- 11.1. Market Analysis, Insights and Forecast - by Application
- 11.1.1. Personal
- 11.1.2. Commercial
- 11.2. Market Analysis, Insights and Forecast - by Types
- 11.2.1. Online
- 11.2.2. Offline
- 11.1. Market Analysis, Insights and Forecast - by Application
- 12. Competitive Analysis
- 12.1. Company Profiles
- 12.1.1 Kevuru Games
- 12.1.1.1. Company Overview
- 12.1.1.2. Products
- 12.1.1.3. Company Financials
- 12.1.1.4. SWOT Analysis
- 12.1.2 Appixels
- 12.1.2.1. Company Overview
- 12.1.2.2. Products
- 12.1.2.3. Company Financials
- 12.1.2.4. SWOT Analysis
- 12.1.3 Quytech
- 12.1.3.1. Company Overview
- 12.1.3.2. Products
- 12.1.3.3. Company Financials
- 12.1.3.4. SWOT Analysis
- 12.1.4 Celadon
- 12.1.4.1. Company Overview
- 12.1.4.2. Products
- 12.1.4.3. Company Financials
- 12.1.4.4. SWOT Analysis
- 12.1.5 RV Technologies
- 12.1.5.1. Company Overview
- 12.1.5.2. Products
- 12.1.5.3. Company Financials
- 12.1.5.4. SWOT Analysis
- 12.1.6 MindInventory
- 12.1.6.1. Company Overview
- 12.1.6.2. Products
- 12.1.6.3. Company Financials
- 12.1.6.4. SWOT Analysis
- 12.1.7 Sparx IT Solutions
- 12.1.7.1. Company Overview
- 12.1.7.2. Products
- 12.1.7.3. Company Financials
- 12.1.7.4. SWOT Analysis
- 12.1.8 Gamio
- 12.1.8.1. Company Overview
- 12.1.8.2. Products
- 12.1.8.3. Company Financials
- 12.1.8.4. SWOT Analysis
- 12.1.9 Whimsy Games
- 12.1.9.1. Company Overview
- 12.1.9.2. Products
- 12.1.9.3. Company Financials
- 12.1.9.4. SWOT Analysis
- 12.1.10 MMC Global
- 12.1.10.1. Company Overview
- 12.1.10.2. Products
- 12.1.10.3. Company Financials
- 12.1.10.4. SWOT Analysis
- 12.1.11 TekRevol
- 12.1.11.1. Company Overview
- 12.1.11.2. Products
- 12.1.11.3. Company Financials
- 12.1.11.4. SWOT Analysis
- 12.1.12 Appstirr
- 12.1.12.1. Company Overview
- 12.1.12.2. Products
- 12.1.12.3. Company Financials
- 12.1.12.4. SWOT Analysis
- 12.1.13 DevBatch
- 12.1.13.1. Company Overview
- 12.1.13.2. Products
- 12.1.13.3. Company Financials
- 12.1.13.4. SWOT Analysis
- 12.1.14 300Mind
- 12.1.14.1. Company Overview
- 12.1.14.2. Products
- 12.1.14.3. Company Financials
- 12.1.14.4. SWOT Analysis
- 12.1.15 Zaptech Solutions
- 12.1.15.1. Company Overview
- 12.1.15.2. Products
- 12.1.15.3. Company Financials
- 12.1.15.4. SWOT Analysis
- 12.1.16 Queppelin
- 12.1.16.1. Company Overview
- 12.1.16.2. Products
- 12.1.16.3. Company Financials
- 12.1.16.4. SWOT Analysis
- 12.1.17 Cubix
- 12.1.17.1. Company Overview
- 12.1.17.2. Products
- 12.1.17.3. Company Financials
- 12.1.17.4. SWOT Analysis
- 12.1.18 Aaryavarta
- 12.1.18.1. Company Overview
- 12.1.18.2. Products
- 12.1.18.3. Company Financials
- 12.1.18.4. SWOT Analysis
- 12.1.19 Yug Technology
- 12.1.19.1. Company Overview
- 12.1.19.2. Products
- 12.1.19.3. Company Financials
- 12.1.19.4. SWOT Analysis
- 12.1.20 TechAhead
- 12.1.20.1. Company Overview
- 12.1.20.2. Products
- 12.1.20.3. Company Financials
- 12.1.20.4. SWOT Analysis
- 12.1.21 Beta Soft Technology
- 12.1.21.1. Company Overview
- 12.1.21.2. Products
- 12.1.21.3. Company Financials
- 12.1.21.4. SWOT Analysis
- 12.1.1 Kevuru Games
- 12.2. Market Entropy
- 12.2.1 Company's Key Areas Served
- 12.2.2 Recent Developments
- 12.3. Company Market Share Analysis 2025
- 12.3.1 Top 5 Companies Market Share Analysis
- 12.3.2 Top 3 Companies Market Share Analysis
- 12.4. List of Potential Customers
- 13. Research Methodology
List of Figures
- Figure 1: Global Mobile Game Development Services Revenue Breakdown (undefined, %) by Region 2025 & 2033
- Figure 2: North America Mobile Game Development Services Revenue (undefined), by Application 2025 & 2033
- Figure 3: North America Mobile Game Development Services Revenue Share (%), by Application 2025 & 2033
- Figure 4: North America Mobile Game Development Services Revenue (undefined), by Types 2025 & 2033
- Figure 5: North America Mobile Game Development Services Revenue Share (%), by Types 2025 & 2033
- Figure 6: North America Mobile Game Development Services Revenue (undefined), by Country 2025 & 2033
- Figure 7: North America Mobile Game Development Services Revenue Share (%), by Country 2025 & 2033
- Figure 8: South America Mobile Game Development Services Revenue (undefined), by Application 2025 & 2033
- Figure 9: South America Mobile Game Development Services Revenue Share (%), by Application 2025 & 2033
- Figure 10: South America Mobile Game Development Services Revenue (undefined), by Types 2025 & 2033
- Figure 11: South America Mobile Game Development Services Revenue Share (%), by Types 2025 & 2033
- Figure 12: South America Mobile Game Development Services Revenue (undefined), by Country 2025 & 2033
- Figure 13: South America Mobile Game Development Services Revenue Share (%), by Country 2025 & 2033
- Figure 14: Europe Mobile Game Development Services Revenue (undefined), by Application 2025 & 2033
- Figure 15: Europe Mobile Game Development Services Revenue Share (%), by Application 2025 & 2033
- Figure 16: Europe Mobile Game Development Services Revenue (undefined), by Types 2025 & 2033
- Figure 17: Europe Mobile Game Development Services Revenue Share (%), by Types 2025 & 2033
- Figure 18: Europe Mobile Game Development Services Revenue (undefined), by Country 2025 & 2033
- Figure 19: Europe Mobile Game Development Services Revenue Share (%), by Country 2025 & 2033
- Figure 20: Middle East & Africa Mobile Game Development Services Revenue (undefined), by Application 2025 & 2033
- Figure 21: Middle East & Africa Mobile Game Development Services Revenue Share (%), by Application 2025 & 2033
- Figure 22: Middle East & Africa Mobile Game Development Services Revenue (undefined), by Types 2025 & 2033
- Figure 23: Middle East & Africa Mobile Game Development Services Revenue Share (%), by Types 2025 & 2033
- Figure 24: Middle East & Africa Mobile Game Development Services Revenue (undefined), by Country 2025 & 2033
- Figure 25: Middle East & Africa Mobile Game Development Services Revenue Share (%), by Country 2025 & 2033
- Figure 26: Asia Pacific Mobile Game Development Services Revenue (undefined), by Application 2025 & 2033
- Figure 27: Asia Pacific Mobile Game Development Services Revenue Share (%), by Application 2025 & 2033
- Figure 28: Asia Pacific Mobile Game Development Services Revenue (undefined), by Types 2025 & 2033
- Figure 29: Asia Pacific Mobile Game Development Services Revenue Share (%), by Types 2025 & 2033
- Figure 30: Asia Pacific Mobile Game Development Services Revenue (undefined), by Country 2025 & 2033
- Figure 31: Asia Pacific Mobile Game Development Services Revenue Share (%), by Country 2025 & 2033
List of Tables
- Table 1: Global Mobile Game Development Services Revenue undefined Forecast, by Application 2020 & 2033
- Table 2: Global Mobile Game Development Services Revenue undefined Forecast, by Types 2020 & 2033
- Table 3: Global Mobile Game Development Services Revenue undefined Forecast, by Region 2020 & 2033
- Table 4: Global Mobile Game Development Services Revenue undefined Forecast, by Application 2020 & 2033
- Table 5: Global Mobile Game Development Services Revenue undefined Forecast, by Types 2020 & 2033
- Table 6: Global Mobile Game Development Services Revenue undefined Forecast, by Country 2020 & 2033
- Table 7: United States Mobile Game Development Services Revenue (undefined) Forecast, by Application 2020 & 2033
- Table 8: Canada Mobile Game Development Services Revenue (undefined) Forecast, by Application 2020 & 2033
- Table 9: Mexico Mobile Game Development Services Revenue (undefined) Forecast, by Application 2020 & 2033
- Table 10: Global Mobile Game Development Services Revenue undefined Forecast, by Application 2020 & 2033
- Table 11: Global Mobile Game Development Services Revenue undefined Forecast, by Types 2020 & 2033
- Table 12: Global Mobile Game Development Services Revenue undefined Forecast, by Country 2020 & 2033
- Table 13: Brazil Mobile Game Development Services Revenue (undefined) Forecast, by Application 2020 & 2033
- Table 14: Argentina Mobile Game Development Services Revenue (undefined) Forecast, by Application 2020 & 2033
- Table 15: Rest of South America Mobile Game Development Services Revenue (undefined) Forecast, by Application 2020 & 2033
- Table 16: Global Mobile Game Development Services Revenue undefined Forecast, by Application 2020 & 2033
- Table 17: Global Mobile Game Development Services Revenue undefined Forecast, by Types 2020 & 2033
- Table 18: Global Mobile Game Development Services Revenue undefined Forecast, by Country 2020 & 2033
- Table 19: United Kingdom Mobile Game Development Services Revenue (undefined) Forecast, by Application 2020 & 2033
- Table 20: Germany Mobile Game Development Services Revenue (undefined) Forecast, by Application 2020 & 2033
- Table 21: France Mobile Game Development Services Revenue (undefined) Forecast, by Application 2020 & 2033
- Table 22: Italy Mobile Game Development Services Revenue (undefined) Forecast, by Application 2020 & 2033
- Table 23: Spain Mobile Game Development Services Revenue (undefined) Forecast, by Application 2020 & 2033
- Table 24: Russia Mobile Game Development Services Revenue (undefined) Forecast, by Application 2020 & 2033
- Table 25: Benelux Mobile Game Development Services Revenue (undefined) Forecast, by Application 2020 & 2033
- Table 26: Nordics Mobile Game Development Services Revenue (undefined) Forecast, by Application 2020 & 2033
- Table 27: Rest of Europe Mobile Game Development Services Revenue (undefined) Forecast, by Application 2020 & 2033
- Table 28: Global Mobile Game Development Services Revenue undefined Forecast, by Application 2020 & 2033
- Table 29: Global Mobile Game Development Services Revenue undefined Forecast, by Types 2020 & 2033
- Table 30: Global Mobile Game Development Services Revenue undefined Forecast, by Country 2020 & 2033
- Table 31: Turkey Mobile Game Development Services Revenue (undefined) Forecast, by Application 2020 & 2033
- Table 32: Israel Mobile Game Development Services Revenue (undefined) Forecast, by Application 2020 & 2033
- Table 33: GCC Mobile Game Development Services Revenue (undefined) Forecast, by Application 2020 & 2033
- Table 34: North Africa Mobile Game Development Services Revenue (undefined) Forecast, by Application 2020 & 2033
- Table 35: South Africa Mobile Game Development Services Revenue (undefined) Forecast, by Application 2020 & 2033
- Table 36: Rest of Middle East & Africa Mobile Game Development Services Revenue (undefined) Forecast, by Application 2020 & 2033
- Table 37: Global Mobile Game Development Services Revenue undefined Forecast, by Application 2020 & 2033
- Table 38: Global Mobile Game Development Services Revenue undefined Forecast, by Types 2020 & 2033
- Table 39: Global Mobile Game Development Services Revenue undefined Forecast, by Country 2020 & 2033
- Table 40: China Mobile Game Development Services Revenue (undefined) Forecast, by Application 2020 & 2033
- Table 41: India Mobile Game Development Services Revenue (undefined) Forecast, by Application 2020 & 2033
- Table 42: Japan Mobile Game Development Services Revenue (undefined) Forecast, by Application 2020 & 2033
- Table 43: South Korea Mobile Game Development Services Revenue (undefined) Forecast, by Application 2020 & 2033
- Table 44: ASEAN Mobile Game Development Services Revenue (undefined) Forecast, by Application 2020 & 2033
- Table 45: Oceania Mobile Game Development Services Revenue (undefined) Forecast, by Application 2020 & 2033
- Table 46: Rest of Asia Pacific Mobile Game Development Services Revenue (undefined) Forecast, by Application 2020 & 2033
Frequently Asked Questions
1. What is the projected Compound Annual Growth Rate (CAGR) of the Mobile Game Development Services?
The projected CAGR is approximately 13.62%.
2. Which companies are prominent players in the Mobile Game Development Services?
Key companies in the market include Kevuru Games, Appixels, Quytech, Celadon, RV Technologies, MindInventory, Sparx IT Solutions, Gamio, Whimsy Games, MMC Global, TekRevol, Appstirr, DevBatch, 300Mind, Zaptech Solutions, Queppelin, Cubix, Aaryavarta, Yug Technology, TechAhead, Beta Soft Technology.
3. What are the main segments of the Mobile Game Development Services?
The market segments include Application, Types.
4. Can you provide details about the market size?
The market size is estimated to be USD XXX N/A as of 2022.
5. What are some drivers contributing to market growth?
N/A
6. What are the notable trends driving market growth?
N/A
7. Are there any restraints impacting market growth?
N/A
8. Can you provide examples of recent developments in the market?
N/A
9. What pricing options are available for accessing the report?
Pricing options include single-user, multi-user, and enterprise licenses priced at USD 3350.00, USD 5025.00, and USD 6700.00 respectively.
10. Is the market size provided in terms of value or volume?
The market size is provided in terms of value, measured in N/A.
11. Are there any specific market keywords associated with the report?
Yes, the market keyword associated with the report is "Mobile Game Development Services," which aids in identifying and referencing the specific market segment covered.
12. How do I determine which pricing option suits my needs best?
The pricing options vary based on user requirements and access needs. Individual users may opt for single-user licenses, while businesses requiring broader access may choose multi-user or enterprise licenses for cost-effective access to the report.
13. Are there any additional resources or data provided in the Mobile Game Development Services report?
While the report offers comprehensive insights, it's advisable to review the specific contents or supplementary materials provided to ascertain if additional resources or data are available.
14. How can I stay updated on further developments or reports in the Mobile Game Development Services?
To stay informed about further developments, trends, and reports in the Mobile Game Development Services, consider subscribing to industry newsletters, following relevant companies and organizations, or regularly checking reputable industry news sources and publications.
Methodology
Step 1 - Identification of Relevant Samples Size from Population Database


Step 2 - Approaches for Defining Global Market Size (Value, Volume* & Price*)

Note*: In applicable scenarios
Step 3 - Data Sources
Primary Research
- Web Analytics
- Survey Reports
- Research Institute
- Latest Research Reports
- Opinion Leaders
Secondary Research
- Annual Reports
- White Paper
- Latest Press Release
- Industry Association
- Paid Database
- Investor Presentations

Step 4 - Data Triangulation
Involves using different sources of information in order to increase the validity of a study
These sources are likely to be stakeholders in a program - participants, other researchers, program staff, other community members, and so on.
Then we put all data in single framework & apply various statistical tools to find out the dynamic on the market.
During the analysis stage, feedback from the stakeholder groups would be compared to determine areas of agreement as well as areas of divergence