


Key Insights
The Mobile NAND Flash market is projected for significant expansion, estimated to reach a market size of 31.5 billion by 2025, with a robust Compound Annual Growth Rate (CAGR) of 23.8% during the 2025-2033 forecast period. This growth is driven by increasing demand for higher storage in smartphones, tablets, and portable electronics. Advanced mobile applications, HD content, and 5G technology necessitate faster data transfer and storage. Innovations in NAND flash technology, including increased layering and improved performance, enable denser and more efficient storage solutions. The market features a dynamic competitive landscape with continuous R&D investment from major players.
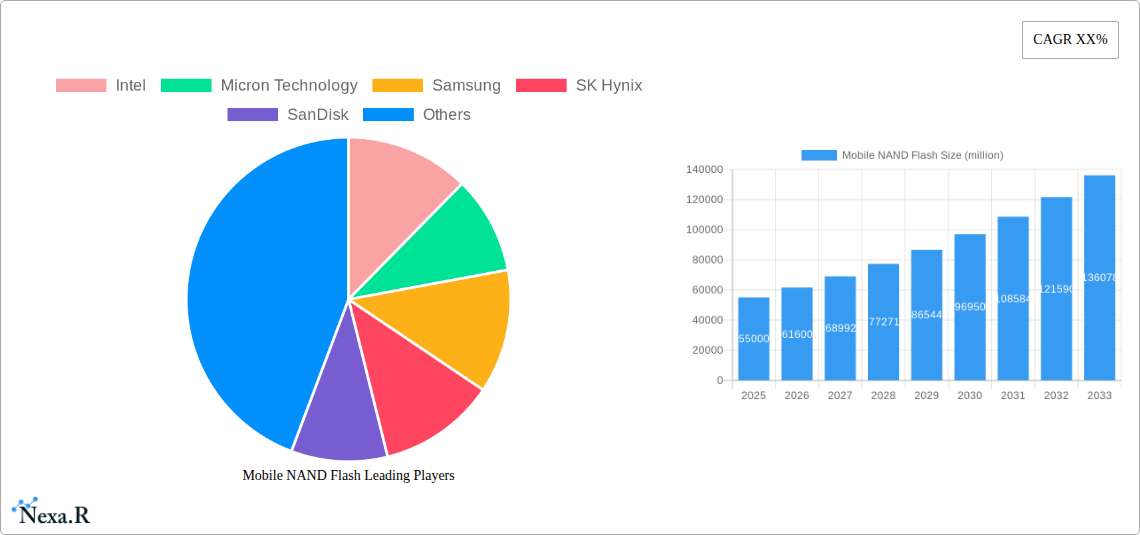
Mobile NAND Flash Market Size (In Billion)

Key applications include smartphones, tablets, and audio players, with smartphones historically leading. Vertically Stacking (3D NAND) technology is predominant, offering superior density and performance. Market growth is supported by strong demand and technological innovation, despite potential restraints like the semiconductor industry's cyclical nature and price competition. Geographically, the Asia Pacific region, particularly China and South Korea, is expected to maintain dominance due to its manufacturing base and consumer market. North America and Europe are substantial markets driven by high disposable incomes and rapid adoption of advanced mobile technologies.
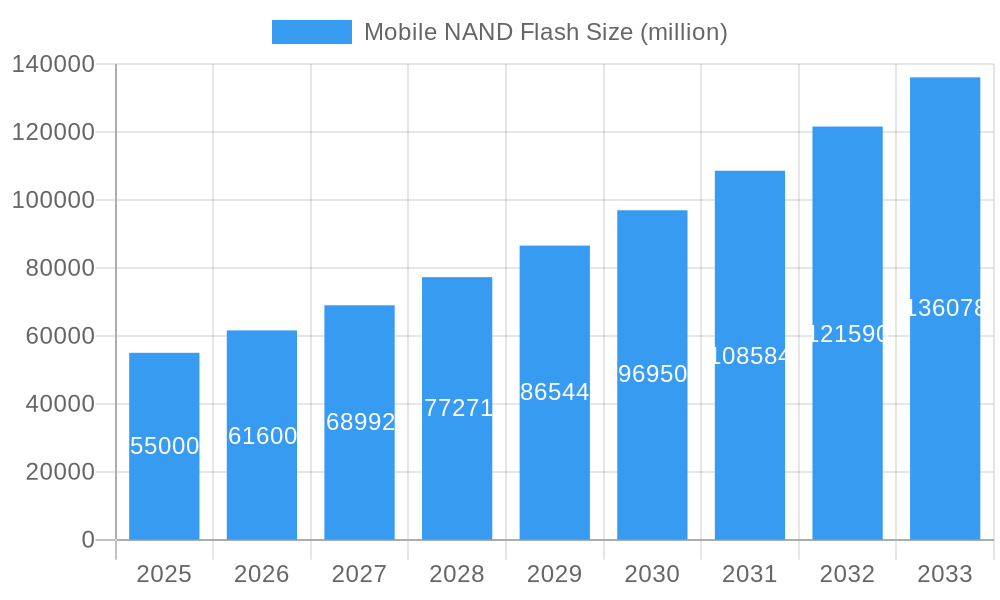
Mobile NAND Flash Company Market Share
Mobile NAND Flash Market Report: Comprehensive Analysis & Future Outlook (2019-2033)
Unlock unparalleled insights into the dynamic Mobile NAND Flash market. This definitive report offers a deep dive into market structure, growth trajectories, regional dominance, product innovations, and future opportunities, providing essential intelligence for stakeholders navigating this rapidly evolving sector. Our analysis encompasses the entire value chain, from technological advancements to consumer adoption, and forecasts market performance through 2033.
Mobile NAND Flash Market Dynamics & Structure
The Mobile NAND Flash market exhibits a highly concentrated structure, dominated by a few key players, with Samsung, SK Hynix, and Micron Technology holding substantial market shares. Technological innovation is the primary driver, with continuous advancements in vertically stacking technology enabling higher storage densities and improved performance, crucial for next-generation smartphones and tablets. The regulatory framework, primarily focused on ensuring data integrity and energy efficiency, indirectly influences product development and adoption. Competitive product substitutes are limited to other forms of non-volatile memory, but NAND Flash maintains its dominance due to its cost-effectiveness and performance characteristics for mobile applications. End-user demographics, characterized by a growing demand for high-capacity storage and seamless mobile experiences, directly fuel market expansion. Mergers and acquisitions (M&A) trends, though less frequent in recent years due to the consolidated nature of the market, remain critical for strategic consolidation and technological integration.
- Market Concentration: The top three players collectively command over 80% of the global market share.
- Technological Innovation Drivers: Focus on 3D NAND scaling (e.g., 200+ layers), improved endurance, and lower power consumption.
- Regulatory Frameworks: Standards related to data security, energy efficiency, and manufacturing compliance.
- Competitive Product Substitutes: Limited direct substitutes for the primary use cases in mobile devices.
- End-User Demographics: Increasing smartphone penetration in emerging economies, demand for 4K/8K video recording, AR/VR applications, and extensive gaming.
- M&A Trends: Strategic partnerships and smaller acquisitions for intellectual property or specific technological capabilities.
Mobile NAND Flash Growth Trends & Insights
The Mobile NAND Flash market is poised for robust growth, driven by the ever-increasing demand for data storage in mobile devices. The market size is projected to expand significantly from an estimated USD 25,000 million in 2025, experiencing a compound annual growth rate (CAGR) of approximately 7.5% during the forecast period of 2025–2033. This growth is underpinned by escalating adoption rates of smartphones and tablets globally, particularly in emerging markets where mobile-first internet access is prevalent. Technological disruptions, such as the advancement of PCIe Gen 5 and beyond for mobile interfaces and the increasing adoption of UFS 4.0 standards, are enabling faster data transfer speeds and improved application performance, further enhancing user experience and driving demand for higher capacity NAND Flash. Consumer behavior shifts, including the proliferation of high-definition content creation and consumption, cloud integration, and the growing popularity of mobile gaming and augmented reality (AR) applications, are fundamentally altering the storage requirements of mobile devices. These factors collectively contribute to a sustained upward trajectory in market penetration for higher-capacity NAND Flash solutions. The historical period from 2019–2024 witnessed steady growth, largely driven by the initial widespread adoption of 3D NAND technology and the increasing storage needs of flagship smartphones. The base year of 2025 stands as a critical inflection point, with projected market revenue of USD 25,000 million. This signifies a substantial leap from the estimated USD 22,500 million in 2024, reflecting a strong growth momentum heading into the forecast period. The shift towards higher storage tiers, such as 256GB, 512GB, and even 1TB options in premium smartphones, is a dominant trend. This move is necessitated by the exponential growth in data generated by consumers, including high-resolution photos and videos, large app installations, and the increasing complexity of mobile operating systems. Furthermore, the burgeoning IoT ecosystem, with its reliance on connected mobile devices for data collection and processing, also presents a supplementary demand driver for Mobile NAND Flash. The continuous innovation in NAND Flash technology, including advancements in planar NAND to 3D NAND and the ongoing efforts to increase layer counts in 3D NAND, directly translates to higher storage densities at competitive price points. This accessibility of greater storage capacity encourages consumers to opt for devices with larger internal storage, thereby fueling the demand for Mobile NAND Flash. The adoption of faster interfaces like UFS (Universal Flash Storage) is also a crucial factor, as it allows the full potential of high-speed NAND Flash to be realized, providing a seamless user experience for demanding applications.
Dominant Regions, Countries, or Segments in Mobile NAND Flash
The Smartphone application segment stands as the undisputed leader, driving the majority of growth and demand within the Mobile NAND Flash market. This dominance is largely attributed to the ubiquitous nature of smartphones, their increasing feature sets, and the growing global user base. Asia Pacific, particularly China and South Korea, represents the dominant region, owing to its robust manufacturing capabilities, significant consumer base, and the presence of major smartphone manufacturers. The increasing adoption of advanced technologies like vertically stacking in NAND Flash production, which allows for higher storage densities crucial for sophisticated smartphone applications such as 4K/8K video recording, AI-powered features, and immersive gaming experiences, further solidifies the smartphone segment's leadership.
- Dominant Segment (Application): Smartphones are the primary demand driver, accounting for an estimated 70% of the total Mobile NAND Flash market.
- Dominant Segment (Type): Vertically Stacking (3D NAND) technology is paramount, enabling higher capacities and performance essential for mobile devices. Its market share within the Mobile NAND Flash type segment is estimated at over 95%.
- Dominant Region: Asia Pacific, driven by China and South Korea, commands an estimated 60% of the global Mobile NAND Flash market share.
- Key Drivers in Asia Pacific:
- Economic Policies: Government initiatives promoting domestic technology manufacturing and R&D.
- Infrastructure Development: Advanced semiconductor manufacturing facilities and robust supply chains.
- Consumer Demand: High disposable income in certain regions and a large, tech-savvy population.
- Leading Manufacturers: Presence of global giants like Samsung, SK Hynix, and Micron Technology, and significant smartphone brands.
- Dominance Factors for Smartphones:
- High Adoption Rates: Global smartphone penetration continues to rise, especially in emerging economies.
- Increasing Storage Needs: Demand for higher resolution media, extensive app usage, and advanced mobile functionalities.
- Technological Integration: Smartphones are central hubs for communication, entertainment, and productivity, requiring ample and fast storage.
- Growth Potential: The smartphone segment is expected to maintain its lead due to ongoing innovation in mobile device capabilities and the continuous need for improved storage solutions. The estimated market share for smartphones within the Mobile NAND Flash market is projected to grow from 70% in 2025 to 75% by 2033.
Mobile NAND Flash Product Landscape
The Mobile NAND Flash product landscape is defined by rapid advancements in density, speed, and power efficiency. Manufacturers are relentlessly pushing the boundaries of vertically stacking technology, with 200+ layer NAND Flash becoming increasingly common, enabling smartphone and tablet manufacturers to offer up to 1TB or more of internal storage. Innovations in photolithography processes are crucial for achieving these multi-layer structures cost-effectively. Performance metrics such as read/write speeds, endurance (TBW - Terabytes Written), and power consumption are key differentiators. Unique selling propositions include higher storage capacities in smaller form factors, faster data access for seamless multitasking and media handling, and improved power efficiency to extend battery life in mobile devices.
Key Drivers, Barriers & Challenges in Mobile NAND Flash
The Mobile NAND Flash market is propelled by the relentless demand for increased storage capacity in mobile devices, driven by the proliferation of high-resolution content, sophisticated applications, and the expansion of mobile gaming. Technological advancements, particularly in 3D NAND scaling, continue to be a primary growth accelerator. Furthermore, the growing adoption of smartphones and tablets in emerging economies contributes significantly to market expansion.
- Key Drivers:
- Data Consumption Growth: Proliferation of 4K/8K video, social media, and cloud services.
- Advanced Mobile Features: AI, AR/VR, and demanding mobile gaming requiring higher storage.
- Emerging Market Penetration: Increasing smartphone adoption in developing regions.
- Technological Innovation: Continuous improvements in 3D NAND layer counts and performance.
Key challenges include the intense price competition among manufacturers, leading to shrinking profit margins. Supply chain disruptions, exacerbated by geopolitical factors and raw material availability, pose a significant threat to production volumes and pricing stability. The high capital expenditure required for R&D and manufacturing of advanced NAND Flash technology also presents a substantial barrier to entry for new players. Regulatory compliance regarding environmental impact and data security adds complexity to operations.
- Key Barriers & Challenges:
- Price Volatility & Competition: Intense market competition driving down prices.
- Supply Chain Disruptions: Geopolitical risks, raw material shortages, and logistics issues.
- High R&D & CAPEX: Significant investment required for advanced technology development and manufacturing.
- Technological Obsolescence: Rapid pace of innovation necessitates continuous investment to stay competitive.
- Environmental Regulations: Increasing scrutiny on manufacturing processes and waste management.
Emerging Opportunities in Mobile NAND Flash
Emerging opportunities lie in the continued advancement of vertically stacking technology, enabling even higher densities beyond current projections, catering to future demands for extended reality (XR) applications and sophisticated on-device AI processing. The increasing integration of NAND Flash in wearables and other connected IoT devices, beyond traditional smartphones and tablets, presents a new frontier for market expansion. Furthermore, the development of more power-efficient NAND Flash solutions will be crucial for the burgeoning segment of battery-powered mobile devices and wearables.
- Untapped Markets: Expansion into burgeoning markets with increasing smartphone penetration.
- Innovative Applications: Support for advanced mobile gaming, AR/VR, and on-device AI processing.
- Evolving Consumer Preferences: Demand for seamless multitasking, faster app loading, and efficient content creation/consumption.
Growth Accelerators in the Mobile NAND Flash Industry
The Mobile NAND Flash industry's long-term growth is significantly accelerated by ongoing technological breakthroughs in 3D NAND architecture, enabling a sustained increase in storage density and performance at more accessible price points. Strategic partnerships between NAND Flash manufacturers and leading mobile device brands are crucial for co-development and ensuring market readiness for next-generation storage solutions. Market expansion strategies, focusing on penetrating emerging economies with tailored product offerings and competitive pricing, are vital for capturing new user bases and driving overall demand.
Key Players Shaping the Mobile NAND Flash Market
- Intel
- Micron Technology
- Samsung
- SK Hynix
- SanDisk
- Toshiba
Notable Milestones in Mobile NAND Flash Sector
- 2019: Introduction of 100+ layer 3D NAND Flash, significantly increasing storage density.
- 2020: Widespread adoption of UFS 3.1 standard, enabling faster data transfer rates in smartphones.
- 2021: Major advancements in 176-layer NAND Flash technology by key manufacturers.
- 2022: Initial commercialization of QLC (Quad-Level Cell) NAND Flash for high-capacity mobile applications.
- 2023: Focus on enhancing endurance and power efficiency of 3D NAND for next-generation devices.
- 2024: Continued push towards 200+ layer NAND Flash, setting the stage for 1TB+ storage in mainstream devices.
In-Depth Mobile NAND Flash Market Outlook
The Mobile NAND Flash market outlook is exceptionally promising, driven by an unwavering consumer appetite for data-rich mobile experiences and continuous technological innovation. The increasing sophistication of smartphones, the expansion of 5G networks, and the growing adoption of AI and AR/VR applications will necessitate ever-larger and faster storage capacities. Strategic collaborations between manufacturers and device makers, coupled with aggressive R&D in next-generation NAND Flash technologies like PLC (Penta-Level Cell) and beyond, will continue to redefine performance benchmarks. Emerging markets present significant untapped potential, ensuring sustained global demand. The industry is poised for continued growth, with Mobile NAND Flash remaining an indispensable component of the modern digital ecosystem.
Mobile NAND Flash Segmentation
-
1. Application
- 1.1. Smartphones
- 1.2. Tablets
- 1.3. Audio Players
- 1.4. Digital Still Cameras (DSCs)
-
2. Types
- 2.1. Vertically Stacking
- 2.2. Photolithography
Mobile NAND Flash Segmentation By Geography
-
1. North America
- 1.1. United States
- 1.2. Canada
- 1.3. Mexico
-
2. South America
- 2.1. Brazil
- 2.2. Argentina
- 2.3. Rest of South America
-
3. Europe
- 3.1. United Kingdom
- 3.2. Germany
- 3.3. France
- 3.4. Italy
- 3.5. Spain
- 3.6. Russia
- 3.7. Benelux
- 3.8. Nordics
- 3.9. Rest of Europe
-
4. Middle East & Africa
- 4.1. Turkey
- 4.2. Israel
- 4.3. GCC
- 4.4. North Africa
- 4.5. South Africa
- 4.6. Rest of Middle East & Africa
-
5. Asia Pacific
- 5.1. China
- 5.2. India
- 5.3. Japan
- 5.4. South Korea
- 5.5. ASEAN
- 5.6. Oceania
- 5.7. Rest of Asia Pacific
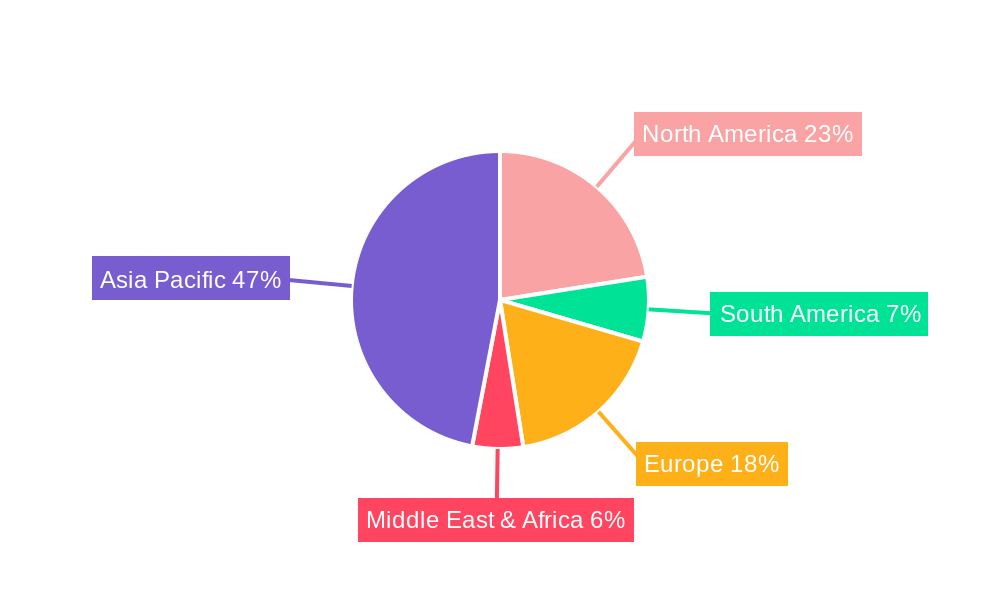
Mobile NAND Flash Regional Market Share
Geographic Coverage of Mobile NAND Flash
Mobile NAND Flash REPORT HIGHLIGHTS
| Aspects | Details |
|---|---|
| Study Period | 2020-2034 |
| Base Year | 2025 |
| Estimated Year | 2026 |
| Forecast Period | 2026-2034 |
| Historical Period | 2020-2025 |
| Growth Rate | CAGR of 23.8% from 2020-2034 |
| Segmentation |
|
Table of Contents
- 1. Introduction
- 1.1. Research Scope
- 1.2. Market Segmentation
- 1.3. Research Objective
- 1.4. Definitions and Assumptions
- 2. Executive Summary
- 2.1. Market Snapshot
- 3. Market Dynamics
- 3.1. Market Drivers
- 3.2. Market Restrains
- 3.3. Market Trends
- 3.4. Market Opportunities
- 4. Market Factor Analysis
- 4.1. Porters Five Forces
- 4.1.1. Bargaining Power of Suppliers
- 4.1.2. Bargaining Power of Buyers
- 4.1.3. Threat of New Entrants
- 4.1.4. Threat of Substitutes
- 4.1.5. Competitive Rivalry
- 4.2. PESTEL analysis
- 4.3. BCG Analysis
- 4.3.1. Stars (High Growth, High Market Share)
- 4.3.2. Cash Cows (Low Growth, High Market Share)
- 4.3.3. Question Mark (High Growth, Low Market Share)
- 4.3.4. Dogs (Low Growth, Low Market Share)
- 4.4. Ansoff Matrix Analysis
- 4.5. Supply Chain Analysis
- 4.6. Regulatory Landscape
- 4.7. Current Market Potential and Opportunity Assessment (TAM–SAM–SOM Framework)
- 4.8. NRP Analyst Note
- 4.1. Porters Five Forces
- 5. Market Analysis, Insights and Forecast 2021-2033
- 5.1. Market Analysis, Insights and Forecast - by Application
- 5.1.1. Smartphones
- 5.1.2. Tablets
- 5.1.3. Audio Players
- 5.1.4. Digital Still Cameras (DSCs)
- 5.2. Market Analysis, Insights and Forecast - by Types
- 5.2.1. Vertically Stacking
- 5.2.2. Photolithography
- 5.3. Market Analysis, Insights and Forecast - by Region
- 5.3.1. North America
- 5.3.2. South America
- 5.3.3. Europe
- 5.3.4. Middle East & Africa
- 5.3.5. Asia Pacific
- 5.1. Market Analysis, Insights and Forecast - by Application
- 6. Global Mobile NAND Flash Analysis, Insights and Forecast, 2021-2033
- 6.1. Market Analysis, Insights and Forecast - by Application
- 6.1.1. Smartphones
- 6.1.2. Tablets
- 6.1.3. Audio Players
- 6.1.4. Digital Still Cameras (DSCs)
- 6.2. Market Analysis, Insights and Forecast - by Types
- 6.2.1. Vertically Stacking
- 6.2.2. Photolithography
- 6.1. Market Analysis, Insights and Forecast - by Application
- 7. North America Mobile NAND Flash Analysis, Insights and Forecast, 2020-2032
- 7.1. Market Analysis, Insights and Forecast - by Application
- 7.1.1. Smartphones
- 7.1.2. Tablets
- 7.1.3. Audio Players
- 7.1.4. Digital Still Cameras (DSCs)
- 7.2. Market Analysis, Insights and Forecast - by Types
- 7.2.1. Vertically Stacking
- 7.2.2. Photolithography
- 7.1. Market Analysis, Insights and Forecast - by Application
- 8. South America Mobile NAND Flash Analysis, Insights and Forecast, 2020-2032
- 8.1. Market Analysis, Insights and Forecast - by Application
- 8.1.1. Smartphones
- 8.1.2. Tablets
- 8.1.3. Audio Players
- 8.1.4. Digital Still Cameras (DSCs)
- 8.2. Market Analysis, Insights and Forecast - by Types
- 8.2.1. Vertically Stacking
- 8.2.2. Photolithography
- 8.1. Market Analysis, Insights and Forecast - by Application
- 9. Europe Mobile NAND Flash Analysis, Insights and Forecast, 2020-2032
- 9.1. Market Analysis, Insights and Forecast - by Application
- 9.1.1. Smartphones
- 9.1.2. Tablets
- 9.1.3. Audio Players
- 9.1.4. Digital Still Cameras (DSCs)
- 9.2. Market Analysis, Insights and Forecast - by Types
- 9.2.1. Vertically Stacking
- 9.2.2. Photolithography
- 9.1. Market Analysis, Insights and Forecast - by Application
- 10. Middle East & Africa Mobile NAND Flash Analysis, Insights and Forecast, 2020-2032
- 10.1. Market Analysis, Insights and Forecast - by Application
- 10.1.1. Smartphones
- 10.1.2. Tablets
- 10.1.3. Audio Players
- 10.1.4. Digital Still Cameras (DSCs)
- 10.2. Market Analysis, Insights and Forecast - by Types
- 10.2.1. Vertically Stacking
- 10.2.2. Photolithography
- 10.1. Market Analysis, Insights and Forecast - by Application
- 11. Asia Pacific Mobile NAND Flash Analysis, Insights and Forecast, 2020-2032
- 11.1. Market Analysis, Insights and Forecast - by Application
- 11.1.1. Smartphones
- 11.1.2. Tablets
- 11.1.3. Audio Players
- 11.1.4. Digital Still Cameras (DSCs)
- 11.2. Market Analysis, Insights and Forecast - by Types
- 11.2.1. Vertically Stacking
- 11.2.2. Photolithography
- 11.1. Market Analysis, Insights and Forecast - by Application
- 12. Competitive Analysis
- 12.1. Company Profiles
- 12.1.1 Intel
- 12.1.1.1. Company Overview
- 12.1.1.2. Products
- 12.1.1.3. Company Financials
- 12.1.1.4. SWOT Analysis
- 12.1.2 Micron Technology
- 12.1.2.1. Company Overview
- 12.1.2.2. Products
- 12.1.2.3. Company Financials
- 12.1.2.4. SWOT Analysis
- 12.1.3 Samsung
- 12.1.3.1. Company Overview
- 12.1.3.2. Products
- 12.1.3.3. Company Financials
- 12.1.3.4. SWOT Analysis
- 12.1.4 SK Hynix
- 12.1.4.1. Company Overview
- 12.1.4.2. Products
- 12.1.4.3. Company Financials
- 12.1.4.4. SWOT Analysis
- 12.1.5 SanDisk
- 12.1.5.1. Company Overview
- 12.1.5.2. Products
- 12.1.5.3. Company Financials
- 12.1.5.4. SWOT Analysis
- 12.1.6 Toshiba
- 12.1.6.1. Company Overview
- 12.1.6.2. Products
- 12.1.6.3. Company Financials
- 12.1.6.4. SWOT Analysis
- 12.1.7 SK Hynix
- 12.1.7.1. Company Overview
- 12.1.7.2. Products
- 12.1.7.3. Company Financials
- 12.1.7.4. SWOT Analysis
- 12.1.8 Micron
- 12.1.8.1. Company Overview
- 12.1.8.2. Products
- 12.1.8.3. Company Financials
- 12.1.8.4. SWOT Analysis
- 12.1.1 Intel
- 12.2. Market Entropy
- 12.2.1 Company's Key Areas Served
- 12.2.2 Recent Developments
- 12.3. Company Market Share Analysis 2025
- 12.3.1 Top 5 Companies Market Share Analysis
- 12.3.2 Top 3 Companies Market Share Analysis
- 12.4. List of Potential Customers
- 13. Research Methodology
List of Figures
- Figure 1: Global Mobile NAND Flash Revenue Breakdown (billion, %) by Region 2025 & 2033
- Figure 2: North America Mobile NAND Flash Revenue (billion), by Application 2025 & 2033
- Figure 3: North America Mobile NAND Flash Revenue Share (%), by Application 2025 & 2033
- Figure 4: North America Mobile NAND Flash Revenue (billion), by Types 2025 & 2033
- Figure 5: North America Mobile NAND Flash Revenue Share (%), by Types 2025 & 2033
- Figure 6: North America Mobile NAND Flash Revenue (billion), by Country 2025 & 2033
- Figure 7: North America Mobile NAND Flash Revenue Share (%), by Country 2025 & 2033
- Figure 8: South America Mobile NAND Flash Revenue (billion), by Application 2025 & 2033
- Figure 9: South America Mobile NAND Flash Revenue Share (%), by Application 2025 & 2033
- Figure 10: South America Mobile NAND Flash Revenue (billion), by Types 2025 & 2033
- Figure 11: South America Mobile NAND Flash Revenue Share (%), by Types 2025 & 2033
- Figure 12: South America Mobile NAND Flash Revenue (billion), by Country 2025 & 2033
- Figure 13: South America Mobile NAND Flash Revenue Share (%), by Country 2025 & 2033
- Figure 14: Europe Mobile NAND Flash Revenue (billion), by Application 2025 & 2033
- Figure 15: Europe Mobile NAND Flash Revenue Share (%), by Application 2025 & 2033
- Figure 16: Europe Mobile NAND Flash Revenue (billion), by Types 2025 & 2033
- Figure 17: Europe Mobile NAND Flash Revenue Share (%), by Types 2025 & 2033
- Figure 18: Europe Mobile NAND Flash Revenue (billion), by Country 2025 & 2033
- Figure 19: Europe Mobile NAND Flash Revenue Share (%), by Country 2025 & 2033
- Figure 20: Middle East & Africa Mobile NAND Flash Revenue (billion), by Application 2025 & 2033
- Figure 21: Middle East & Africa Mobile NAND Flash Revenue Share (%), by Application 2025 & 2033
- Figure 22: Middle East & Africa Mobile NAND Flash Revenue (billion), by Types 2025 & 2033
- Figure 23: Middle East & Africa Mobile NAND Flash Revenue Share (%), by Types 2025 & 2033
- Figure 24: Middle East & Africa Mobile NAND Flash Revenue (billion), by Country 2025 & 2033
- Figure 25: Middle East & Africa Mobile NAND Flash Revenue Share (%), by Country 2025 & 2033
- Figure 26: Asia Pacific Mobile NAND Flash Revenue (billion), by Application 2025 & 2033
- Figure 27: Asia Pacific Mobile NAND Flash Revenue Share (%), by Application 2025 & 2033
- Figure 28: Asia Pacific Mobile NAND Flash Revenue (billion), by Types 2025 & 2033
- Figure 29: Asia Pacific Mobile NAND Flash Revenue Share (%), by Types 2025 & 2033
- Figure 30: Asia Pacific Mobile NAND Flash Revenue (billion), by Country 2025 & 2033
- Figure 31: Asia Pacific Mobile NAND Flash Revenue Share (%), by Country 2025 & 2033
List of Tables
- Table 1: Global Mobile NAND Flash Revenue billion Forecast, by Application 2020 & 2033
- Table 2: Global Mobile NAND Flash Revenue billion Forecast, by Types 2020 & 2033
- Table 3: Global Mobile NAND Flash Revenue billion Forecast, by Region 2020 & 2033
- Table 4: Global Mobile NAND Flash Revenue billion Forecast, by Application 2020 & 2033
- Table 5: Global Mobile NAND Flash Revenue billion Forecast, by Types 2020 & 2033
- Table 6: Global Mobile NAND Flash Revenue billion Forecast, by Country 2020 & 2033
- Table 7: United States Mobile NAND Flash Revenue (billion) Forecast, by Application 2020 & 2033
- Table 8: Canada Mobile NAND Flash Revenue (billion) Forecast, by Application 2020 & 2033
- Table 9: Mexico Mobile NAND Flash Revenue (billion) Forecast, by Application 2020 & 2033
- Table 10: Global Mobile NAND Flash Revenue billion Forecast, by Application 2020 & 2033
- Table 11: Global Mobile NAND Flash Revenue billion Forecast, by Types 2020 & 2033
- Table 12: Global Mobile NAND Flash Revenue billion Forecast, by Country 2020 & 2033
- Table 13: Brazil Mobile NAND Flash Revenue (billion) Forecast, by Application 2020 & 2033
- Table 14: Argentina Mobile NAND Flash Revenue (billion) Forecast, by Application 2020 & 2033
- Table 15: Rest of South America Mobile NAND Flash Revenue (billion) Forecast, by Application 2020 & 2033
- Table 16: Global Mobile NAND Flash Revenue billion Forecast, by Application 2020 & 2033
- Table 17: Global Mobile NAND Flash Revenue billion Forecast, by Types 2020 & 2033
- Table 18: Global Mobile NAND Flash Revenue billion Forecast, by Country 2020 & 2033
- Table 19: United Kingdom Mobile NAND Flash Revenue (billion) Forecast, by Application 2020 & 2033
- Table 20: Germany Mobile NAND Flash Revenue (billion) Forecast, by Application 2020 & 2033
- Table 21: France Mobile NAND Flash Revenue (billion) Forecast, by Application 2020 & 2033
- Table 22: Italy Mobile NAND Flash Revenue (billion) Forecast, by Application 2020 & 2033
- Table 23: Spain Mobile NAND Flash Revenue (billion) Forecast, by Application 2020 & 2033
- Table 24: Russia Mobile NAND Flash Revenue (billion) Forecast, by Application 2020 & 2033
- Table 25: Benelux Mobile NAND Flash Revenue (billion) Forecast, by Application 2020 & 2033
- Table 26: Nordics Mobile NAND Flash Revenue (billion) Forecast, by Application 2020 & 2033
- Table 27: Rest of Europe Mobile NAND Flash Revenue (billion) Forecast, by Application 2020 & 2033
- Table 28: Global Mobile NAND Flash Revenue billion Forecast, by Application 2020 & 2033
- Table 29: Global Mobile NAND Flash Revenue billion Forecast, by Types 2020 & 2033
- Table 30: Global Mobile NAND Flash Revenue billion Forecast, by Country 2020 & 2033
- Table 31: Turkey Mobile NAND Flash Revenue (billion) Forecast, by Application 2020 & 2033
- Table 32: Israel Mobile NAND Flash Revenue (billion) Forecast, by Application 2020 & 2033
- Table 33: GCC Mobile NAND Flash Revenue (billion) Forecast, by Application 2020 & 2033
- Table 34: North Africa Mobile NAND Flash Revenue (billion) Forecast, by Application 2020 & 2033
- Table 35: South Africa Mobile NAND Flash Revenue (billion) Forecast, by Application 2020 & 2033
- Table 36: Rest of Middle East & Africa Mobile NAND Flash Revenue (billion) Forecast, by Application 2020 & 2033
- Table 37: Global Mobile NAND Flash Revenue billion Forecast, by Application 2020 & 2033
- Table 38: Global Mobile NAND Flash Revenue billion Forecast, by Types 2020 & 2033
- Table 39: Global Mobile NAND Flash Revenue billion Forecast, by Country 2020 & 2033
- Table 40: China Mobile NAND Flash Revenue (billion) Forecast, by Application 2020 & 2033
- Table 41: India Mobile NAND Flash Revenue (billion) Forecast, by Application 2020 & 2033
- Table 42: Japan Mobile NAND Flash Revenue (billion) Forecast, by Application 2020 & 2033
- Table 43: South Korea Mobile NAND Flash Revenue (billion) Forecast, by Application 2020 & 2033
- Table 44: ASEAN Mobile NAND Flash Revenue (billion) Forecast, by Application 2020 & 2033
- Table 45: Oceania Mobile NAND Flash Revenue (billion) Forecast, by Application 2020 & 2033
- Table 46: Rest of Asia Pacific Mobile NAND Flash Revenue (billion) Forecast, by Application 2020 & 2033
Frequently Asked Questions
1. What is the projected Compound Annual Growth Rate (CAGR) of the Mobile NAND Flash?
The projected CAGR is approximately 23.8%.
2. Which companies are prominent players in the Mobile NAND Flash?
Key companies in the market include Intel, Micron Technology, Samsung, SK Hynix, SanDisk, Toshiba, SK Hynix, Micron.
3. What are the main segments of the Mobile NAND Flash?
The market segments include Application, Types.
4. Can you provide details about the market size?
The market size is estimated to be USD 31.5 billion as of 2022.
5. What are some drivers contributing to market growth?
N/A
6. What are the notable trends driving market growth?
N/A
7. Are there any restraints impacting market growth?
N/A
8. Can you provide examples of recent developments in the market?
N/A
9. What pricing options are available for accessing the report?
Pricing options include single-user, multi-user, and enterprise licenses priced at USD 2900.00, USD 4350.00, and USD 5800.00 respectively.
10. Is the market size provided in terms of value or volume?
The market size is provided in terms of value, measured in billion.
11. Are there any specific market keywords associated with the report?
Yes, the market keyword associated with the report is "Mobile NAND Flash," which aids in identifying and referencing the specific market segment covered.
12. How do I determine which pricing option suits my needs best?
The pricing options vary based on user requirements and access needs. Individual users may opt for single-user licenses, while businesses requiring broader access may choose multi-user or enterprise licenses for cost-effective access to the report.
13. Are there any additional resources or data provided in the Mobile NAND Flash report?
While the report offers comprehensive insights, it's advisable to review the specific contents or supplementary materials provided to ascertain if additional resources or data are available.
14. How can I stay updated on further developments or reports in the Mobile NAND Flash?
To stay informed about further developments, trends, and reports in the Mobile NAND Flash, consider subscribing to industry newsletters, following relevant companies and organizations, or regularly checking reputable industry news sources and publications.
Methodology
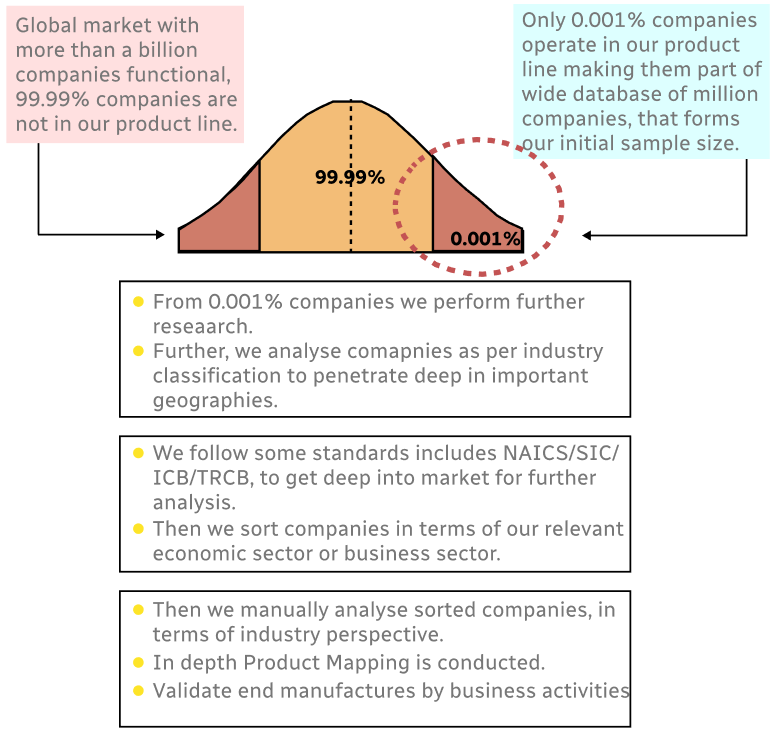
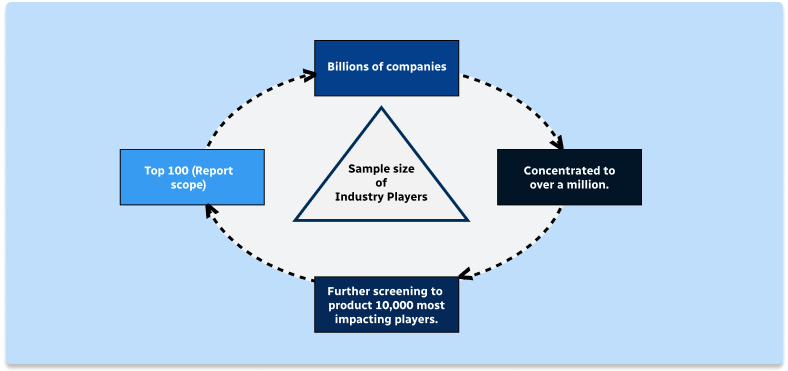
Step 1 - Identification of Relevant Samples Size from Population Database
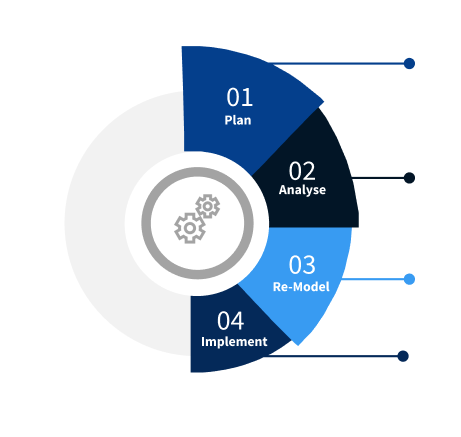
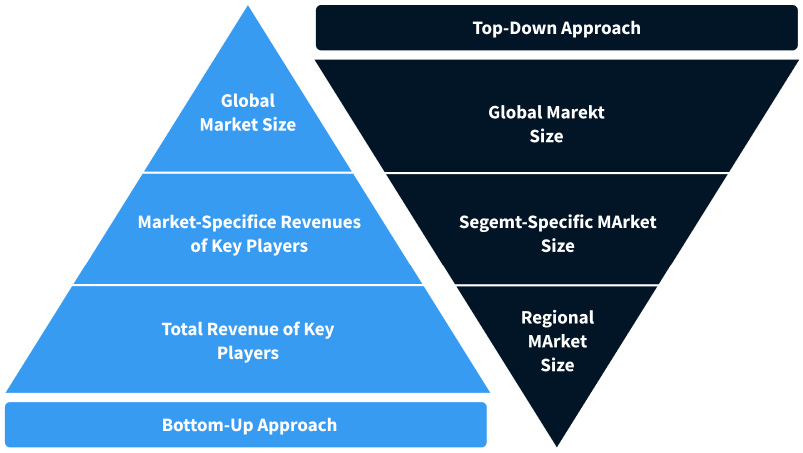
Step 2 - Approaches for Defining Global Market Size (Value, Volume* & Price*)
Note*: In applicable scenarios
Step 3 - Data Sources
Primary Research
- Web Analytics
- Survey Reports
- Research Institute
- Latest Research Reports
- Opinion Leaders
Secondary Research
- Annual Reports
- White Paper
- Latest Press Release
- Industry Association
- Paid Database
- Investor Presentations
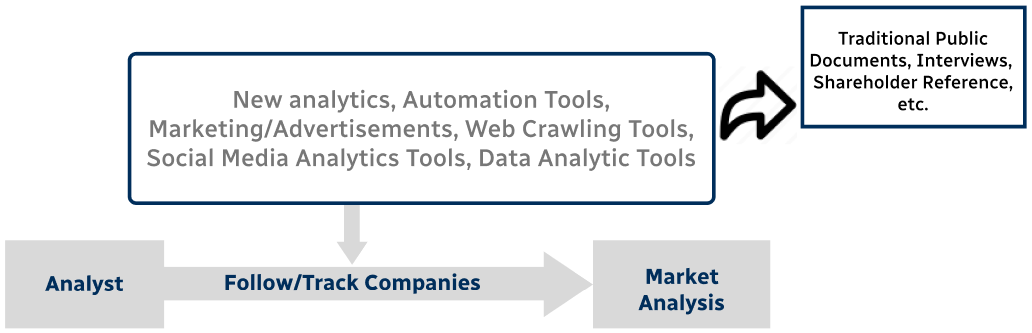
Step 4 - Data Triangulation
Involves using different sources of information in order to increase the validity of a study
These sources are likely to be stakeholders in a program - participants, other researchers, program staff, other community members, and so on.
Then we put all data in single framework & apply various statistical tools to find out the dynamic on the market.
During the analysis stage, feedback from the stakeholder groups would be compared to determine areas of agreement as well as areas of divergence