

Key Insights
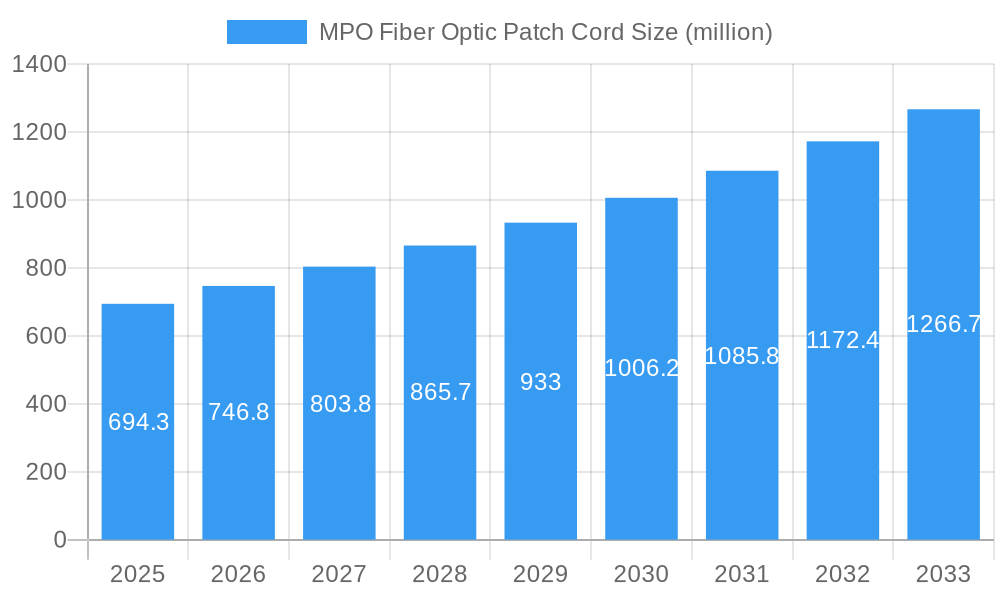
The MPO fiber optic patch cord market, valued at $694.3 million in 2025, is experiencing robust growth, projected to expand at a compound annual growth rate (CAGR) of 7.6% from 2025 to 2033. This growth is fueled by the increasing adoption of high-density fiber optic cabling in data centers and telecommunications infrastructure. The rising demand for higher bandwidth and faster data transmission speeds, particularly in 5G networks and cloud computing environments, is a significant driver. Furthermore, the trend toward miniaturization and space optimization in data centers is creating a preference for MPO connectors over traditional single-fiber solutions. Leading players like Amphenol, Belden, Siemon, and Molex are actively driving innovation and expanding their product portfolios to meet the escalating market demand, fostering healthy competition and technological advancements. However, potential restraints include the higher initial investment costs compared to traditional fiber optic solutions and the complexity of installation and maintenance.
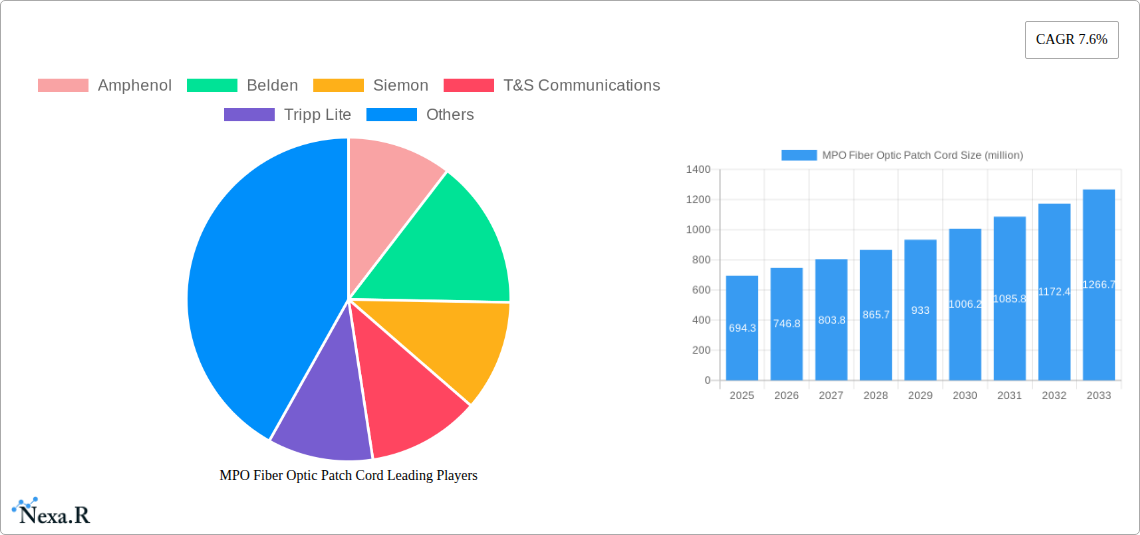
MPO Fiber Optic Patch Cord Market Size (In Million)
The market segmentation, while not explicitly detailed, likely includes various fiber counts (e.g., 8-fiber, 12-fiber, 24-fiber MPO cords), connector types (e.g., MPO-MPO, MPO-LC), and cable types (e.g., OM3, OM4, OM5). Regional variations in adoption rates are expected, with North America and Europe likely representing significant market shares. The forecast period (2025-2033) suggests continued market expansion, driven by ongoing technological advancements and the persistent need for high-bandwidth connectivity solutions. Future growth will be shaped by the evolution of data center architectures, the deployment of next-generation network technologies, and the ongoing need for enhanced network reliability and scalability. The competitive landscape remains dynamic, with established players and emerging companies vying for market share through product differentiation, strategic partnerships, and technological innovation.
MPO Fiber Optic Patch Cord Company Market Share
MPO Fiber Optic Patch Cord Market Report: 2019-2033
This comprehensive report provides a detailed analysis of the global MPO Fiber Optic Patch Cord market, covering the period from 2019 to 2033. It offers invaluable insights for industry professionals, investors, and strategic decision-makers seeking to understand the market dynamics, growth trends, and future potential of this rapidly evolving sector. The report meticulously analyzes the parent market (Fiber Optic Cables and Connectors) and the child market (High-Density Fiber Optic Interconnects) to provide a holistic view. The total market size in 2025 is estimated at xx million units, with a projected value of xx million units by 2033.
Study Period: 2019–2033 Base Year: 2025 Estimated Year: 2025 Forecast Period: 2025–2033 Historical Period: 2019–2024
MPO Fiber Optic Patch Cord Market Dynamics & Structure
This section delves into the intricate structure of the MPO Fiber Optic Patch Cord market, examining its concentration, technological advancements, regulatory landscape, competitive dynamics, and end-user trends. We analyze market share distribution among key players, the impact of mergers and acquisitions (M&A), and the influence of technological innovation on market growth.
- Market Concentration: The market is moderately concentrated, with the top 5 players holding an estimated xx% market share in 2025. This is expected to slightly decrease to xx% by 2033 due to increased competition from smaller players.
- Technological Innovation: Advancements in fiber optic technology, including the development of higher density connectors and improved manufacturing processes, are key drivers of market growth. The emergence of 400G and 800G transmission speeds is accelerating adoption.
- Regulatory Frameworks: Government initiatives promoting high-speed internet infrastructure and data center development are creating favorable conditions for market expansion. Regional variations in regulations, however, present challenges for some players.
- Competitive Product Substitutes: While MPO connectors are the dominant technology, competition exists from other high-density connectors, impacting market share distribution within the high-density fiber optic interconnect segment.
- End-User Demographics: Data centers, telecommunication companies, and enterprise networks are the primary end-users, with data center deployments representing the largest segment, driving significant demand.
- M&A Trends: The past five years witnessed xx M&A deals within the industry, primarily focused on consolidating market share and expanding product portfolios. This trend is expected to continue, albeit at a slightly slower pace. The average deal size was approximately xx million USD. Innovation barriers include high R&D costs and the need for specialized manufacturing expertise.
MPO Fiber Optic Patch Cord Growth Trends & Insights
This section utilizes a proprietary analytical methodology (XXX) to provide a detailed analysis of market size evolution, adoption rates, technological disruptions, and shifts in consumer behavior.
The MPO Fiber Optic Patch Cord market experienced significant growth during the historical period (2019-2024), with a CAGR of xx%. This growth is attributed to the increasing demand for high-bandwidth connectivity in data centers and telecommunication networks. The market is expected to maintain a strong growth trajectory during the forecast period (2025-2033), driven by the proliferation of 5G networks and the rising adoption of cloud computing. Market penetration in key regions is expected to increase significantly, with the highest growth rates projected for [Region Name], followed by [Region Name] and [Region Name]. Technological disruptions, such as the adoption of silicon photonics and advancements in coherent optical transmission, are expected to further fuel market expansion. Consumer behavior is shifting towards higher density and more reliable solutions, favoring MPO connectors over traditional fiber optic technologies.
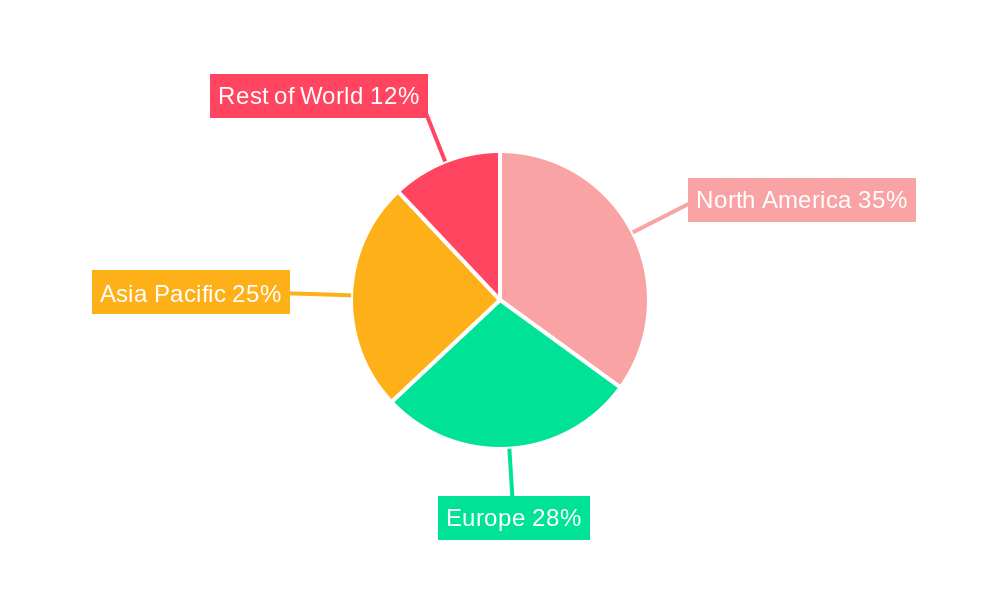
Dominant Regions, Countries, or Segments in MPO Fiber Optic Patch Cord
North America currently holds the largest market share in the MPO Fiber Optic Patch Cord market due to the high concentration of data centers and telecommunication infrastructure. However, Asia-Pacific is projected to experience the fastest growth rate during the forecast period.
- Key Drivers in North America: Strong investments in data center infrastructure, robust telecommunication networks, and favorable government policies supporting technological advancements.
- Key Drivers in Asia-Pacific: Rapid growth in data consumption, increasing demand for high-speed internet access, and significant investments in 5G network deployments.
- Market Share and Growth Potential: North America currently holds xx% market share (2025), with Asia-Pacific projected to reach xx% by 2033. Europe is expected to maintain a stable market share of approximately xx% throughout the forecast period.
MPO Fiber Optic Patch Cord Product Landscape
MPO fiber optic patch cords are available in various configurations, including different fiber counts (e.g., 8, 12, 24), cable types (e.g., OM3, OM4, OM5), and connector types. Recent innovations focus on improving performance metrics, such as attenuation and return loss, while simultaneously reducing costs and simplifying installation. Unique selling propositions often include improved durability, enhanced signal integrity, and streamlined management of high-density fiber optic deployments. Technological advancements include the integration of advanced polishing techniques and the use of high-quality materials to meet the demands of high-bandwidth applications.
Key Drivers, Barriers & Challenges in MPO Fiber Optic Patch Cord
Key Drivers:
- The increasing adoption of high-speed data transmission technologies (400G, 800G) is driving demand.
- The expansion of data centers and cloud computing infrastructure fuels market growth.
- Government initiatives promoting digital infrastructure development create favorable conditions.
Key Challenges and Restraints:
- The cost of MPO connectors can be higher than traditional fiber optic solutions. This represents an approximate xx% cost premium in initial investment, impacting smaller companies’ adoption.
- Supply chain disruptions can affect product availability and lead times.
- Intense competition from established and emerging players poses a challenge to market share retention.
Emerging Opportunities in MPO Fiber Optic Patch Cord
- Untapped markets in developing economies present significant growth opportunities.
- The integration of MPO connectors in new applications, such as industrial automation and automotive technologies, expands market reach.
- Growing demand for sustainable and environmentally friendly solutions opens avenues for innovation in manufacturing and materials.
Growth Accelerators in the MPO Fiber Optic Patch Cord Industry
Technological advancements, strategic alliances, and market expansion into emerging economies are key catalysts driving long-term growth. The development of cost-effective manufacturing processes and the introduction of innovative connector designs will further contribute to market expansion. The adoption of new standards and protocols in data transmission will also accelerate adoption and demand.
Key Players Shaping the MPO Fiber Optic Patch Cord Market
- Amphenol
- Belden
- Siemon
- T&S Communications
- Tripp Lite
- Sumitomo Electric
- Furukawa
- Suzhou Agix
- Molex
- Panduit
- AVIC Jonhon Optronic
- TFC
- Longxing
- LEAD Fiber Optics
Notable Milestones in MPO Fiber Optic Patch Cord Sector
- 2020, Q4: Introduction of a new, higher-density MPO connector by [Company Name].
- 2021, Q2: Strategic partnership between [Company Name] and [Company Name] to develop next-generation MPO technology.
- 2022, Q3: Acquisition of [Company Name] by [Company Name], expanding market reach and product portfolio.
In-Depth MPO Fiber Optic Patch Cord Market Outlook
The MPO Fiber Optic Patch Cord market is poised for continued growth, fueled by ongoing technological advancements and increasing demand from key end-user segments. Strategic partnerships, aggressive R&D initiatives, and effective market penetration strategies will be critical for success in this dynamic market. The development of sustainable and environmentally conscious solutions will create significant differentiation opportunities. The market presents substantial opportunities for players focusing on innovation and adapting to evolving technological landscapes.
MPO Fiber Optic Patch Cord Segmentation
-
1. Application
- 1.1. Data Centers
- 1.2. Telecommunications
- 1.3. Military/Aerospace
- 1.4. Others
-
2. Types
- 2.1. Single-mode
- 2.2. Multimode
MPO Fiber Optic Patch Cord Segmentation By Geography
-
1. North America
- 1.1. United States
- 1.2. Canada
- 1.3. Mexico
-
2. South America
- 2.1. Brazil
- 2.2. Argentina
- 2.3. Rest of South America
-
3. Europe
- 3.1. United Kingdom
- 3.2. Germany
- 3.3. France
- 3.4. Italy
- 3.5. Spain
- 3.6. Russia
- 3.7. Benelux
- 3.8. Nordics
- 3.9. Rest of Europe
-
4. Middle East & Africa
- 4.1. Turkey
- 4.2. Israel
- 4.3. GCC
- 4.4. North Africa
- 4.5. South Africa
- 4.6. Rest of Middle East & Africa
-
5. Asia Pacific
- 5.1. China
- 5.2. India
- 5.3. Japan
- 5.4. South Korea
- 5.5. ASEAN
- 5.6. Oceania
- 5.7. Rest of Asia Pacific
MPO Fiber Optic Patch Cord Regional Market Share
Geographic Coverage of MPO Fiber Optic Patch Cord
MPO Fiber Optic Patch Cord REPORT HIGHLIGHTS
| Aspects | Details |
|---|---|
| Study Period | 2020-2034 |
| Base Year | 2025 |
| Estimated Year | 2026 |
| Forecast Period | 2026-2034 |
| Historical Period | 2020-2025 |
| Growth Rate | CAGR of 4.1% from 2020-2034 |
| Segmentation |
|
Table of Contents
- 1. Introduction
- 1.1. Research Scope
- 1.2. Market Segmentation
- 1.3. Research Objective
- 1.4. Definitions and Assumptions
- 2. Executive Summary
- 2.1. Market Snapshot
- 3. Market Dynamics
- 3.1. Market Drivers
- 3.2. Market Restrains
- 3.3. Market Trends
- 3.4. Market Opportunities
- 4. Market Factor Analysis
- 4.1. Porters Five Forces
- 4.1.1. Bargaining Power of Suppliers
- 4.1.2. Bargaining Power of Buyers
- 4.1.3. Threat of New Entrants
- 4.1.4. Threat of Substitutes
- 4.1.5. Competitive Rivalry
- 4.2. PESTEL analysis
- 4.3. BCG Analysis
- 4.3.1. Stars (High Growth, High Market Share)
- 4.3.2. Cash Cows (Low Growth, High Market Share)
- 4.3.3. Question Mark (High Growth, Low Market Share)
- 4.3.4. Dogs (Low Growth, Low Market Share)
- 4.4. Ansoff Matrix Analysis
- 4.5. Supply Chain Analysis
- 4.6. Regulatory Landscape
- 4.7. Current Market Potential and Opportunity Assessment (TAM–SAM–SOM Framework)
- 4.8. NRP Analyst Note
- 4.1. Porters Five Forces
- 5. Market Analysis, Insights and Forecast 2021-2033
- 5.1. Market Analysis, Insights and Forecast - by Application
- 5.1.1. Data Centers
- 5.1.2. Telecommunications
- 5.1.3. Military/Aerospace
- 5.1.4. Others
- 5.2. Market Analysis, Insights and Forecast - by Types
- 5.2.1. Single-mode
- 5.2.2. Multimode
- 5.3. Market Analysis, Insights and Forecast - by Region
- 5.3.1. North America
- 5.3.2. South America
- 5.3.3. Europe
- 5.3.4. Middle East & Africa
- 5.3.5. Asia Pacific
- 5.1. Market Analysis, Insights and Forecast - by Application
- 6. Global MPO Fiber Optic Patch Cord Analysis, Insights and Forecast, 2021-2033
- 6.1. Market Analysis, Insights and Forecast - by Application
- 6.1.1. Data Centers
- 6.1.2. Telecommunications
- 6.1.3. Military/Aerospace
- 6.1.4. Others
- 6.2. Market Analysis, Insights and Forecast - by Types
- 6.2.1. Single-mode
- 6.2.2. Multimode
- 6.1. Market Analysis, Insights and Forecast - by Application
- 7. North America MPO Fiber Optic Patch Cord Analysis, Insights and Forecast, 2020-2032
- 7.1. Market Analysis, Insights and Forecast - by Application
- 7.1.1. Data Centers
- 7.1.2. Telecommunications
- 7.1.3. Military/Aerospace
- 7.1.4. Others
- 7.2. Market Analysis, Insights and Forecast - by Types
- 7.2.1. Single-mode
- 7.2.2. Multimode
- 7.1. Market Analysis, Insights and Forecast - by Application
- 8. South America MPO Fiber Optic Patch Cord Analysis, Insights and Forecast, 2020-2032
- 8.1. Market Analysis, Insights and Forecast - by Application
- 8.1.1. Data Centers
- 8.1.2. Telecommunications
- 8.1.3. Military/Aerospace
- 8.1.4. Others
- 8.2. Market Analysis, Insights and Forecast - by Types
- 8.2.1. Single-mode
- 8.2.2. Multimode
- 8.1. Market Analysis, Insights and Forecast - by Application
- 9. Europe MPO Fiber Optic Patch Cord Analysis, Insights and Forecast, 2020-2032
- 9.1. Market Analysis, Insights and Forecast - by Application
- 9.1.1. Data Centers
- 9.1.2. Telecommunications
- 9.1.3. Military/Aerospace
- 9.1.4. Others
- 9.2. Market Analysis, Insights and Forecast - by Types
- 9.2.1. Single-mode
- 9.2.2. Multimode
- 9.1. Market Analysis, Insights and Forecast - by Application
- 10. Middle East & Africa MPO Fiber Optic Patch Cord Analysis, Insights and Forecast, 2020-2032
- 10.1. Market Analysis, Insights and Forecast - by Application
- 10.1.1. Data Centers
- 10.1.2. Telecommunications
- 10.1.3. Military/Aerospace
- 10.1.4. Others
- 10.2. Market Analysis, Insights and Forecast - by Types
- 10.2.1. Single-mode
- 10.2.2. Multimode
- 10.1. Market Analysis, Insights and Forecast - by Application
- 11. Asia Pacific MPO Fiber Optic Patch Cord Analysis, Insights and Forecast, 2020-2032
- 11.1. Market Analysis, Insights and Forecast - by Application
- 11.1.1. Data Centers
- 11.1.2. Telecommunications
- 11.1.3. Military/Aerospace
- 11.1.4. Others
- 11.2. Market Analysis, Insights and Forecast - by Types
- 11.2.1. Single-mode
- 11.2.2. Multimode
- 11.1. Market Analysis, Insights and Forecast - by Application
- 12. Competitive Analysis
- 12.1. Company Profiles
- 12.1.1 Amphenol
- 12.1.1.1. Company Overview
- 12.1.1.2. Products
- 12.1.1.3. Company Financials
- 12.1.1.4. SWOT Analysis
- 12.1.2 Belden
- 12.1.2.1. Company Overview
- 12.1.2.2. Products
- 12.1.2.3. Company Financials
- 12.1.2.4. SWOT Analysis
- 12.1.3 Siemon
- 12.1.3.1. Company Overview
- 12.1.3.2. Products
- 12.1.3.3. Company Financials
- 12.1.3.4. SWOT Analysis
- 12.1.4 T&S Communications
- 12.1.4.1. Company Overview
- 12.1.4.2. Products
- 12.1.4.3. Company Financials
- 12.1.4.4. SWOT Analysis
- 12.1.5 Tripp Lite
- 12.1.5.1. Company Overview
- 12.1.5.2. Products
- 12.1.5.3. Company Financials
- 12.1.5.4. SWOT Analysis
- 12.1.6 Sumitomo Electric
- 12.1.6.1. Company Overview
- 12.1.6.2. Products
- 12.1.6.3. Company Financials
- 12.1.6.4. SWOT Analysis
- 12.1.7 Furukawa
- 12.1.7.1. Company Overview
- 12.1.7.2. Products
- 12.1.7.3. Company Financials
- 12.1.7.4. SWOT Analysis
- 12.1.8 Suzhou Agix
- 12.1.8.1. Company Overview
- 12.1.8.2. Products
- 12.1.8.3. Company Financials
- 12.1.8.4. SWOT Analysis
- 12.1.9 Molex
- 12.1.9.1. Company Overview
- 12.1.9.2. Products
- 12.1.9.3. Company Financials
- 12.1.9.4. SWOT Analysis
- 12.1.10 Panduit
- 12.1.10.1. Company Overview
- 12.1.10.2. Products
- 12.1.10.3. Company Financials
- 12.1.10.4. SWOT Analysis
- 12.1.11 AVIC Jonhon Optronic
- 12.1.11.1. Company Overview
- 12.1.11.2. Products
- 12.1.11.3. Company Financials
- 12.1.11.4. SWOT Analysis
- 12.1.12 TFC
- 12.1.12.1. Company Overview
- 12.1.12.2. Products
- 12.1.12.3. Company Financials
- 12.1.12.4. SWOT Analysis
- 12.1.13 Longxing
- 12.1.13.1. Company Overview
- 12.1.13.2. Products
- 12.1.13.3. Company Financials
- 12.1.13.4. SWOT Analysis
- 12.1.14 LEAD Fiber Optics
- 12.1.14.1. Company Overview
- 12.1.14.2. Products
- 12.1.14.3. Company Financials
- 12.1.14.4. SWOT Analysis
- 12.1.1 Amphenol
- 12.2. Market Entropy
- 12.2.1 Company's Key Areas Served
- 12.2.2 Recent Developments
- 12.3. Company Market Share Analysis 2025
- 12.3.1 Top 5 Companies Market Share Analysis
- 12.3.2 Top 3 Companies Market Share Analysis
- 12.4. List of Potential Customers
- 13. Research Methodology
List of Figures
- Figure 1: Global MPO Fiber Optic Patch Cord Revenue Breakdown (undefined, %) by Region 2025 & 2033
- Figure 2: North America MPO Fiber Optic Patch Cord Revenue (undefined), by Application 2025 & 2033
- Figure 3: North America MPO Fiber Optic Patch Cord Revenue Share (%), by Application 2025 & 2033
- Figure 4: North America MPO Fiber Optic Patch Cord Revenue (undefined), by Types 2025 & 2033
- Figure 5: North America MPO Fiber Optic Patch Cord Revenue Share (%), by Types 2025 & 2033
- Figure 6: North America MPO Fiber Optic Patch Cord Revenue (undefined), by Country 2025 & 2033
- Figure 7: North America MPO Fiber Optic Patch Cord Revenue Share (%), by Country 2025 & 2033
- Figure 8: South America MPO Fiber Optic Patch Cord Revenue (undefined), by Application 2025 & 2033
- Figure 9: South America MPO Fiber Optic Patch Cord Revenue Share (%), by Application 2025 & 2033
- Figure 10: South America MPO Fiber Optic Patch Cord Revenue (undefined), by Types 2025 & 2033
- Figure 11: South America MPO Fiber Optic Patch Cord Revenue Share (%), by Types 2025 & 2033
- Figure 12: South America MPO Fiber Optic Patch Cord Revenue (undefined), by Country 2025 & 2033
- Figure 13: South America MPO Fiber Optic Patch Cord Revenue Share (%), by Country 2025 & 2033
- Figure 14: Europe MPO Fiber Optic Patch Cord Revenue (undefined), by Application 2025 & 2033
- Figure 15: Europe MPO Fiber Optic Patch Cord Revenue Share (%), by Application 2025 & 2033
- Figure 16: Europe MPO Fiber Optic Patch Cord Revenue (undefined), by Types 2025 & 2033
- Figure 17: Europe MPO Fiber Optic Patch Cord Revenue Share (%), by Types 2025 & 2033
- Figure 18: Europe MPO Fiber Optic Patch Cord Revenue (undefined), by Country 2025 & 2033
- Figure 19: Europe MPO Fiber Optic Patch Cord Revenue Share (%), by Country 2025 & 2033
- Figure 20: Middle East & Africa MPO Fiber Optic Patch Cord Revenue (undefined), by Application 2025 & 2033
- Figure 21: Middle East & Africa MPO Fiber Optic Patch Cord Revenue Share (%), by Application 2025 & 2033
- Figure 22: Middle East & Africa MPO Fiber Optic Patch Cord Revenue (undefined), by Types 2025 & 2033
- Figure 23: Middle East & Africa MPO Fiber Optic Patch Cord Revenue Share (%), by Types 2025 & 2033
- Figure 24: Middle East & Africa MPO Fiber Optic Patch Cord Revenue (undefined), by Country 2025 & 2033
- Figure 25: Middle East & Africa MPO Fiber Optic Patch Cord Revenue Share (%), by Country 2025 & 2033
- Figure 26: Asia Pacific MPO Fiber Optic Patch Cord Revenue (undefined), by Application 2025 & 2033
- Figure 27: Asia Pacific MPO Fiber Optic Patch Cord Revenue Share (%), by Application 2025 & 2033
- Figure 28: Asia Pacific MPO Fiber Optic Patch Cord Revenue (undefined), by Types 2025 & 2033
- Figure 29: Asia Pacific MPO Fiber Optic Patch Cord Revenue Share (%), by Types 2025 & 2033
- Figure 30: Asia Pacific MPO Fiber Optic Patch Cord Revenue (undefined), by Country 2025 & 2033
- Figure 31: Asia Pacific MPO Fiber Optic Patch Cord Revenue Share (%), by Country 2025 & 2033
List of Tables
- Table 1: Global MPO Fiber Optic Patch Cord Revenue undefined Forecast, by Application 2020 & 2033
- Table 2: Global MPO Fiber Optic Patch Cord Revenue undefined Forecast, by Types 2020 & 2033
- Table 3: Global MPO Fiber Optic Patch Cord Revenue undefined Forecast, by Region 2020 & 2033
- Table 4: Global MPO Fiber Optic Patch Cord Revenue undefined Forecast, by Application 2020 & 2033
- Table 5: Global MPO Fiber Optic Patch Cord Revenue undefined Forecast, by Types 2020 & 2033
- Table 6: Global MPO Fiber Optic Patch Cord Revenue undefined Forecast, by Country 2020 & 2033
- Table 7: United States MPO Fiber Optic Patch Cord Revenue (undefined) Forecast, by Application 2020 & 2033
- Table 8: Canada MPO Fiber Optic Patch Cord Revenue (undefined) Forecast, by Application 2020 & 2033
- Table 9: Mexico MPO Fiber Optic Patch Cord Revenue (undefined) Forecast, by Application 2020 & 2033
- Table 10: Global MPO Fiber Optic Patch Cord Revenue undefined Forecast, by Application 2020 & 2033
- Table 11: Global MPO Fiber Optic Patch Cord Revenue undefined Forecast, by Types 2020 & 2033
- Table 12: Global MPO Fiber Optic Patch Cord Revenue undefined Forecast, by Country 2020 & 2033
- Table 13: Brazil MPO Fiber Optic Patch Cord Revenue (undefined) Forecast, by Application 2020 & 2033
- Table 14: Argentina MPO Fiber Optic Patch Cord Revenue (undefined) Forecast, by Application 2020 & 2033
- Table 15: Rest of South America MPO Fiber Optic Patch Cord Revenue (undefined) Forecast, by Application 2020 & 2033
- Table 16: Global MPO Fiber Optic Patch Cord Revenue undefined Forecast, by Application 2020 & 2033
- Table 17: Global MPO Fiber Optic Patch Cord Revenue undefined Forecast, by Types 2020 & 2033
- Table 18: Global MPO Fiber Optic Patch Cord Revenue undefined Forecast, by Country 2020 & 2033
- Table 19: United Kingdom MPO Fiber Optic Patch Cord Revenue (undefined) Forecast, by Application 2020 & 2033
- Table 20: Germany MPO Fiber Optic Patch Cord Revenue (undefined) Forecast, by Application 2020 & 2033
- Table 21: France MPO Fiber Optic Patch Cord Revenue (undefined) Forecast, by Application 2020 & 2033
- Table 22: Italy MPO Fiber Optic Patch Cord Revenue (undefined) Forecast, by Application 2020 & 2033
- Table 23: Spain MPO Fiber Optic Patch Cord Revenue (undefined) Forecast, by Application 2020 & 2033
- Table 24: Russia MPO Fiber Optic Patch Cord Revenue (undefined) Forecast, by Application 2020 & 2033
- Table 25: Benelux MPO Fiber Optic Patch Cord Revenue (undefined) Forecast, by Application 2020 & 2033
- Table 26: Nordics MPO Fiber Optic Patch Cord Revenue (undefined) Forecast, by Application 2020 & 2033
- Table 27: Rest of Europe MPO Fiber Optic Patch Cord Revenue (undefined) Forecast, by Application 2020 & 2033
- Table 28: Global MPO Fiber Optic Patch Cord Revenue undefined Forecast, by Application 2020 & 2033
- Table 29: Global MPO Fiber Optic Patch Cord Revenue undefined Forecast, by Types 2020 & 2033
- Table 30: Global MPO Fiber Optic Patch Cord Revenue undefined Forecast, by Country 2020 & 2033
- Table 31: Turkey MPO Fiber Optic Patch Cord Revenue (undefined) Forecast, by Application 2020 & 2033
- Table 32: Israel MPO Fiber Optic Patch Cord Revenue (undefined) Forecast, by Application 2020 & 2033
- Table 33: GCC MPO Fiber Optic Patch Cord Revenue (undefined) Forecast, by Application 2020 & 2033
- Table 34: North Africa MPO Fiber Optic Patch Cord Revenue (undefined) Forecast, by Application 2020 & 2033
- Table 35: South Africa MPO Fiber Optic Patch Cord Revenue (undefined) Forecast, by Application 2020 & 2033
- Table 36: Rest of Middle East & Africa MPO Fiber Optic Patch Cord Revenue (undefined) Forecast, by Application 2020 & 2033
- Table 37: Global MPO Fiber Optic Patch Cord Revenue undefined Forecast, by Application 2020 & 2033
- Table 38: Global MPO Fiber Optic Patch Cord Revenue undefined Forecast, by Types 2020 & 2033
- Table 39: Global MPO Fiber Optic Patch Cord Revenue undefined Forecast, by Country 2020 & 2033
- Table 40: China MPO Fiber Optic Patch Cord Revenue (undefined) Forecast, by Application 2020 & 2033
- Table 41: India MPO Fiber Optic Patch Cord Revenue (undefined) Forecast, by Application 2020 & 2033
- Table 42: Japan MPO Fiber Optic Patch Cord Revenue (undefined) Forecast, by Application 2020 & 2033
- Table 43: South Korea MPO Fiber Optic Patch Cord Revenue (undefined) Forecast, by Application 2020 & 2033
- Table 44: ASEAN MPO Fiber Optic Patch Cord Revenue (undefined) Forecast, by Application 2020 & 2033
- Table 45: Oceania MPO Fiber Optic Patch Cord Revenue (undefined) Forecast, by Application 2020 & 2033
- Table 46: Rest of Asia Pacific MPO Fiber Optic Patch Cord Revenue (undefined) Forecast, by Application 2020 & 2033
Frequently Asked Questions
1. What is the projected Compound Annual Growth Rate (CAGR) of the MPO Fiber Optic Patch Cord?
The projected CAGR is approximately 4.1%.
2. Which companies are prominent players in the MPO Fiber Optic Patch Cord?
Key companies in the market include Amphenol, Belden, Siemon, T&S Communications, Tripp Lite, Sumitomo Electric, Furukawa, Suzhou Agix, Molex, Panduit, AVIC Jonhon Optronic, TFC, Longxing, LEAD Fiber Optics.
3. What are the main segments of the MPO Fiber Optic Patch Cord?
The market segments include Application, Types.
4. Can you provide details about the market size?
The market size is estimated to be USD XXX N/A as of 2022.
5. What are some drivers contributing to market growth?
N/A
6. What are the notable trends driving market growth?
N/A
7. Are there any restraints impacting market growth?
N/A
8. Can you provide examples of recent developments in the market?
N/A
9. What pricing options are available for accessing the report?
Pricing options include single-user, multi-user, and enterprise licenses priced at USD 2900.00, USD 4350.00, and USD 5800.00 respectively.
10. Is the market size provided in terms of value or volume?
The market size is provided in terms of value, measured in N/A.
11. Are there any specific market keywords associated with the report?
Yes, the market keyword associated with the report is "MPO Fiber Optic Patch Cord," which aids in identifying and referencing the specific market segment covered.
12. How do I determine which pricing option suits my needs best?
The pricing options vary based on user requirements and access needs. Individual users may opt for single-user licenses, while businesses requiring broader access may choose multi-user or enterprise licenses for cost-effective access to the report.
13. Are there any additional resources or data provided in the MPO Fiber Optic Patch Cord report?
While the report offers comprehensive insights, it's advisable to review the specific contents or supplementary materials provided to ascertain if additional resources or data are available.
14. How can I stay updated on further developments or reports in the MPO Fiber Optic Patch Cord?
To stay informed about further developments, trends, and reports in the MPO Fiber Optic Patch Cord, consider subscribing to industry newsletters, following relevant companies and organizations, or regularly checking reputable industry news sources and publications.
Methodology
Step 1 - Identification of Relevant Samples Size from Population Database


Step 2 - Approaches for Defining Global Market Size (Value, Volume* & Price*)

Note*: In applicable scenarios
Step 3 - Data Sources
Primary Research
- Web Analytics
- Survey Reports
- Research Institute
- Latest Research Reports
- Opinion Leaders
Secondary Research
- Annual Reports
- White Paper
- Latest Press Release
- Industry Association
- Paid Database
- Investor Presentations

Step 4 - Data Triangulation
Involves using different sources of information in order to increase the validity of a study
These sources are likely to be stakeholders in a program - participants, other researchers, program staff, other community members, and so on.
Then we put all data in single framework & apply various statistical tools to find out the dynamic on the market.
During the analysis stage, feedback from the stakeholder groups would be compared to determine areas of agreement as well as areas of divergence