

Key Insights
The Non-Destructive Testing (NDT) for Infrastructure Inspections market is poised for significant expansion. This growth is propelled by aging global infrastructure, increasingly stringent safety mandates, and a proactive shift towards preventative maintenance. With a projected market size of 10.36 billion in the base year 2025, and a Compound Annual Growth Rate (CAGR) of 7.8%, the market is set for substantial development through 2033. Key drivers include the burgeoning construction and industrial sectors, especially in emerging economies, and the escalating need for robust infrastructure asset management. Technological innovations in NDT, such as advanced imaging (e.g., laser scanning) and AI-driven data analysis, are further catalyzing this market expansion. While initial NDT technology investments may be considerable, the long-term economic benefits derived from preventative maintenance and minimized failure risks present a compellingly cost-effective strategy for infrastructure stakeholders.
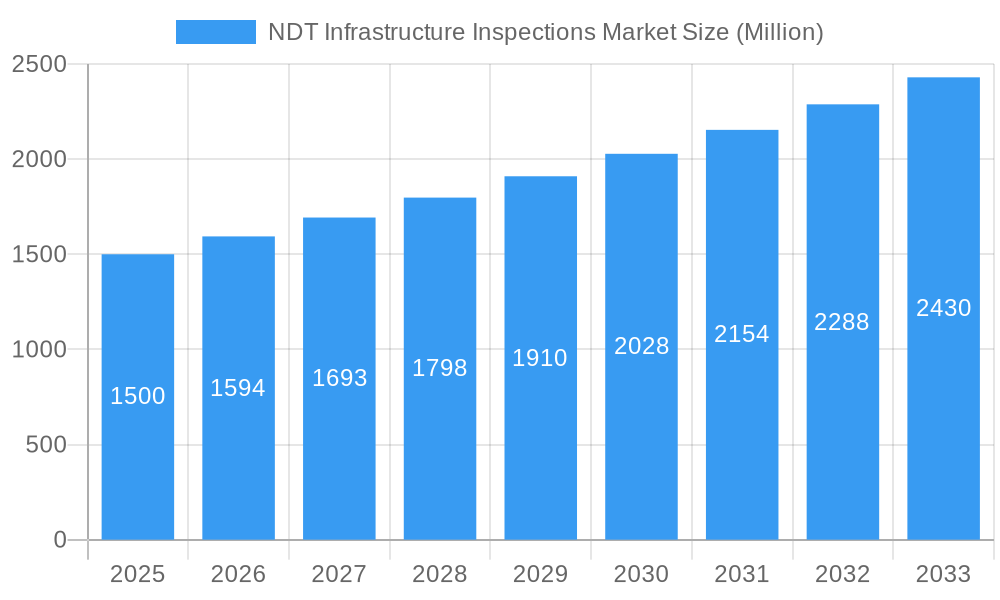
NDT Infrastructure Inspections Market Market Size (In Billion)
The market is segmented across diverse end-user industries, including construction, industrial sectors, and real estate, alongside various testing technologies such as radiographic, ultrasonic, and magnetic particle methods. Within end-user segments, the construction industry remains a dominant force, fueled by extensive global infrastructure projects. Advanced testing techniques, including laser scanning and thermography, are demonstrating strong growth due to their enhanced accuracy and efficiency. Geographically, while North America and Europe currently lead market share, the Asia-Pacific region is anticipated to experience the most rapid expansion, driven by its accelerated infrastructure development. Challenges include the requirement for skilled professionals in NDT operations and potential regulatory complexities. Nevertheless, the overall outlook for the NDT infrastructure inspections market is highly optimistic, underpinned by sustained growth trajectories and ongoing technological advancements.
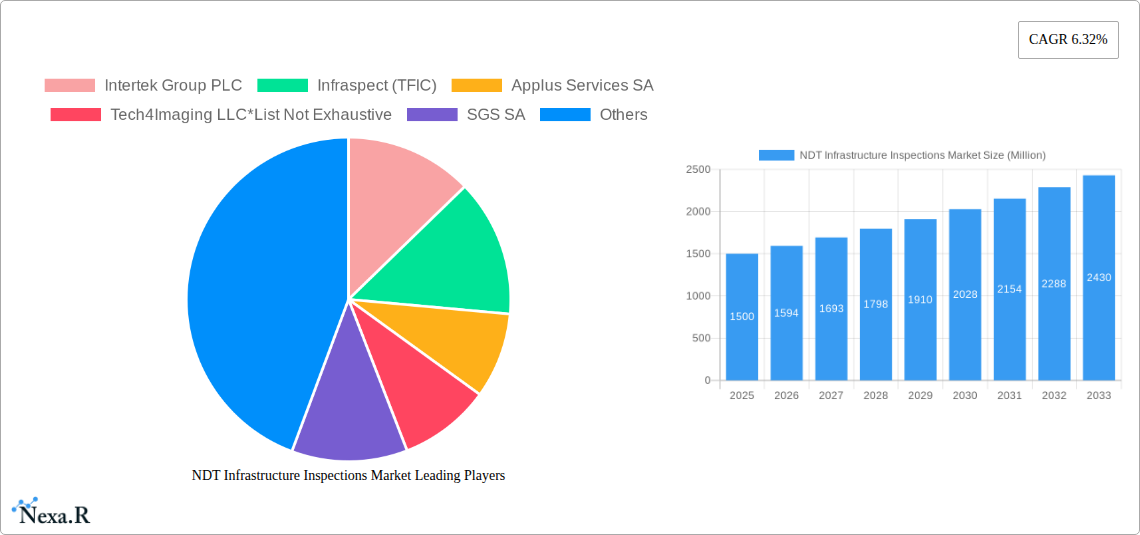
NDT Infrastructure Inspections Market Company Market Share
NDT Infrastructure Inspections Market: A Comprehensive Report (2019-2033)
This comprehensive report provides an in-depth analysis of the NDT Infrastructure Inspections Market, encompassing market dynamics, growth trends, regional analysis, product landscape, key players, and future outlook. The study period covers 2019-2033, with a base year of 2025 and a forecast period of 2025-2033. The market is segmented by end-user industry (Construction, Industrial, Real Estate, Other), type (Equipment, Services), and technology (Radiographic, Ultrasonic, Magnetic Particle, Liquid Penetrant, Visual, Acoustic Emission, Thermography, Laser Scanning, Other). The report's findings are crucial for industry professionals, investors, and strategic decision-makers seeking to understand and capitalize on the growth opportunities within this expanding market. The market size in 2025 is estimated at xx Million.
NDT Infrastructure Inspections Market Dynamics & Structure
The NDT Infrastructure Inspections Market is characterized by a moderately concentrated structure with several key players vying for market share. Technological innovation, driven by the need for improved inspection accuracy and efficiency, is a major driver of market growth. Stringent regulatory frameworks related to infrastructure safety and maintenance further stimulate demand for NDT services. Competitive product substitutes, such as visual inspections, exist, but NDT methods often offer superior accuracy and detail. End-user demographics, particularly the aging infrastructure in many developed nations, are significantly impacting demand. M&A activity has been moderate, with larger players strategically acquiring smaller companies to expand their service offerings and geographical reach.
- Market Concentration: Moderately concentrated, with top 10 players holding approximately xx% market share in 2025.
- Technological Innovation: Significant investments in advanced technologies like AI-powered image analysis and automated inspection systems.
- Regulatory Frameworks: Stringent safety regulations mandating regular inspections for bridges, tunnels, pipelines, etc.
- Competitive Substitutes: Visual inspections and other traditional methods, but NDT's superior accuracy gives it an edge.
- End-User Demographics: Aging infrastructure in developed nations fuels demand for inspection and maintenance.
- M&A Activity: Moderate activity, with xx major deals recorded between 2019-2024.
NDT Infrastructure Inspections Market Growth Trends & Insights
The NDT Infrastructure Inspections Market exhibits robust growth, driven by factors such as increasing infrastructure investments globally and the rising need for asset preservation. The market size is projected to expand at a CAGR of xx% from 2025 to 2033, reaching xx Million by 2033. Adoption rates for advanced NDT technologies are increasing steadily, fueled by technological advancements and improved cost-effectiveness. Disruptive technologies, including AI-powered data analysis and robotic inspection systems, are transforming the landscape, enabling more efficient and accurate inspections. Consumer behavior shifts are also observable, with a growing emphasis on proactive maintenance and predictive analytics to prevent catastrophic failures.
Dominant Regions, Countries, or Segments in NDT Infrastructure Inspections Market
North America and Europe currently dominate the NDT Infrastructure Inspections Market due to robust infrastructure networks and stringent safety regulations. The Construction and Industrial sectors are the largest end-users, driven by the need to ensure the safety and longevity of buildings, pipelines, and other crucial assets. Ultrasonic testing and radiographic testing represent the largest technology segments, owing to their versatility and established track record. However, emerging economies in Asia-Pacific are showing significant growth potential, fueled by rapid infrastructure development.
- Key Drivers:
- Growing investment in infrastructure projects globally.
- Increasing emphasis on asset integrity management.
- Stringent safety regulations.
- Dominant Regions: North America and Europe.
- Largest End-user Segments: Construction and Industrial sectors.
- Largest Technology Segments: Ultrasonic and Radiographic Testing.
- High-Growth Potential Regions: Asia-Pacific.
NDT Infrastructure Inspections Market Product Landscape
The NDT Infrastructure Inspections Market offers a diverse range of equipment, services, and technologies tailored to specific infrastructure needs. Innovations focus on improving inspection speed, accuracy, and data analysis capabilities. Products are often customized to address specific challenges, such as inspecting complex geometries or difficult-to-access areas. Unique selling propositions include enhanced portability, improved image quality, and integrated data management systems. Recent advancements in AI and automation significantly improve efficiency and reduce human error.
Key Drivers, Barriers & Challenges in NDT Infrastructure Inspections Market
Key Drivers:
- Increasing infrastructure investments worldwide.
- Stringent safety and regulatory compliance standards.
- Advances in NDT technologies improving accuracy and efficiency.
- Growing awareness of infrastructure asset management.
Key Challenges and Restraints:
- High initial investment costs associated with some NDT technologies.
- Skilled labor shortages for performing and interpreting NDT inspections.
- Complex regulatory landscape and differing standards across regions.
- Competition from established and emerging players. This leads to price pressure in some segments, impacting profitability margins by approximately xx%.
Emerging Opportunities in NDT Infrastructure Inspections Market
- Growing adoption of predictive maintenance strategies, leveraging NDT data for proactive maintenance.
- Expansion into developing economies with increasing infrastructure development.
- Development of advanced data analytics platforms for efficient NDT data interpretation.
- Integration of drones and robots for remote and automated inspections.
Growth Accelerators in the NDT Infrastructure Inspections Market Industry
Strategic partnerships between NDT service providers and technology companies accelerate market growth by fostering innovation and expanding market reach. Technological advancements, particularly in AI-powered data analysis and automation, significantly improve efficiency and accuracy. Government initiatives promoting infrastructure development and asset management further stimulate market expansion.
Key Players Shaping the NDT Infrastructure Inspections Market Market
- Intertek Group PLC
- Infraspect (TFIC)
- Applus Services SA
- Tech4Imaging LLC
- SGS SA
- Mistras Group Inc
- Acuren Group Inc
- ROSEN Group
- Bureau Veritas SA
- Olympus Corporation
- Teledyne FLIR LLC
Notable Milestones in NDT Infrastructure Inspections Market Sector
- November 2022: Toshiba Corporation developed the Sliding Sheet-Lattice Matrix (SSLM) for ultrasonic NDT, eliminating the need for liquid couplants.
- September 2022: JME Ltd. partnered with DÜRR NDT to integrate its NDT system with D-Tect X imaging software for enhanced infrastructural testing.
In-Depth NDT Infrastructure Inspections Market Market Outlook
The future of the NDT Infrastructure Inspections Market looks promising, with continued growth driven by technological advancements, increasing infrastructure investments, and stricter safety regulations. Strategic partnerships, focused research and development, and expanding into new markets will present significant opportunities for players in this dynamic sector. The market is poised for continued expansion, driven by the increasing need for efficient and reliable infrastructure inspection and maintenance solutions.
NDT Infrastructure Inspections Market Segmentation
-
1. Type
- 1.1. Equipment
- 1.2. Services
-
2. Technology
- 2.1. Radiographic Testing
- 2.2. Ultrasonic Testing
- 2.3. Magnetic Particle Testing
- 2.4. Liquid Penetrant Testing
- 2.5. Visual Testing
- 2.6. Acoustic Emission Testing
- 2.7. Thermography Testing
- 2.8. Laser Scanning Testing
- 2.9. Other Technologies
-
3. End-user Industry
- 3.1. Construction Industry
- 3.2. Industrial Sector
- 3.3. Real Estate Industry
- 3.4. Other End-user Industries
NDT Infrastructure Inspections Market Segmentation By Geography
- 1. North America
- 2. Europe
- 3. Asia Pacific
- 4. Latin America
- 5. Middle East and Africa
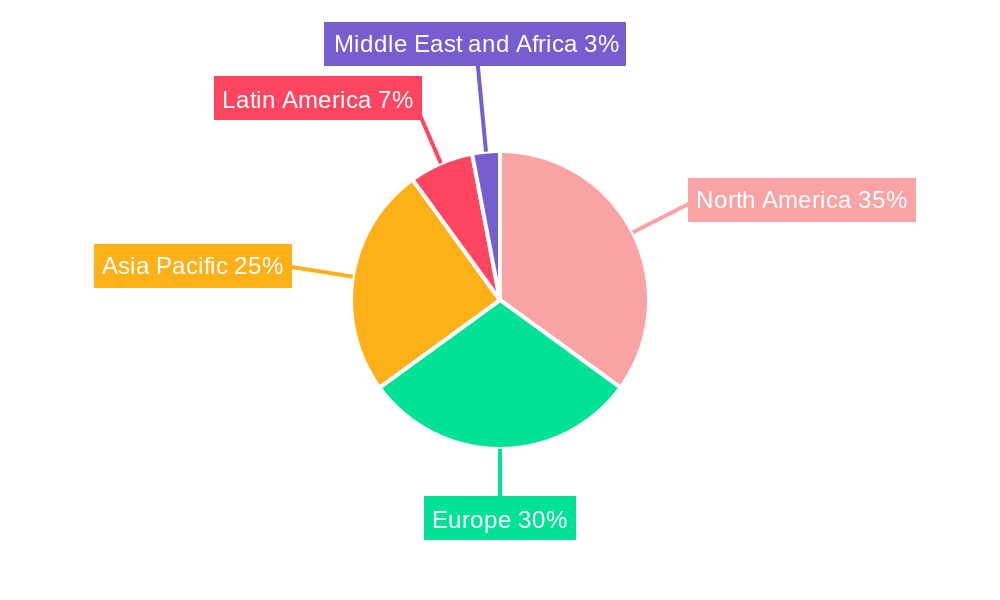
NDT Infrastructure Inspections Market Regional Market Share
Geographic Coverage of NDT Infrastructure Inspections Market
NDT Infrastructure Inspections Market REPORT HIGHLIGHTS
| Aspects | Details |
|---|---|
| Study Period | 2020-2034 |
| Base Year | 2025 |
| Estimated Year | 2026 |
| Forecast Period | 2026-2034 |
| Historical Period | 2020-2025 |
| Growth Rate | CAGR of 7.8% from 2020-2034 |
| Segmentation |
|
Table of Contents
- 1. Introduction
- 1.1. Research Scope
- 1.2. Market Segmentation
- 1.3. Research Objective
- 1.4. Definitions and Assumptions
- 2. Executive Summary
- 2.1. Market Snapshot
- 3. Market Dynamics
- 3.1. Market Drivers
- 3.2. Market Restrains
- 3.3. Market Trends
- 3.4. Market Opportunities
- 4. Market Factor Analysis
- 4.1. Porters Five Forces
- 4.1.1. Bargaining Power of Suppliers
- 4.1.2. Bargaining Power of Buyers
- 4.1.3. Threat of New Entrants
- 4.1.4. Threat of Substitutes
- 4.1.5. Competitive Rivalry
- 4.2. PESTEL analysis
- 4.3. BCG Analysis
- 4.3.1. Stars (High Growth, High Market Share)
- 4.3.2. Cash Cows (Low Growth, High Market Share)
- 4.3.3. Question Mark (High Growth, Low Market Share)
- 4.3.4. Dogs (Low Growth, Low Market Share)
- 4.4. Ansoff Matrix Analysis
- 4.5. Supply Chain Analysis
- 4.6. Regulatory Landscape
- 4.7. Current Market Potential and Opportunity Assessment (TAM–SAM–SOM Framework)
- 4.8. NRP Analyst Note
- 4.1. Porters Five Forces
- 5. Market Analysis, Insights and Forecast 2021-2033
- 5.1. Market Analysis, Insights and Forecast - by Type
- 5.1.1. Equipment
- 5.1.2. Services
- 5.2. Market Analysis, Insights and Forecast - by Technology
- 5.2.1. Radiographic Testing
- 5.2.2. Ultrasonic Testing
- 5.2.3. Magnetic Particle Testing
- 5.2.4. Liquid Penetrant Testing
- 5.2.5. Visual Testing
- 5.2.6. Acoustic Emission Testing
- 5.2.7. Thermography Testing
- 5.2.8. Laser Scanning Testing
- 5.2.9. Other Technologies
- 5.3. Market Analysis, Insights and Forecast - by End-user Industry
- 5.3.1. Construction Industry
- 5.3.2. Industrial Sector
- 5.3.3. Real Estate Industry
- 5.3.4. Other End-user Industries
- 5.4. Market Analysis, Insights and Forecast - by Region
- 5.4.1. North America
- 5.4.2. Europe
- 5.4.3. Asia Pacific
- 5.4.4. Latin America
- 5.4.5. Middle East and Africa
- 5.1. Market Analysis, Insights and Forecast - by Type
- 6. Global NDT Infrastructure Inspections Market Analysis, Insights and Forecast, 2021-2033
- 6.1. Market Analysis, Insights and Forecast - by Type
- 6.1.1. Equipment
- 6.1.2. Services
- 6.2. Market Analysis, Insights and Forecast - by Technology
- 6.2.1. Radiographic Testing
- 6.2.2. Ultrasonic Testing
- 6.2.3. Magnetic Particle Testing
- 6.2.4. Liquid Penetrant Testing
- 6.2.5. Visual Testing
- 6.2.6. Acoustic Emission Testing
- 6.2.7. Thermography Testing
- 6.2.8. Laser Scanning Testing
- 6.2.9. Other Technologies
- 6.3. Market Analysis, Insights and Forecast - by End-user Industry
- 6.3.1. Construction Industry
- 6.3.2. Industrial Sector
- 6.3.3. Real Estate Industry
- 6.3.4. Other End-user Industries
- 6.1. Market Analysis, Insights and Forecast - by Type
- 7. North America NDT Infrastructure Inspections Market Analysis, Insights and Forecast, 2020-2032
- 7.1. Market Analysis, Insights and Forecast - by Type
- 7.1.1. Equipment
- 7.1.2. Services
- 7.2. Market Analysis, Insights and Forecast - by Technology
- 7.2.1. Radiographic Testing
- 7.2.2. Ultrasonic Testing
- 7.2.3. Magnetic Particle Testing
- 7.2.4. Liquid Penetrant Testing
- 7.2.5. Visual Testing
- 7.2.6. Acoustic Emission Testing
- 7.2.7. Thermography Testing
- 7.2.8. Laser Scanning Testing
- 7.2.9. Other Technologies
- 7.3. Market Analysis, Insights and Forecast - by End-user Industry
- 7.3.1. Construction Industry
- 7.3.2. Industrial Sector
- 7.3.3. Real Estate Industry
- 7.3.4. Other End-user Industries
- 7.1. Market Analysis, Insights and Forecast - by Type
- 8. Europe NDT Infrastructure Inspections Market Analysis, Insights and Forecast, 2020-2032
- 8.1. Market Analysis, Insights and Forecast - by Type
- 8.1.1. Equipment
- 8.1.2. Services
- 8.2. Market Analysis, Insights and Forecast - by Technology
- 8.2.1. Radiographic Testing
- 8.2.2. Ultrasonic Testing
- 8.2.3. Magnetic Particle Testing
- 8.2.4. Liquid Penetrant Testing
- 8.2.5. Visual Testing
- 8.2.6. Acoustic Emission Testing
- 8.2.7. Thermography Testing
- 8.2.8. Laser Scanning Testing
- 8.2.9. Other Technologies
- 8.3. Market Analysis, Insights and Forecast - by End-user Industry
- 8.3.1. Construction Industry
- 8.3.2. Industrial Sector
- 8.3.3. Real Estate Industry
- 8.3.4. Other End-user Industries
- 8.1. Market Analysis, Insights and Forecast - by Type
- 9. Asia Pacific NDT Infrastructure Inspections Market Analysis, Insights and Forecast, 2020-2032
- 9.1. Market Analysis, Insights and Forecast - by Type
- 9.1.1. Equipment
- 9.1.2. Services
- 9.2. Market Analysis, Insights and Forecast - by Technology
- 9.2.1. Radiographic Testing
- 9.2.2. Ultrasonic Testing
- 9.2.3. Magnetic Particle Testing
- 9.2.4. Liquid Penetrant Testing
- 9.2.5. Visual Testing
- 9.2.6. Acoustic Emission Testing
- 9.2.7. Thermography Testing
- 9.2.8. Laser Scanning Testing
- 9.2.9. Other Technologies
- 9.3. Market Analysis, Insights and Forecast - by End-user Industry
- 9.3.1. Construction Industry
- 9.3.2. Industrial Sector
- 9.3.3. Real Estate Industry
- 9.3.4. Other End-user Industries
- 9.1. Market Analysis, Insights and Forecast - by Type
- 10. Latin America NDT Infrastructure Inspections Market Analysis, Insights and Forecast, 2020-2032
- 10.1. Market Analysis, Insights and Forecast - by Type
- 10.1.1. Equipment
- 10.1.2. Services
- 10.2. Market Analysis, Insights and Forecast - by Technology
- 10.2.1. Radiographic Testing
- 10.2.2. Ultrasonic Testing
- 10.2.3. Magnetic Particle Testing
- 10.2.4. Liquid Penetrant Testing
- 10.2.5. Visual Testing
- 10.2.6. Acoustic Emission Testing
- 10.2.7. Thermography Testing
- 10.2.8. Laser Scanning Testing
- 10.2.9. Other Technologies
- 10.3. Market Analysis, Insights and Forecast - by End-user Industry
- 10.3.1. Construction Industry
- 10.3.2. Industrial Sector
- 10.3.3. Real Estate Industry
- 10.3.4. Other End-user Industries
- 10.1. Market Analysis, Insights and Forecast - by Type
- 11. Middle East and Africa NDT Infrastructure Inspections Market Analysis, Insights and Forecast, 2020-2032
- 11.1. Market Analysis, Insights and Forecast - by Type
- 11.1.1. Equipment
- 11.1.2. Services
- 11.2. Market Analysis, Insights and Forecast - by Technology
- 11.2.1. Radiographic Testing
- 11.2.2. Ultrasonic Testing
- 11.2.3. Magnetic Particle Testing
- 11.2.4. Liquid Penetrant Testing
- 11.2.5. Visual Testing
- 11.2.6. Acoustic Emission Testing
- 11.2.7. Thermography Testing
- 11.2.8. Laser Scanning Testing
- 11.2.9. Other Technologies
- 11.3. Market Analysis, Insights and Forecast - by End-user Industry
- 11.3.1. Construction Industry
- 11.3.2. Industrial Sector
- 11.3.3. Real Estate Industry
- 11.3.4. Other End-user Industries
- 11.1. Market Analysis, Insights and Forecast - by Type
- 12. Competitive Analysis
- 12.1. Company Profiles
- 12.1.1 Intertek Group PLC
- 12.1.1.1. Company Overview
- 12.1.1.2. Products
- 12.1.1.3. Company Financials
- 12.1.1.4. SWOT Analysis
- 12.1.2 Infraspect (TFIC)
- 12.1.2.1. Company Overview
- 12.1.2.2. Products
- 12.1.2.3. Company Financials
- 12.1.2.4. SWOT Analysis
- 12.1.3 Applus Services SA
- 12.1.3.1. Company Overview
- 12.1.3.2. Products
- 12.1.3.3. Company Financials
- 12.1.3.4. SWOT Analysis
- 12.1.4 Tech4Imaging LLC*List Not Exhaustive
- 12.1.4.1. Company Overview
- 12.1.4.2. Products
- 12.1.4.3. Company Financials
- 12.1.4.4. SWOT Analysis
- 12.1.5 SGS SA
- 12.1.5.1. Company Overview
- 12.1.5.2. Products
- 12.1.5.3. Company Financials
- 12.1.5.4. SWOT Analysis
- 12.1.6 Mistras Group Inc
- 12.1.6.1. Company Overview
- 12.1.6.2. Products
- 12.1.6.3. Company Financials
- 12.1.6.4. SWOT Analysis
- 12.1.7 Acuren Group Inc
- 12.1.7.1. Company Overview
- 12.1.7.2. Products
- 12.1.7.3. Company Financials
- 12.1.7.4. SWOT Analysis
- 12.1.8 ROSEN Group
- 12.1.8.1. Company Overview
- 12.1.8.2. Products
- 12.1.8.3. Company Financials
- 12.1.8.4. SWOT Analysis
- 12.1.9 Bureau Veritas SA
- 12.1.9.1. Company Overview
- 12.1.9.2. Products
- 12.1.9.3. Company Financials
- 12.1.9.4. SWOT Analysis
- 12.1.10 Olympus Corporation
- 12.1.10.1. Company Overview
- 12.1.10.2. Products
- 12.1.10.3. Company Financials
- 12.1.10.4. SWOT Analysis
- 12.1.11 Teledyne FLIR LLC
- 12.1.11.1. Company Overview
- 12.1.11.2. Products
- 12.1.11.3. Company Financials
- 12.1.11.4. SWOT Analysis
- 12.1.1 Intertek Group PLC
- 12.2. Market Entropy
- 12.2.1 Company's Key Areas Served
- 12.2.2 Recent Developments
- 12.3. Company Market Share Analysis 2025
- 12.3.1 Top 5 Companies Market Share Analysis
- 12.3.2 Top 3 Companies Market Share Analysis
- 12.4. List of Potential Customers
- 13. Research Methodology
List of Figures
- Figure 1: Global NDT Infrastructure Inspections Market Revenue Breakdown (billion, %) by Region 2025 & 2033
- Figure 2: North America NDT Infrastructure Inspections Market Revenue (billion), by Type 2025 & 2033
- Figure 3: North America NDT Infrastructure Inspections Market Revenue Share (%), by Type 2025 & 2033
- Figure 4: North America NDT Infrastructure Inspections Market Revenue (billion), by Technology 2025 & 2033
- Figure 5: North America NDT Infrastructure Inspections Market Revenue Share (%), by Technology 2025 & 2033
- Figure 6: North America NDT Infrastructure Inspections Market Revenue (billion), by End-user Industry 2025 & 2033
- Figure 7: North America NDT Infrastructure Inspections Market Revenue Share (%), by End-user Industry 2025 & 2033
- Figure 8: North America NDT Infrastructure Inspections Market Revenue (billion), by Country 2025 & 2033
- Figure 9: North America NDT Infrastructure Inspections Market Revenue Share (%), by Country 2025 & 2033
- Figure 10: Europe NDT Infrastructure Inspections Market Revenue (billion), by Type 2025 & 2033
- Figure 11: Europe NDT Infrastructure Inspections Market Revenue Share (%), by Type 2025 & 2033
- Figure 12: Europe NDT Infrastructure Inspections Market Revenue (billion), by Technology 2025 & 2033
- Figure 13: Europe NDT Infrastructure Inspections Market Revenue Share (%), by Technology 2025 & 2033
- Figure 14: Europe NDT Infrastructure Inspections Market Revenue (billion), by End-user Industry 2025 & 2033
- Figure 15: Europe NDT Infrastructure Inspections Market Revenue Share (%), by End-user Industry 2025 & 2033
- Figure 16: Europe NDT Infrastructure Inspections Market Revenue (billion), by Country 2025 & 2033
- Figure 17: Europe NDT Infrastructure Inspections Market Revenue Share (%), by Country 2025 & 2033
- Figure 18: Asia Pacific NDT Infrastructure Inspections Market Revenue (billion), by Type 2025 & 2033
- Figure 19: Asia Pacific NDT Infrastructure Inspections Market Revenue Share (%), by Type 2025 & 2033
- Figure 20: Asia Pacific NDT Infrastructure Inspections Market Revenue (billion), by Technology 2025 & 2033
- Figure 21: Asia Pacific NDT Infrastructure Inspections Market Revenue Share (%), by Technology 2025 & 2033
- Figure 22: Asia Pacific NDT Infrastructure Inspections Market Revenue (billion), by End-user Industry 2025 & 2033
- Figure 23: Asia Pacific NDT Infrastructure Inspections Market Revenue Share (%), by End-user Industry 2025 & 2033
- Figure 24: Asia Pacific NDT Infrastructure Inspections Market Revenue (billion), by Country 2025 & 2033
- Figure 25: Asia Pacific NDT Infrastructure Inspections Market Revenue Share (%), by Country 2025 & 2033
- Figure 26: Latin America NDT Infrastructure Inspections Market Revenue (billion), by Type 2025 & 2033
- Figure 27: Latin America NDT Infrastructure Inspections Market Revenue Share (%), by Type 2025 & 2033
- Figure 28: Latin America NDT Infrastructure Inspections Market Revenue (billion), by Technology 2025 & 2033
- Figure 29: Latin America NDT Infrastructure Inspections Market Revenue Share (%), by Technology 2025 & 2033
- Figure 30: Latin America NDT Infrastructure Inspections Market Revenue (billion), by End-user Industry 2025 & 2033
- Figure 31: Latin America NDT Infrastructure Inspections Market Revenue Share (%), by End-user Industry 2025 & 2033
- Figure 32: Latin America NDT Infrastructure Inspections Market Revenue (billion), by Country 2025 & 2033
- Figure 33: Latin America NDT Infrastructure Inspections Market Revenue Share (%), by Country 2025 & 2033
- Figure 34: Middle East and Africa NDT Infrastructure Inspections Market Revenue (billion), by Type 2025 & 2033
- Figure 35: Middle East and Africa NDT Infrastructure Inspections Market Revenue Share (%), by Type 2025 & 2033
- Figure 36: Middle East and Africa NDT Infrastructure Inspections Market Revenue (billion), by Technology 2025 & 2033
- Figure 37: Middle East and Africa NDT Infrastructure Inspections Market Revenue Share (%), by Technology 2025 & 2033
- Figure 38: Middle East and Africa NDT Infrastructure Inspections Market Revenue (billion), by End-user Industry 2025 & 2033
- Figure 39: Middle East and Africa NDT Infrastructure Inspections Market Revenue Share (%), by End-user Industry 2025 & 2033
- Figure 40: Middle East and Africa NDT Infrastructure Inspections Market Revenue (billion), by Country 2025 & 2033
- Figure 41: Middle East and Africa NDT Infrastructure Inspections Market Revenue Share (%), by Country 2025 & 2033
List of Tables
- Table 1: Global NDT Infrastructure Inspections Market Revenue billion Forecast, by Type 2020 & 2033
- Table 2: Global NDT Infrastructure Inspections Market Revenue billion Forecast, by Technology 2020 & 2033
- Table 3: Global NDT Infrastructure Inspections Market Revenue billion Forecast, by End-user Industry 2020 & 2033
- Table 4: Global NDT Infrastructure Inspections Market Revenue billion Forecast, by Region 2020 & 2033
- Table 5: Global NDT Infrastructure Inspections Market Revenue billion Forecast, by Type 2020 & 2033
- Table 6: Global NDT Infrastructure Inspections Market Revenue billion Forecast, by Technology 2020 & 2033
- Table 7: Global NDT Infrastructure Inspections Market Revenue billion Forecast, by End-user Industry 2020 & 2033
- Table 8: Global NDT Infrastructure Inspections Market Revenue billion Forecast, by Country 2020 & 2033
- Table 9: Global NDT Infrastructure Inspections Market Revenue billion Forecast, by Type 2020 & 2033
- Table 10: Global NDT Infrastructure Inspections Market Revenue billion Forecast, by Technology 2020 & 2033
- Table 11: Global NDT Infrastructure Inspections Market Revenue billion Forecast, by End-user Industry 2020 & 2033
- Table 12: Global NDT Infrastructure Inspections Market Revenue billion Forecast, by Country 2020 & 2033
- Table 13: Global NDT Infrastructure Inspections Market Revenue billion Forecast, by Type 2020 & 2033
- Table 14: Global NDT Infrastructure Inspections Market Revenue billion Forecast, by Technology 2020 & 2033
- Table 15: Global NDT Infrastructure Inspections Market Revenue billion Forecast, by End-user Industry 2020 & 2033
- Table 16: Global NDT Infrastructure Inspections Market Revenue billion Forecast, by Country 2020 & 2033
- Table 17: Global NDT Infrastructure Inspections Market Revenue billion Forecast, by Type 2020 & 2033
- Table 18: Global NDT Infrastructure Inspections Market Revenue billion Forecast, by Technology 2020 & 2033
- Table 19: Global NDT Infrastructure Inspections Market Revenue billion Forecast, by End-user Industry 2020 & 2033
- Table 20: Global NDT Infrastructure Inspections Market Revenue billion Forecast, by Country 2020 & 2033
- Table 21: Global NDT Infrastructure Inspections Market Revenue billion Forecast, by Type 2020 & 2033
- Table 22: Global NDT Infrastructure Inspections Market Revenue billion Forecast, by Technology 2020 & 2033
- Table 23: Global NDT Infrastructure Inspections Market Revenue billion Forecast, by End-user Industry 2020 & 2033
- Table 24: Global NDT Infrastructure Inspections Market Revenue billion Forecast, by Country 2020 & 2033
Frequently Asked Questions
1. What is the projected Compound Annual Growth Rate (CAGR) of the NDT Infrastructure Inspections Market?
The projected CAGR is approximately 7.8%.
2. Which companies are prominent players in the NDT Infrastructure Inspections Market?
Key companies in the market include Intertek Group PLC, Infraspect (TFIC), Applus Services SA, Tech4Imaging LLC*List Not Exhaustive, SGS SA, Mistras Group Inc, Acuren Group Inc, ROSEN Group, Bureau Veritas SA, Olympus Corporation, Teledyne FLIR LLC.
3. What are the main segments of the NDT Infrastructure Inspections Market?
The market segments include Type, Technology, End-user Industry.
4. Can you provide details about the market size?
The market size is estimated to be USD 10.36 billion as of 2022.
5. What are some drivers contributing to market growth?
Stringent Regulations Mandating Safety Standard in the Infrastructure Industry; Growth in Infrastructure Maintenance Services.
6. What are the notable trends driving market growth?
Growing Investment in Construction Sector to Drive the Market's Growth.
7. Are there any restraints impacting market growth?
NDT Services In Other Industries Restraining the Growth of the Market.
8. Can you provide examples of recent developments in the market?
November 2022: Toshiba Corporation developed a Sliding Sheet-Lattice Matrix (SSLM) for ultrasonic nondestructive testing in infrastructure maintenance and inspections. SSLM does not require the application of a liquid couplant, such as liquid gel, and combines high performance for passing ultrasonic waves with smooth device operability.
9. What pricing options are available for accessing the report?
Pricing options include single-user, multi-user, and enterprise licenses priced at USD 4750, USD 5250, and USD 8750 respectively.
10. Is the market size provided in terms of value or volume?
The market size is provided in terms of value, measured in billion.
11. Are there any specific market keywords associated with the report?
Yes, the market keyword associated with the report is "NDT Infrastructure Inspections Market," which aids in identifying and referencing the specific market segment covered.
12. How do I determine which pricing option suits my needs best?
The pricing options vary based on user requirements and access needs. Individual users may opt for single-user licenses, while businesses requiring broader access may choose multi-user or enterprise licenses for cost-effective access to the report.
13. Are there any additional resources or data provided in the NDT Infrastructure Inspections Market report?
While the report offers comprehensive insights, it's advisable to review the specific contents or supplementary materials provided to ascertain if additional resources or data are available.
14. How can I stay updated on further developments or reports in the NDT Infrastructure Inspections Market?
To stay informed about further developments, trends, and reports in the NDT Infrastructure Inspections Market, consider subscribing to industry newsletters, following relevant companies and organizations, or regularly checking reputable industry news sources and publications.
Methodology
Step 1 - Identification of Relevant Samples Size from Population Database


Step 2 - Approaches for Defining Global Market Size (Value, Volume* & Price*)

Note*: In applicable scenarios
Step 3 - Data Sources
Primary Research
- Web Analytics
- Survey Reports
- Research Institute
- Latest Research Reports
- Opinion Leaders
Secondary Research
- Annual Reports
- White Paper
- Latest Press Release
- Industry Association
- Paid Database
- Investor Presentations

Step 4 - Data Triangulation
Involves using different sources of information in order to increase the validity of a study
These sources are likely to be stakeholders in a program - participants, other researchers, program staff, other community members, and so on.
Then we put all data in single framework & apply various statistical tools to find out the dynamic on the market.
During the analysis stage, feedback from the stakeholder groups would be compared to determine areas of agreement as well as areas of divergence