

Key Insights
The global Non-contact Relays market is projected for substantial growth, reaching an estimated USD 10.28 billion by 2025. The market is expected to experience a Compound Annual Growth Rate (CAGR) of 7.416% through 2033. This expansion is primarily attributed to the increasing demand for enhanced reliability, extended lifespan, and reduced maintenance in industrial and consumer electronics. Key growth drivers include the escalating adoption of industrial automation for improved manufacturing efficiency and precision, the expanding appliance market driven by consumer preference for smart and energy-efficient devices, and the proliferation of building automation systems for optimized energy management and occupant comfort. The electricity power sector also significantly contributes, with non-contact relays vital for grid modernization and renewable energy integration, necessitating faster switching and superior fault tolerance.
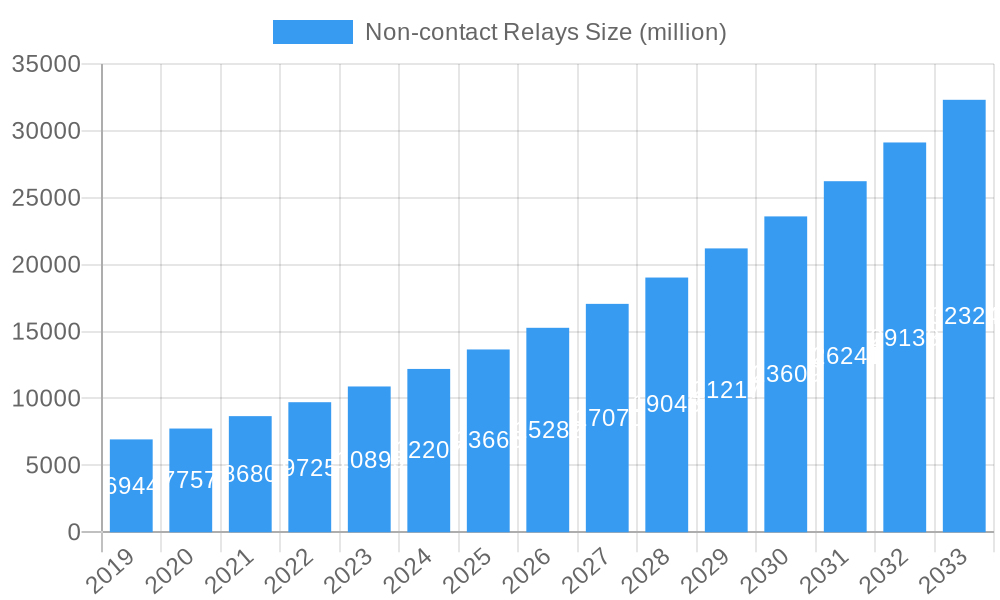
Non-contact Relays Market Size (In Billion)
While the higher initial cost of non-contact relays compared to traditional electromechanical relays presents a restraint, their superior performance and lifecycle cost benefits are mitigating this concern. Advances in semiconductor technology are reducing costs and enhancing the capabilities of Solid State Relays (SSRs), positioning them for market dominance due to their speed, silent operation, and durability. The Optical Relays segment, while smaller, is growing in specialized applications requiring high isolation and speed. Geographically, the Asia Pacific region, led by China and India, is a key growth engine due to its robust manufacturing base and rapid industrialization. North America and Europe remain significant markets, driven by technological innovation and regulatory mandates for advanced automation and energy efficiency. Key industry players like Panasonic, Toshiba, Omron, and Siemens are spearheading innovation in next-generation non-contact relay solutions.
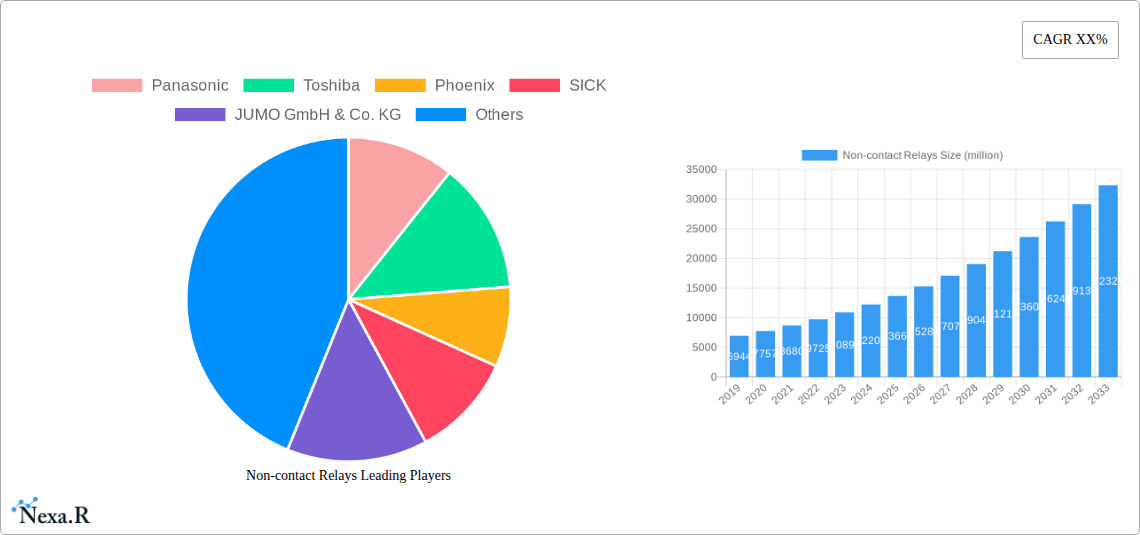
Non-contact Relays Company Market Share
Non-contact Relays Market Report: Dynamics, Trends, and Future Outlook (2019-2033)
This comprehensive report offers an in-depth analysis of the global Non-contact Relays market, providing critical insights into its dynamics, growth trajectory, and future potential. Spanning the historical period of 2019-2024, with the base and estimated year set for 2025 and a robust forecast period extending to 2033, this study is an essential resource for industry stakeholders, investors, and strategists seeking to navigate this evolving landscape. The report meticulously examines market concentration, technological innovations, regulatory frameworks, competitive alternatives, end-user demographics, and mergers & acquisitions. It delves into market size evolution, adoption rates, technological disruptions, and consumer behavior shifts, supported by granular market penetration data and Compound Annual Growth Rates (CAGRs). Furthermore, it identifies dominant regions, countries, and segments within Industrial Automation, Appliances, Building Automation, Electricity Power, and Others, as well as Optical Relays and Solid State Relays (SSR). The report also scrutinizes the product landscape, key drivers, barriers, challenges, emerging opportunities, and growth accelerators. Featuring a detailed outlook of the market's future potential, this report includes a comprehensive list of key players and notable milestones that have shaped the Non-contact Relays sector.
Non-contact Relays Market Dynamics & Structure
The global Non-contact Relays market exhibits a moderately concentrated structure, with key players like Panasonic, Omron, and TE Connectivity holding significant market shares. Technological innovation, particularly in the advancement of Solid State Relays (SSR) and optical relay technologies, serves as a primary driver, enabling enhanced switching speeds, increased lifespan, and reduced power consumption. Regulatory frameworks surrounding electrical safety and energy efficiency are increasingly influencing product design and adoption. Competitive product substitutes, such as traditional electromechanical relays, are gradually being displaced by the superior performance and reliability of non-contact alternatives, especially in demanding industrial applications. End-user demographics are shifting towards sectors prioritizing automation, efficiency, and IoT integration, including industrial automation and building automation. Mergers & Acquisition (M&A) trends are observed, though at a moderate pace, as larger companies seek to expand their product portfolios and technological capabilities.
- Market Concentration: Moderate, with a few dominant global manufacturers.
- Technological Innovation Drivers: Miniaturization, improved thermal management, higher switching capabilities, and integration with smart systems.
- Regulatory Frameworks: Increasing emphasis on energy efficiency standards and electrical safety certifications.
- Competitive Product Substitutes: Electromechanical relays (declining share), emerging solid-state technologies.
- End-User Demographics: Growing demand from industrial automation, renewable energy, and smart building sectors.
- M&A Trends: Strategic acquisitions to enhance technology portfolios and market reach.
Non-contact Relays Growth Trends & Insights
The Non-contact Relays market is poised for substantial growth, projected to expand from an estimated $5,600 million in 2025 to reach $9,200 million by 2033, exhibiting a healthy Compound Annual Growth Rate (CAGR) of approximately 6.3% during the forecast period. This expansion is fueled by the relentless march of industrial automation, where the need for precise, reliable, and fast switching solutions is paramount. The adoption rates of Solid State Relays (SSR), in particular, are accelerating across various industries due to their superior longevity, silent operation, and minimal contact wear compared to their electromechanical counterparts. Technological disruptions, such as advancements in semiconductor materials and power electronics, are leading to the development of more compact, energy-efficient, and cost-effective non-contact relays. Consumer behavior shifts are also playing a crucial role, with a growing preference for smart and connected devices in building automation and appliances, which inherently rely on advanced switching technologies. The increasing integration of the Internet of Things (IoT) across all sectors further amplifies the demand for sophisticated non-contact relay solutions that can handle digital signals and withstand harsh environments. The market penetration of non-contact relays is expected to climb steadily as legacy systems are upgraded and new infrastructure is developed. Furthermore, the "Others" application segment, encompassing specialized niches like medical equipment and transportation, is demonstrating promising growth, indicating a broadening scope of adoption. The continuous innovation in optical relays, offering galvanic isolation and high-speed switching, is also contributing to market diversification and increased demand. The historical period (2019-2024) has laid a strong foundation for this upward trajectory, with consistent year-on-year growth driven by industrial upgrades and the increasing adoption of automation technologies. The base year of 2025 marks a significant inflection point, with market stakeholders anticipating accelerated adoption driven by emerging technological capabilities and a more widespread understanding of the benefits of non-contact relay solutions.
Dominant Regions, Countries, or Segments in Non-contact Relays
The Industrial Automation application segment is unequivocally the dominant force driving growth in the global Non-contact Relays market. In 2025, this segment is estimated to command a market share of approximately 38%, valued at $2,128 million, and is projected to expand robustly throughout the forecast period. The pervasive adoption of automation across manufacturing, processing, and logistics industries worldwide necessitates highly reliable and efficient switching components, making non-contact relays indispensable. Countries within North America, particularly the United States and Canada, are leading the charge in adopting these advanced relay technologies, driven by robust industrial bases and significant investments in Industry 4.0 initiatives. The estimated market size for Non-contact Relays in North America in 2025 is $1,680 million. Key drivers in this region include government policies encouraging industrial modernization, the presence of leading manufacturers like Panasonic and TE Connectivity, and a strong emphasis on operational efficiency and predictive maintenance.
Solid State Relays (SSR) are the most significant type of non-contact relay, representing an estimated 62% of the market share in 2025, with a market value of $3,472 million. Their dominance stems from their unparalleled advantages in applications demanding frequent switching, precise control, and longevity. Europe, particularly Germany and the United Kingdom, remains a crucial market for both industrial automation and building automation, contributing significantly to the demand for SSRs. The estimated market size for Non-contact Relays in Europe in 2025 is $1,512 million. Factors contributing to Europe's strong performance include stringent energy efficiency regulations, a mature industrial sector undergoing digital transformation, and the growing smart building trend. Asia Pacific, with countries like China, Japan, and South Korea, is rapidly emerging as a growth powerhouse, driven by its expansive manufacturing capabilities and increasing adoption of automation technologies. The estimated market size for Non-contact Relays in Asia Pacific in 2025 is $1,344 million.
- Dominant Application Segment: Industrial Automation ($2,128 million in 2025).
- Key Drivers: Need for high-speed switching, increased reliability, and reduced maintenance in manufacturing and process industries.
- Growth Potential: Continued expansion driven by Industry 4.0, smart factories, and the demand for continuous operational uptime.
- Dominant Type: Solid State Relays (SSR) ($3,472 million in 2025).
- Key Drivers: Long operational life, no mechanical wear, silent operation, and precise control capabilities.
- Growth Potential: Increasing replacement of electromechanical relays, integration into IoT devices, and demand in high-frequency switching applications.
- Dominant Region: North America ($1,680 million in 2025).
- Key Drivers: Advanced manufacturing infrastructure, proactive government support for automation, and significant R&D investments.
- Growth Potential: Sustained growth driven by reshoring initiatives and the adoption of cutting-edge automation technologies.
Non-contact Relays Product Landscape
The non-contact relays product landscape is characterized by continuous innovation, particularly in the realm of Solid State Relays (SSR) and Optical Relays. Manufacturers are focused on developing highly integrated solutions with enhanced power handling capabilities, faster switching speeds, and improved thermal management. Advanced materials and miniaturization techniques are leading to more compact relay modules that are easier to integrate into existing systems. Optical relays are gaining traction for their excellent galvanic isolation, crucial in sensitive electronic and medical applications, offering high-speed switching without contact wear. Product performance metrics are increasingly emphasizing reliability, energy efficiency, and digital compatibility, aligning with the growing demands of the IoT era. Manufacturers like Omron and TE Connectivity are at the forefront, offering a diverse range of products tailored for applications spanning industrial automation, building controls, and consumer electronics.
Key Drivers, Barriers & Challenges in Non-contact Relays
The non-contact relays market is propelled by several key drivers, including the escalating demand for automation across industries, the need for increased energy efficiency, and the growing adoption of IoT and smart technologies. Technological advancements in semiconductor technology and power electronics are enabling the development of more sophisticated and cost-effective non-contact relay solutions. Government initiatives promoting industrial modernization and energy conservation also contribute significantly to market growth.
Key barriers and challenges facing the non-contact relays market include the higher initial cost of some non-contact relay types compared to traditional electromechanical relays, particularly for lower-end applications. Supply chain disruptions, such as semiconductor shortages, can impact production and lead times. Stringent regulatory compliance for specific industries and the need for specialized technical expertise for integration can also pose challenges. Furthermore, the established presence and familiarity of electromechanical relays in certain sectors can lead to inertia in adoption.
Emerging Opportunities in Non-contact Relays
Emerging opportunities within the non-contact relays sector are abundant, particularly in the rapidly expanding areas of renewable energy infrastructure and electric vehicle (EV) charging systems. The need for highly reliable and efficient switching in solar inverters, wind turbine control systems, and EV charging stations presents a significant growth avenue. The increasing deployment of smart grids and advanced energy management systems also demands sophisticated non-contact relay solutions. Furthermore, the miniaturization trend is opening doors for integration into smaller, more complex electronic devices and wearable technology. The ongoing development of 5G infrastructure and its associated network equipment will also require robust and fast-switching non-contact relays.
Growth Accelerators in the Non-contact Relays Industry
The long-term growth of the non-contact relays industry is being significantly accelerated by disruptive technological breakthroughs, strategic partnerships, and proactive market expansion strategies. The continuous improvement in the performance-to-cost ratio of Solid State Relays (SSR), driven by advancements in semiconductor manufacturing, is a major catalyst. Strategic collaborations between relay manufacturers and industrial automation solution providers are enabling the co-development of integrated systems that cater to specific industry needs. Furthermore, market expansion into emerging economies with rapidly industrializing sectors and increasing investments in infrastructure development is a key growth accelerator. The growing emphasis on sustainability and energy efficiency across global industries is also creating a sustained demand for energy-saving non-contact relay technologies.
Key Players Shaping the Non-contact Relays Market
- Panasonic
- Toshiba
- Phoenix
- SICK
- JUMO GmbH & Co. KG
- JEL SYSTEM
- Omron
- TE Connectivity
- Fujitsu Limited
- Schneider
- Siemens
- Watanabe Electric Industry Co. Ltd.
- CLION ELECTRIC CO.,LTD
- Toward Relays
Notable Milestones in Non-contact Relays Sector
- 2019: Introduction of enhanced high-power density SSRs by Omron, enabling greater efficiency in industrial machinery.
- 2020: TE Connectivity launches new series of solid-state relays optimized for harsh environments and high-temperature applications.
- 2021: Panasonic expands its optical relay portfolio with advanced semiconductor technologies for faster switching speeds and lower power consumption.
- 2022: Siemens introduces intelligent solid-state relays with integrated diagnostics and communication capabilities for smart grid applications.
- 2023: SICK enhances its product offerings with non-contact proximity sensors incorporating advanced relay functions for industrial automation.
- 2024: Fujitsu Limited announces significant advancements in miniaturized optical relays for medical device applications.
In-Depth Non-contact Relays Market Outlook
The non-contact relays market is set for a period of sustained and robust growth, driven by its integral role in enabling advanced automation, energy efficiency, and smart connectivity across diverse industries. The increasing demand for sophisticated switching solutions in sectors like industrial automation, building automation, and electricity power will continue to fuel market expansion. Strategic initiatives by key players, coupled with ongoing technological innovations, are expected to further enhance the performance and cost-effectiveness of non-contact relays, thereby broadening their application scope. Emerging opportunities in renewable energy and electric mobility, alongside the continued integration of IoT, present significant avenues for market players to capitalize on. The outlook remains highly positive, indicating a dynamic and expanding market for non-contact relays.
Non-contact Relays Segmentation
-
1. Application
- 1.1. Industrial Automation
- 1.2. Appliances
- 1.3. Buliding Automation
- 1.4. Electricity Power
- 1.5. Others
-
2. Types
- 2.1. Optical Relays
- 2.2. Solid State Relays(SSR)
Non-contact Relays Segmentation By Geography
-
1. North America
- 1.1. United States
- 1.2. Canada
- 1.3. Mexico
-
2. South America
- 2.1. Brazil
- 2.2. Argentina
- 2.3. Rest of South America
-
3. Europe
- 3.1. United Kingdom
- 3.2. Germany
- 3.3. France
- 3.4. Italy
- 3.5. Spain
- 3.6. Russia
- 3.7. Benelux
- 3.8. Nordics
- 3.9. Rest of Europe
-
4. Middle East & Africa
- 4.1. Turkey
- 4.2. Israel
- 4.3. GCC
- 4.4. North Africa
- 4.5. South Africa
- 4.6. Rest of Middle East & Africa
-
5. Asia Pacific
- 5.1. China
- 5.2. India
- 5.3. Japan
- 5.4. South Korea
- 5.5. ASEAN
- 5.6. Oceania
- 5.7. Rest of Asia Pacific
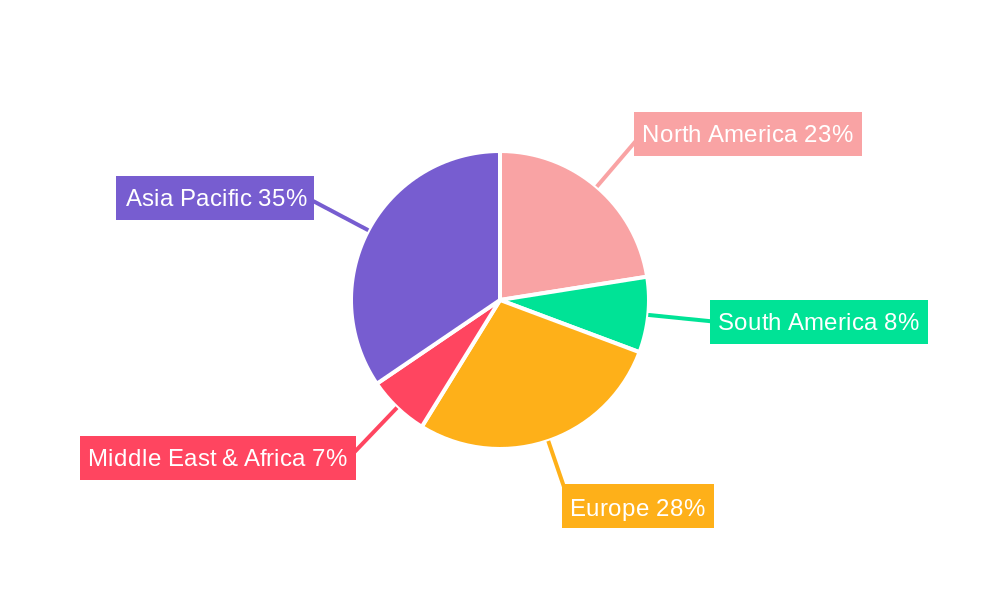
Non-contact Relays Regional Market Share
Geographic Coverage of Non-contact Relays
Non-contact Relays REPORT HIGHLIGHTS
| Aspects | Details |
|---|---|
| Study Period | 2020-2034 |
| Base Year | 2025 |
| Estimated Year | 2026 |
| Forecast Period | 2026-2034 |
| Historical Period | 2020-2025 |
| Growth Rate | CAGR of 7.416% from 2020-2034 |
| Segmentation |
|
Table of Contents
- 1. Introduction
- 1.1. Research Scope
- 1.2. Market Segmentation
- 1.3. Research Objective
- 1.4. Definitions and Assumptions
- 2. Executive Summary
- 2.1. Market Snapshot
- 3. Market Dynamics
- 3.1. Market Drivers
- 3.2. Market Restrains
- 3.3. Market Trends
- 3.4. Market Opportunities
- 4. Market Factor Analysis
- 4.1. Porters Five Forces
- 4.1.1. Bargaining Power of Suppliers
- 4.1.2. Bargaining Power of Buyers
- 4.1.3. Threat of New Entrants
- 4.1.4. Threat of Substitutes
- 4.1.5. Competitive Rivalry
- 4.2. PESTEL analysis
- 4.3. BCG Analysis
- 4.3.1. Stars (High Growth, High Market Share)
- 4.3.2. Cash Cows (Low Growth, High Market Share)
- 4.3.3. Question Mark (High Growth, Low Market Share)
- 4.3.4. Dogs (Low Growth, Low Market Share)
- 4.4. Ansoff Matrix Analysis
- 4.5. Supply Chain Analysis
- 4.6. Regulatory Landscape
- 4.7. Current Market Potential and Opportunity Assessment (TAM–SAM–SOM Framework)
- 4.8. NRP Analyst Note
- 4.1. Porters Five Forces
- 5. Market Analysis, Insights and Forecast 2021-2033
- 5.1. Market Analysis, Insights and Forecast - by Application
- 5.1.1. Industrial Automation
- 5.1.2. Appliances
- 5.1.3. Buliding Automation
- 5.1.4. Electricity Power
- 5.1.5. Others
- 5.2. Market Analysis, Insights and Forecast - by Types
- 5.2.1. Optical Relays
- 5.2.2. Solid State Relays(SSR)
- 5.3. Market Analysis, Insights and Forecast - by Region
- 5.3.1. North America
- 5.3.2. South America
- 5.3.3. Europe
- 5.3.4. Middle East & Africa
- 5.3.5. Asia Pacific
- 5.1. Market Analysis, Insights and Forecast - by Application
- 6. Global Non-contact Relays Analysis, Insights and Forecast, 2021-2033
- 6.1. Market Analysis, Insights and Forecast - by Application
- 6.1.1. Industrial Automation
- 6.1.2. Appliances
- 6.1.3. Buliding Automation
- 6.1.4. Electricity Power
- 6.1.5. Others
- 6.2. Market Analysis, Insights and Forecast - by Types
- 6.2.1. Optical Relays
- 6.2.2. Solid State Relays(SSR)
- 6.1. Market Analysis, Insights and Forecast - by Application
- 7. North America Non-contact Relays Analysis, Insights and Forecast, 2020-2032
- 7.1. Market Analysis, Insights and Forecast - by Application
- 7.1.1. Industrial Automation
- 7.1.2. Appliances
- 7.1.3. Buliding Automation
- 7.1.4. Electricity Power
- 7.1.5. Others
- 7.2. Market Analysis, Insights and Forecast - by Types
- 7.2.1. Optical Relays
- 7.2.2. Solid State Relays(SSR)
- 7.1. Market Analysis, Insights and Forecast - by Application
- 8. South America Non-contact Relays Analysis, Insights and Forecast, 2020-2032
- 8.1. Market Analysis, Insights and Forecast - by Application
- 8.1.1. Industrial Automation
- 8.1.2. Appliances
- 8.1.3. Buliding Automation
- 8.1.4. Electricity Power
- 8.1.5. Others
- 8.2. Market Analysis, Insights and Forecast - by Types
- 8.2.1. Optical Relays
- 8.2.2. Solid State Relays(SSR)
- 8.1. Market Analysis, Insights and Forecast - by Application
- 9. Europe Non-contact Relays Analysis, Insights and Forecast, 2020-2032
- 9.1. Market Analysis, Insights and Forecast - by Application
- 9.1.1. Industrial Automation
- 9.1.2. Appliances
- 9.1.3. Buliding Automation
- 9.1.4. Electricity Power
- 9.1.5. Others
- 9.2. Market Analysis, Insights and Forecast - by Types
- 9.2.1. Optical Relays
- 9.2.2. Solid State Relays(SSR)
- 9.1. Market Analysis, Insights and Forecast - by Application
- 10. Middle East & Africa Non-contact Relays Analysis, Insights and Forecast, 2020-2032
- 10.1. Market Analysis, Insights and Forecast - by Application
- 10.1.1. Industrial Automation
- 10.1.2. Appliances
- 10.1.3. Buliding Automation
- 10.1.4. Electricity Power
- 10.1.5. Others
- 10.2. Market Analysis, Insights and Forecast - by Types
- 10.2.1. Optical Relays
- 10.2.2. Solid State Relays(SSR)
- 10.1. Market Analysis, Insights and Forecast - by Application
- 11. Asia Pacific Non-contact Relays Analysis, Insights and Forecast, 2020-2032
- 11.1. Market Analysis, Insights and Forecast - by Application
- 11.1.1. Industrial Automation
- 11.1.2. Appliances
- 11.1.3. Buliding Automation
- 11.1.4. Electricity Power
- 11.1.5. Others
- 11.2. Market Analysis, Insights and Forecast - by Types
- 11.2.1. Optical Relays
- 11.2.2. Solid State Relays(SSR)
- 11.1. Market Analysis, Insights and Forecast - by Application
- 12. Competitive Analysis
- 12.1. Company Profiles
- 12.1.1 Panasonic
- 12.1.1.1. Company Overview
- 12.1.1.2. Products
- 12.1.1.3. Company Financials
- 12.1.1.4. SWOT Analysis
- 12.1.2 Toshiba
- 12.1.2.1. Company Overview
- 12.1.2.2. Products
- 12.1.2.3. Company Financials
- 12.1.2.4. SWOT Analysis
- 12.1.3 Phoenix
- 12.1.3.1. Company Overview
- 12.1.3.2. Products
- 12.1.3.3. Company Financials
- 12.1.3.4. SWOT Analysis
- 12.1.4 SICK
- 12.1.4.1. Company Overview
- 12.1.4.2. Products
- 12.1.4.3. Company Financials
- 12.1.4.4. SWOT Analysis
- 12.1.5 JUMO GmbH & Co. KG
- 12.1.5.1. Company Overview
- 12.1.5.2. Products
- 12.1.5.3. Company Financials
- 12.1.5.4. SWOT Analysis
- 12.1.6 JEL SYSTEM
- 12.1.6.1. Company Overview
- 12.1.6.2. Products
- 12.1.6.3. Company Financials
- 12.1.6.4. SWOT Analysis
- 12.1.7 Omron
- 12.1.7.1. Company Overview
- 12.1.7.2. Products
- 12.1.7.3. Company Financials
- 12.1.7.4. SWOT Analysis
- 12.1.8 TE Connectivity
- 12.1.8.1. Company Overview
- 12.1.8.2. Products
- 12.1.8.3. Company Financials
- 12.1.8.4. SWOT Analysis
- 12.1.9 Fujitsu Limited
- 12.1.9.1. Company Overview
- 12.1.9.2. Products
- 12.1.9.3. Company Financials
- 12.1.9.4. SWOT Analysis
- 12.1.10 Schneider
- 12.1.10.1. Company Overview
- 12.1.10.2. Products
- 12.1.10.3. Company Financials
- 12.1.10.4. SWOT Analysis
- 12.1.11 Siemens
- 12.1.11.1. Company Overview
- 12.1.11.2. Products
- 12.1.11.3. Company Financials
- 12.1.11.4. SWOT Analysis
- 12.1.12 Watanabe Electric Industry Co. Ltd.
- 12.1.12.1. Company Overview
- 12.1.12.2. Products
- 12.1.12.3. Company Financials
- 12.1.12.4. SWOT Analysis
- 12.1.13 CLION ELECTRIC CO.
- 12.1.13.1. Company Overview
- 12.1.13.2. Products
- 12.1.13.3. Company Financials
- 12.1.13.4. SWOT Analysis
- 12.1.14 LTD
- 12.1.14.1. Company Overview
- 12.1.14.2. Products
- 12.1.14.3. Company Financials
- 12.1.14.4. SWOT Analysis
- 12.1.15 Toward Relays
- 12.1.15.1. Company Overview
- 12.1.15.2. Products
- 12.1.15.3. Company Financials
- 12.1.15.4. SWOT Analysis
- 12.1.1 Panasonic
- 12.2. Market Entropy
- 12.2.1 Company's Key Areas Served
- 12.2.2 Recent Developments
- 12.3. Company Market Share Analysis 2025
- 12.3.1 Top 5 Companies Market Share Analysis
- 12.3.2 Top 3 Companies Market Share Analysis
- 12.4. List of Potential Customers
- 13. Research Methodology
List of Figures
- Figure 1: Global Non-contact Relays Revenue Breakdown (billion, %) by Region 2025 & 2033
- Figure 2: Global Non-contact Relays Volume Breakdown (K, %) by Region 2025 & 2033
- Figure 3: North America Non-contact Relays Revenue (billion), by Application 2025 & 2033
- Figure 4: North America Non-contact Relays Volume (K), by Application 2025 & 2033
- Figure 5: North America Non-contact Relays Revenue Share (%), by Application 2025 & 2033
- Figure 6: North America Non-contact Relays Volume Share (%), by Application 2025 & 2033
- Figure 7: North America Non-contact Relays Revenue (billion), by Types 2025 & 2033
- Figure 8: North America Non-contact Relays Volume (K), by Types 2025 & 2033
- Figure 9: North America Non-contact Relays Revenue Share (%), by Types 2025 & 2033
- Figure 10: North America Non-contact Relays Volume Share (%), by Types 2025 & 2033
- Figure 11: North America Non-contact Relays Revenue (billion), by Country 2025 & 2033
- Figure 12: North America Non-contact Relays Volume (K), by Country 2025 & 2033
- Figure 13: North America Non-contact Relays Revenue Share (%), by Country 2025 & 2033
- Figure 14: North America Non-contact Relays Volume Share (%), by Country 2025 & 2033
- Figure 15: South America Non-contact Relays Revenue (billion), by Application 2025 & 2033
- Figure 16: South America Non-contact Relays Volume (K), by Application 2025 & 2033
- Figure 17: South America Non-contact Relays Revenue Share (%), by Application 2025 & 2033
- Figure 18: South America Non-contact Relays Volume Share (%), by Application 2025 & 2033
- Figure 19: South America Non-contact Relays Revenue (billion), by Types 2025 & 2033
- Figure 20: South America Non-contact Relays Volume (K), by Types 2025 & 2033
- Figure 21: South America Non-contact Relays Revenue Share (%), by Types 2025 & 2033
- Figure 22: South America Non-contact Relays Volume Share (%), by Types 2025 & 2033
- Figure 23: South America Non-contact Relays Revenue (billion), by Country 2025 & 2033
- Figure 24: South America Non-contact Relays Volume (K), by Country 2025 & 2033
- Figure 25: South America Non-contact Relays Revenue Share (%), by Country 2025 & 2033
- Figure 26: South America Non-contact Relays Volume Share (%), by Country 2025 & 2033
- Figure 27: Europe Non-contact Relays Revenue (billion), by Application 2025 & 2033
- Figure 28: Europe Non-contact Relays Volume (K), by Application 2025 & 2033
- Figure 29: Europe Non-contact Relays Revenue Share (%), by Application 2025 & 2033
- Figure 30: Europe Non-contact Relays Volume Share (%), by Application 2025 & 2033
- Figure 31: Europe Non-contact Relays Revenue (billion), by Types 2025 & 2033
- Figure 32: Europe Non-contact Relays Volume (K), by Types 2025 & 2033
- Figure 33: Europe Non-contact Relays Revenue Share (%), by Types 2025 & 2033
- Figure 34: Europe Non-contact Relays Volume Share (%), by Types 2025 & 2033
- Figure 35: Europe Non-contact Relays Revenue (billion), by Country 2025 & 2033
- Figure 36: Europe Non-contact Relays Volume (K), by Country 2025 & 2033
- Figure 37: Europe Non-contact Relays Revenue Share (%), by Country 2025 & 2033
- Figure 38: Europe Non-contact Relays Volume Share (%), by Country 2025 & 2033
- Figure 39: Middle East & Africa Non-contact Relays Revenue (billion), by Application 2025 & 2033
- Figure 40: Middle East & Africa Non-contact Relays Volume (K), by Application 2025 & 2033
- Figure 41: Middle East & Africa Non-contact Relays Revenue Share (%), by Application 2025 & 2033
- Figure 42: Middle East & Africa Non-contact Relays Volume Share (%), by Application 2025 & 2033
- Figure 43: Middle East & Africa Non-contact Relays Revenue (billion), by Types 2025 & 2033
- Figure 44: Middle East & Africa Non-contact Relays Volume (K), by Types 2025 & 2033
- Figure 45: Middle East & Africa Non-contact Relays Revenue Share (%), by Types 2025 & 2033
- Figure 46: Middle East & Africa Non-contact Relays Volume Share (%), by Types 2025 & 2033
- Figure 47: Middle East & Africa Non-contact Relays Revenue (billion), by Country 2025 & 2033
- Figure 48: Middle East & Africa Non-contact Relays Volume (K), by Country 2025 & 2033
- Figure 49: Middle East & Africa Non-contact Relays Revenue Share (%), by Country 2025 & 2033
- Figure 50: Middle East & Africa Non-contact Relays Volume Share (%), by Country 2025 & 2033
- Figure 51: Asia Pacific Non-contact Relays Revenue (billion), by Application 2025 & 2033
- Figure 52: Asia Pacific Non-contact Relays Volume (K), by Application 2025 & 2033
- Figure 53: Asia Pacific Non-contact Relays Revenue Share (%), by Application 2025 & 2033
- Figure 54: Asia Pacific Non-contact Relays Volume Share (%), by Application 2025 & 2033
- Figure 55: Asia Pacific Non-contact Relays Revenue (billion), by Types 2025 & 2033
- Figure 56: Asia Pacific Non-contact Relays Volume (K), by Types 2025 & 2033
- Figure 57: Asia Pacific Non-contact Relays Revenue Share (%), by Types 2025 & 2033
- Figure 58: Asia Pacific Non-contact Relays Volume Share (%), by Types 2025 & 2033
- Figure 59: Asia Pacific Non-contact Relays Revenue (billion), by Country 2025 & 2033
- Figure 60: Asia Pacific Non-contact Relays Volume (K), by Country 2025 & 2033
- Figure 61: Asia Pacific Non-contact Relays Revenue Share (%), by Country 2025 & 2033
- Figure 62: Asia Pacific Non-contact Relays Volume Share (%), by Country 2025 & 2033
List of Tables
- Table 1: Global Non-contact Relays Revenue billion Forecast, by Application 2020 & 2033
- Table 2: Global Non-contact Relays Volume K Forecast, by Application 2020 & 2033
- Table 3: Global Non-contact Relays Revenue billion Forecast, by Types 2020 & 2033
- Table 4: Global Non-contact Relays Volume K Forecast, by Types 2020 & 2033
- Table 5: Global Non-contact Relays Revenue billion Forecast, by Region 2020 & 2033
- Table 6: Global Non-contact Relays Volume K Forecast, by Region 2020 & 2033
- Table 7: Global Non-contact Relays Revenue billion Forecast, by Application 2020 & 2033
- Table 8: Global Non-contact Relays Volume K Forecast, by Application 2020 & 2033
- Table 9: Global Non-contact Relays Revenue billion Forecast, by Types 2020 & 2033
- Table 10: Global Non-contact Relays Volume K Forecast, by Types 2020 & 2033
- Table 11: Global Non-contact Relays Revenue billion Forecast, by Country 2020 & 2033
- Table 12: Global Non-contact Relays Volume K Forecast, by Country 2020 & 2033
- Table 13: United States Non-contact Relays Revenue (billion) Forecast, by Application 2020 & 2033
- Table 14: United States Non-contact Relays Volume (K) Forecast, by Application 2020 & 2033
- Table 15: Canada Non-contact Relays Revenue (billion) Forecast, by Application 2020 & 2033
- Table 16: Canada Non-contact Relays Volume (K) Forecast, by Application 2020 & 2033
- Table 17: Mexico Non-contact Relays Revenue (billion) Forecast, by Application 2020 & 2033
- Table 18: Mexico Non-contact Relays Volume (K) Forecast, by Application 2020 & 2033
- Table 19: Global Non-contact Relays Revenue billion Forecast, by Application 2020 & 2033
- Table 20: Global Non-contact Relays Volume K Forecast, by Application 2020 & 2033
- Table 21: Global Non-contact Relays Revenue billion Forecast, by Types 2020 & 2033
- Table 22: Global Non-contact Relays Volume K Forecast, by Types 2020 & 2033
- Table 23: Global Non-contact Relays Revenue billion Forecast, by Country 2020 & 2033
- Table 24: Global Non-contact Relays Volume K Forecast, by Country 2020 & 2033
- Table 25: Brazil Non-contact Relays Revenue (billion) Forecast, by Application 2020 & 2033
- Table 26: Brazil Non-contact Relays Volume (K) Forecast, by Application 2020 & 2033
- Table 27: Argentina Non-contact Relays Revenue (billion) Forecast, by Application 2020 & 2033
- Table 28: Argentina Non-contact Relays Volume (K) Forecast, by Application 2020 & 2033
- Table 29: Rest of South America Non-contact Relays Revenue (billion) Forecast, by Application 2020 & 2033
- Table 30: Rest of South America Non-contact Relays Volume (K) Forecast, by Application 2020 & 2033
- Table 31: Global Non-contact Relays Revenue billion Forecast, by Application 2020 & 2033
- Table 32: Global Non-contact Relays Volume K Forecast, by Application 2020 & 2033
- Table 33: Global Non-contact Relays Revenue billion Forecast, by Types 2020 & 2033
- Table 34: Global Non-contact Relays Volume K Forecast, by Types 2020 & 2033
- Table 35: Global Non-contact Relays Revenue billion Forecast, by Country 2020 & 2033
- Table 36: Global Non-contact Relays Volume K Forecast, by Country 2020 & 2033
- Table 37: United Kingdom Non-contact Relays Revenue (billion) Forecast, by Application 2020 & 2033
- Table 38: United Kingdom Non-contact Relays Volume (K) Forecast, by Application 2020 & 2033
- Table 39: Germany Non-contact Relays Revenue (billion) Forecast, by Application 2020 & 2033
- Table 40: Germany Non-contact Relays Volume (K) Forecast, by Application 2020 & 2033
- Table 41: France Non-contact Relays Revenue (billion) Forecast, by Application 2020 & 2033
- Table 42: France Non-contact Relays Volume (K) Forecast, by Application 2020 & 2033
- Table 43: Italy Non-contact Relays Revenue (billion) Forecast, by Application 2020 & 2033
- Table 44: Italy Non-contact Relays Volume (K) Forecast, by Application 2020 & 2033
- Table 45: Spain Non-contact Relays Revenue (billion) Forecast, by Application 2020 & 2033
- Table 46: Spain Non-contact Relays Volume (K) Forecast, by Application 2020 & 2033
- Table 47: Russia Non-contact Relays Revenue (billion) Forecast, by Application 2020 & 2033
- Table 48: Russia Non-contact Relays Volume (K) Forecast, by Application 2020 & 2033
- Table 49: Benelux Non-contact Relays Revenue (billion) Forecast, by Application 2020 & 2033
- Table 50: Benelux Non-contact Relays Volume (K) Forecast, by Application 2020 & 2033
- Table 51: Nordics Non-contact Relays Revenue (billion) Forecast, by Application 2020 & 2033
- Table 52: Nordics Non-contact Relays Volume (K) Forecast, by Application 2020 & 2033
- Table 53: Rest of Europe Non-contact Relays Revenue (billion) Forecast, by Application 2020 & 2033
- Table 54: Rest of Europe Non-contact Relays Volume (K) Forecast, by Application 2020 & 2033
- Table 55: Global Non-contact Relays Revenue billion Forecast, by Application 2020 & 2033
- Table 56: Global Non-contact Relays Volume K Forecast, by Application 2020 & 2033
- Table 57: Global Non-contact Relays Revenue billion Forecast, by Types 2020 & 2033
- Table 58: Global Non-contact Relays Volume K Forecast, by Types 2020 & 2033
- Table 59: Global Non-contact Relays Revenue billion Forecast, by Country 2020 & 2033
- Table 60: Global Non-contact Relays Volume K Forecast, by Country 2020 & 2033
- Table 61: Turkey Non-contact Relays Revenue (billion) Forecast, by Application 2020 & 2033
- Table 62: Turkey Non-contact Relays Volume (K) Forecast, by Application 2020 & 2033
- Table 63: Israel Non-contact Relays Revenue (billion) Forecast, by Application 2020 & 2033
- Table 64: Israel Non-contact Relays Volume (K) Forecast, by Application 2020 & 2033
- Table 65: GCC Non-contact Relays Revenue (billion) Forecast, by Application 2020 & 2033
- Table 66: GCC Non-contact Relays Volume (K) Forecast, by Application 2020 & 2033
- Table 67: North Africa Non-contact Relays Revenue (billion) Forecast, by Application 2020 & 2033
- Table 68: North Africa Non-contact Relays Volume (K) Forecast, by Application 2020 & 2033
- Table 69: South Africa Non-contact Relays Revenue (billion) Forecast, by Application 2020 & 2033
- Table 70: South Africa Non-contact Relays Volume (K) Forecast, by Application 2020 & 2033
- Table 71: Rest of Middle East & Africa Non-contact Relays Revenue (billion) Forecast, by Application 2020 & 2033
- Table 72: Rest of Middle East & Africa Non-contact Relays Volume (K) Forecast, by Application 2020 & 2033
- Table 73: Global Non-contact Relays Revenue billion Forecast, by Application 2020 & 2033
- Table 74: Global Non-contact Relays Volume K Forecast, by Application 2020 & 2033
- Table 75: Global Non-contact Relays Revenue billion Forecast, by Types 2020 & 2033
- Table 76: Global Non-contact Relays Volume K Forecast, by Types 2020 & 2033
- Table 77: Global Non-contact Relays Revenue billion Forecast, by Country 2020 & 2033
- Table 78: Global Non-contact Relays Volume K Forecast, by Country 2020 & 2033
- Table 79: China Non-contact Relays Revenue (billion) Forecast, by Application 2020 & 2033
- Table 80: China Non-contact Relays Volume (K) Forecast, by Application 2020 & 2033
- Table 81: India Non-contact Relays Revenue (billion) Forecast, by Application 2020 & 2033
- Table 82: India Non-contact Relays Volume (K) Forecast, by Application 2020 & 2033
- Table 83: Japan Non-contact Relays Revenue (billion) Forecast, by Application 2020 & 2033
- Table 84: Japan Non-contact Relays Volume (K) Forecast, by Application 2020 & 2033
- Table 85: South Korea Non-contact Relays Revenue (billion) Forecast, by Application 2020 & 2033
- Table 86: South Korea Non-contact Relays Volume (K) Forecast, by Application 2020 & 2033
- Table 87: ASEAN Non-contact Relays Revenue (billion) Forecast, by Application 2020 & 2033
- Table 88: ASEAN Non-contact Relays Volume (K) Forecast, by Application 2020 & 2033
- Table 89: Oceania Non-contact Relays Revenue (billion) Forecast, by Application 2020 & 2033
- Table 90: Oceania Non-contact Relays Volume (K) Forecast, by Application 2020 & 2033
- Table 91: Rest of Asia Pacific Non-contact Relays Revenue (billion) Forecast, by Application 2020 & 2033
- Table 92: Rest of Asia Pacific Non-contact Relays Volume (K) Forecast, by Application 2020 & 2033
Frequently Asked Questions
1. What is the projected Compound Annual Growth Rate (CAGR) of the Non-contact Relays?
The projected CAGR is approximately 7.416%.
2. Which companies are prominent players in the Non-contact Relays?
Key companies in the market include Panasonic, Toshiba, Phoenix, SICK, JUMO GmbH & Co. KG, JEL SYSTEM, Omron, TE Connectivity, Fujitsu Limited, Schneider, Siemens, Watanabe Electric Industry Co. Ltd., CLION ELECTRIC CO., LTD, Toward Relays.
3. What are the main segments of the Non-contact Relays?
The market segments include Application, Types.
4. Can you provide details about the market size?
The market size is estimated to be USD 10.28 billion as of 2022.
5. What are some drivers contributing to market growth?
N/A
6. What are the notable trends driving market growth?
N/A
7. Are there any restraints impacting market growth?
N/A
8. Can you provide examples of recent developments in the market?
N/A
9. What pricing options are available for accessing the report?
Pricing options include single-user, multi-user, and enterprise licenses priced at USD 3350.00, USD 5025.00, and USD 6700.00 respectively.
10. Is the market size provided in terms of value or volume?
The market size is provided in terms of value, measured in billion and volume, measured in K.
11. Are there any specific market keywords associated with the report?
Yes, the market keyword associated with the report is "Non-contact Relays," which aids in identifying and referencing the specific market segment covered.
12. How do I determine which pricing option suits my needs best?
The pricing options vary based on user requirements and access needs. Individual users may opt for single-user licenses, while businesses requiring broader access may choose multi-user or enterprise licenses for cost-effective access to the report.
13. Are there any additional resources or data provided in the Non-contact Relays report?
While the report offers comprehensive insights, it's advisable to review the specific contents or supplementary materials provided to ascertain if additional resources or data are available.
14. How can I stay updated on further developments or reports in the Non-contact Relays?
To stay informed about further developments, trends, and reports in the Non-contact Relays, consider subscribing to industry newsletters, following relevant companies and organizations, or regularly checking reputable industry news sources and publications.
Methodology
Step 1 - Identification of Relevant Samples Size from Population Database


Step 2 - Approaches for Defining Global Market Size (Value, Volume* & Price*)

Note*: In applicable scenarios
Step 3 - Data Sources
Primary Research
- Web Analytics
- Survey Reports
- Research Institute
- Latest Research Reports
- Opinion Leaders
Secondary Research
- Annual Reports
- White Paper
- Latest Press Release
- Industry Association
- Paid Database
- Investor Presentations

Step 4 - Data Triangulation
Involves using different sources of information in order to increase the validity of a study
These sources are likely to be stakeholders in a program - participants, other researchers, program staff, other community members, and so on.
Then we put all data in single framework & apply various statistical tools to find out the dynamic on the market.
During the analysis stage, feedback from the stakeholder groups would be compared to determine areas of agreement as well as areas of divergence