

Key Insights
The North America amusement park market, projected to reach $33.3 billion by 2025, is experiencing substantial growth with a Compound Annual Growth Rate (CAGR) of 29.8% through 2033. This expansion is propelled by rising disposable incomes and a growing demand for experiential entertainment. Continuous innovation, including immersive technologies and new rides, elevates the visitor experience and appeals to a broad demographic. Integrated offerings through partnerships with hotels and resorts bolster revenue. Effective digital marketing strategies, particularly on social media, engage younger demographics. Mechanical and water rides remain prominent, with the 19-35 age group showing significant spending. Revenue diversification is evident across ticketing, F&B, and merchandise. While economic fluctuations pose a potential restraint, the industry's adaptability and focus on customer experience are expected to mitigate risks. The United States leads the market, followed by Canada and Mexico.
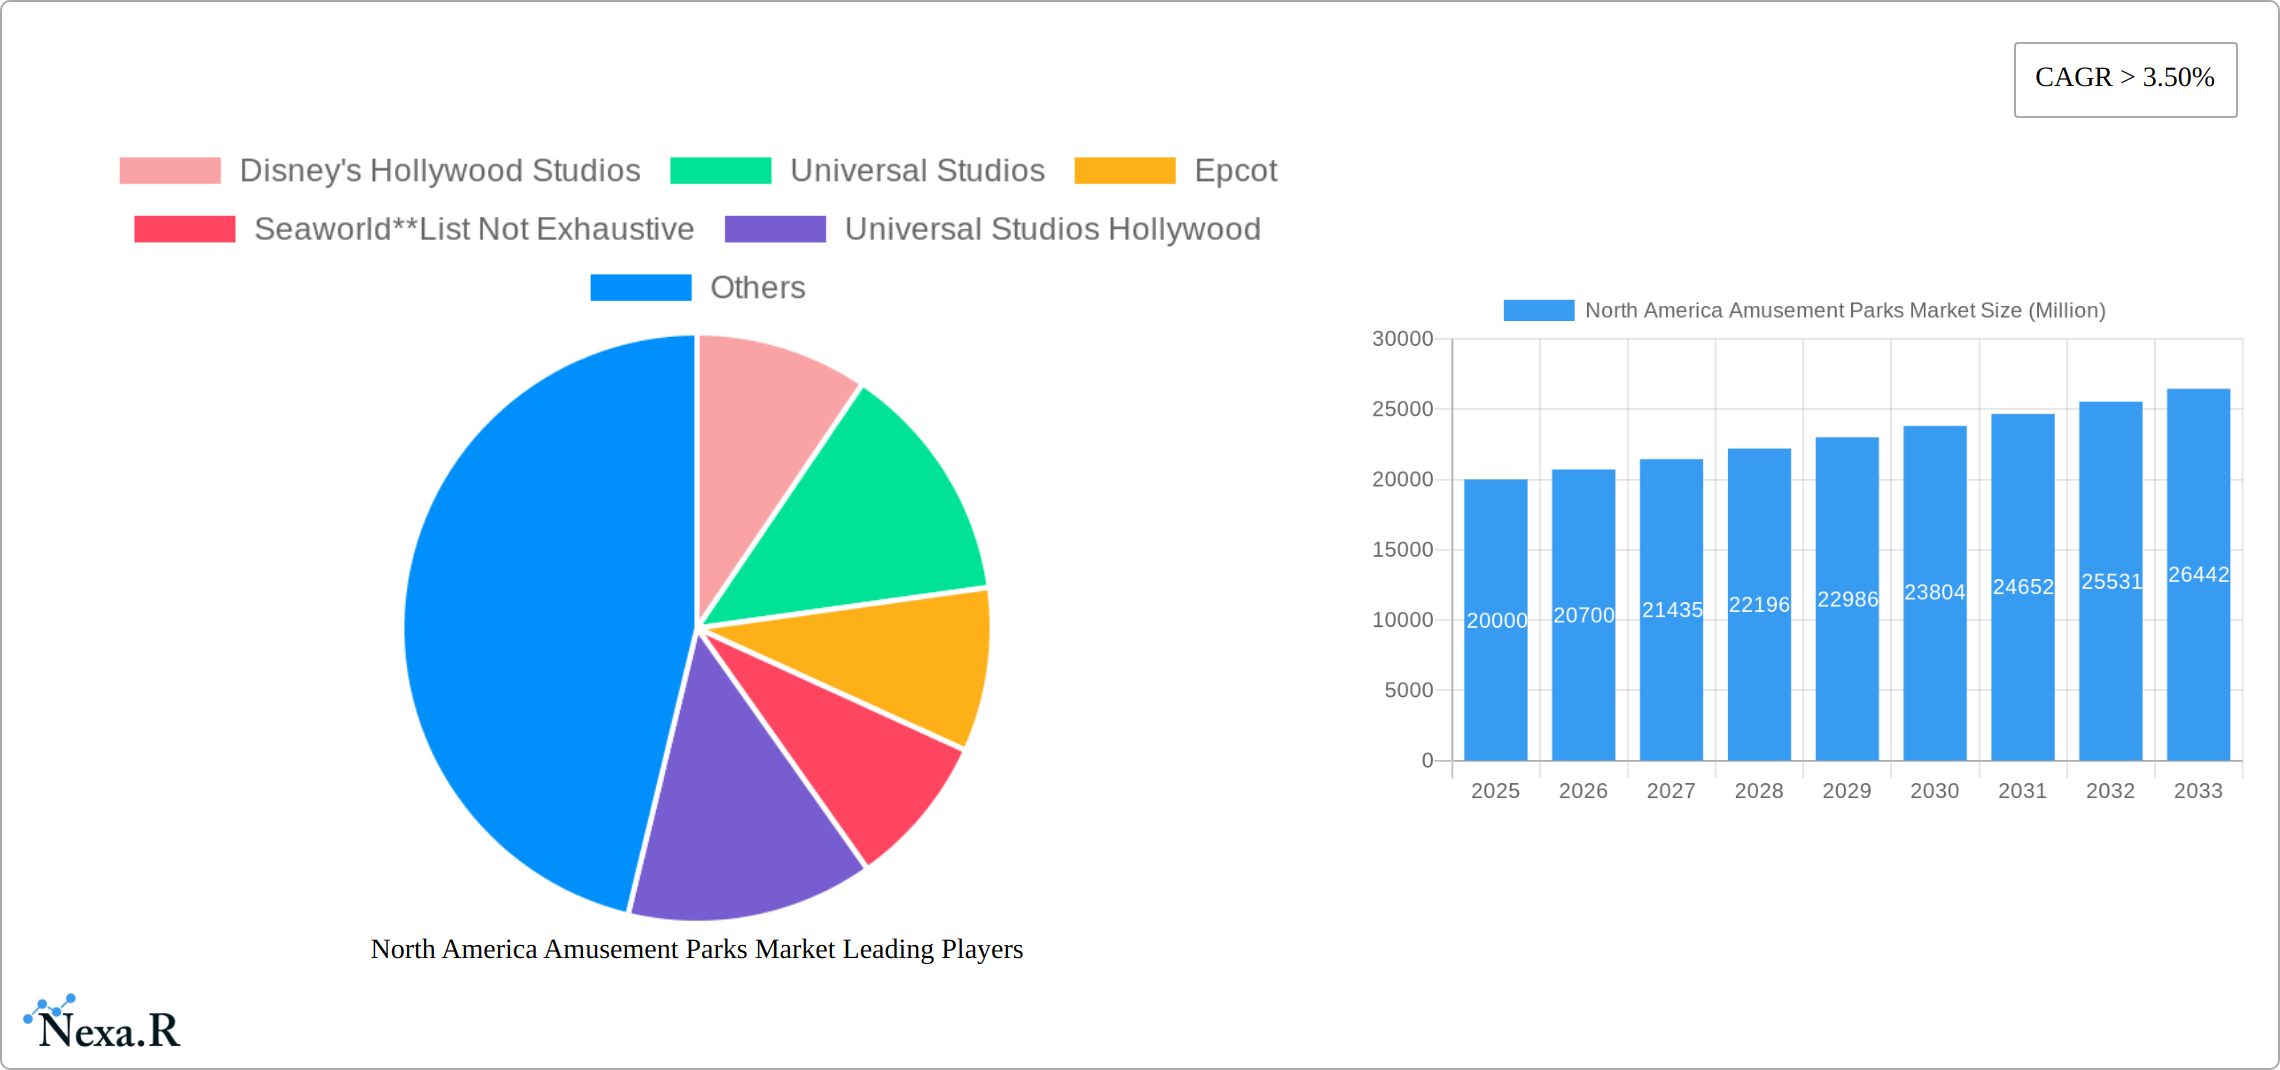
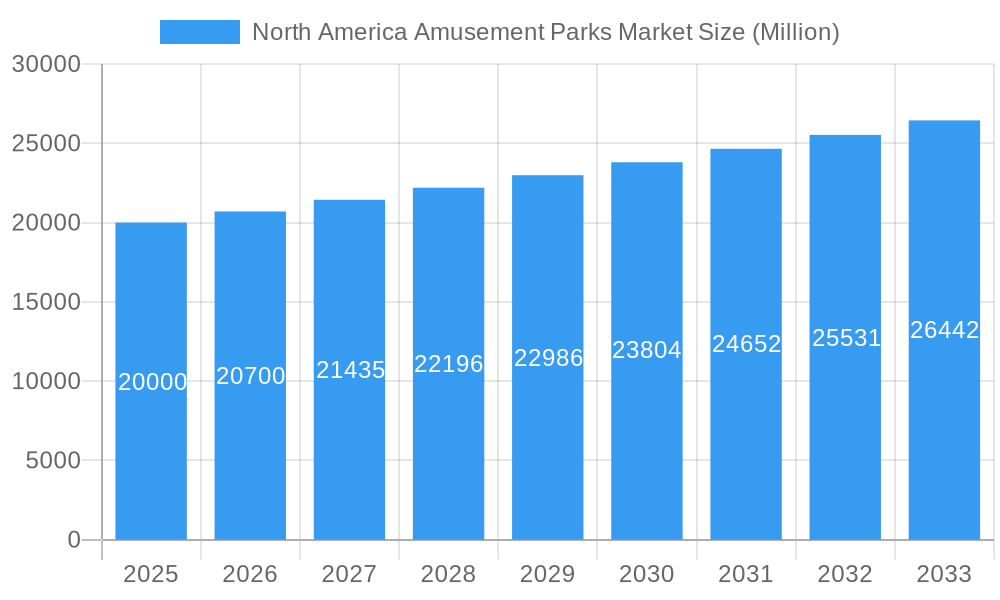
North America Amusement Parks Market Market Size (In Billion)
Key challenges include upholding stringent safety standards and addressing environmental sustainability. Intense competition from major players like Disney, Universal Studios, and SeaWorld necessitates ongoing investment in innovation and unique attractions. Fluctuations in tourism due to global events and economic conditions can impact visitor numbers. Market success hinges on efficient cost management, enhanced guest experiences, and agility in adapting to evolving consumer preferences. Strategic acquisitions, international collaborations, and technological advancements will drive future market expansion.
North America Amusement Parks Market Company Market Share
North America Amusement Parks Market: A Comprehensive Report (2019-2033)
This in-depth report provides a comprehensive analysis of the North America amusement parks market, encompassing market dynamics, growth trends, key segments, and future outlook. The study period covers 2019-2033, with 2025 as the base year and a forecast period of 2025-2033. The report is essential for industry professionals, investors, and anyone seeking a detailed understanding of this dynamic sector. Market values are presented in million units.
North America Amusement Parks Market Dynamics & Structure
The North American amusement park market is characterized by high competition, rapid technological advancements, and evolving consumer preferences. Market concentration is moderate, with a few major players holding significant market share, while numerous smaller regional parks contribute substantially to the overall market. Technological innovation is a key driver, with advancements in ride technology, immersive experiences, and digital ticketing systems influencing consumer experiences. Regulatory frameworks related to safety, accessibility, and environmental impact significantly shape market operations. Competitive product substitutes, such as gaming, home entertainment, and other leisure activities, constantly exert pressure. End-user demographics are crucial, with family-oriented parks appealing to a wide range of ages, while some parks cater to specific age groups. The market is also marked by mergers and acquisitions (M&A) activity, with larger players consolidating their market positions.
- Market Concentration: Moderate, with a few major players commanding a significant share (estimated xx%).
- Technological Innovation: Significant driver, focused on enhancing ride experiences and efficiency. Innovation barriers include high capital investment and safety regulations.
- Regulatory Framework: Stringent safety standards and environmental regulations impact operations and expansion.
- Competitive Substitutes: Gaming, home entertainment, and other leisure activities compete for consumer spending.
- End-User Demographics: Diverse age groups, with specific parks catering to family, youth, or adult demographics.
- M&A Activity: Consistent M&A activity, driven by consolidation and market expansion strategies (xx deals recorded between 2019-2024).
North America Amusement Parks Market Growth Trends & Insights
The North American amusement park market demonstrated robust growth from 2019 to 2024, fueled by a confluence of factors including rising disposable incomes, a surge in tourism, and the introduction of innovative park offerings. While the COVID-19 pandemic caused a temporary disruption, the sector has shown a remarkable recovery and continues its upward trajectory. The integration of cutting-edge technologies, such as virtual reality (VR) and augmented reality (AR) experiences, is significantly enhancing consumer engagement and driving market expansion. A notable shift in consumer behavior towards immersive and personalized experiences is prompting park operators to invest heavily in technologically advanced attractions and tailored services. This trend, coupled with the rising number of tourists, increased urbanization, improving economic conditions, and the development of new parks and attractions, positions the market for sustained growth in the coming years.
- Market Size (2024): xx Million
- CAGR (2019-2024): xx%
- Market Penetration (2024): xx%
- Projected Market Size (2033): xx Million
- Technological Disruption: VR/AR integration, AI-powered personalization, contactless ticketing, and data-driven optimization are key drivers of growth.
- Consumer Behavior Shift: Demand for unique, immersive, and highly personalized experiences; increased focus on convenience and seamless transactions.
Dominant Regions, Countries, or Segments in North America Amusement Parks Market
The United States constitutes the dominant market for amusement parks in North America, attributable to a high concentration of major theme parks, substantial tourist arrivals, and considerable disposable income among its population. Within the U.S., Florida and California stand out as particularly robust markets, home to some of the world's most renowned and frequently visited theme parks. Analyzing the market by segment, the "Up to 18 years" age group commands the largest market share, largely driven by family outings and school trips. From a rides perspective, mechanical and water rides maintain their popularity and represent the most lucrative categories. While ticket sales remain the primary revenue source, substantial contributions to overall profitability are also derived from food and beverage sales, merchandise, and hotel/resort revenues.
- Dominant Region: United States (Market Share: xx%)
- Dominant Country: United States (Market Share: xx%)
- Dominant Segment (By Age): Up to 18 years (Market Share: xx%)
- Dominant Segment (By Rides): Mechanical Rides & Water Rides (Market Share: xx%)
- Dominant Segment (By Revenue): Tickets (Market Share: xx%)
- Key Drivers: High tourism, rising disposable incomes, robust infrastructure, favorable government policies, and strategic partnerships between entertainment companies and park operators.
North America Amusement Parks Market Product Landscape
The amusement park industry is constantly innovating, introducing new and technologically advanced rides and experiences. These innovations range from virtual reality roller coasters to interactive dark rides, emphasizing immersive and personalized entertainment. Key performance indicators (KPIs) include visitor attendance, average spending per visitor, and customer satisfaction rates. Unique selling propositions often focus on creating unique and memorable experiences, emphasizing storytelling and technological integration.
Key Drivers, Barriers & Challenges in North America Amusement Parks Market
Key Drivers: Technological advancements (VR/AR integration, improved ride technology, AI-driven personalization), increasing disposable incomes, growing tourism, and government support for tourism infrastructure. Strategic partnerships between entertainment companies and park operators are also significant growth catalysts. The increasing focus on creating memorable and personalized experiences is also a key driver.
Key Challenges: High initial capital investment for new rides and infrastructure, stringent safety regulations, intense competition from alternative leisure activities, potential economic downturns impacting consumer spending, evolving consumer preferences and demands, and the susceptibility to supply chain disruptions impacting the availability of components and materials. Seasonality and weather conditions can also present significant operational challenges.
Emerging Opportunities in North America Amusement Parks Market
Significant opportunities exist in the development and delivery of personalized experiences leveraging technology to offer customized attractions and services. Untapped markets in smaller cities and regions present attractive prospects for smaller-scale, niche parks. The incorporation of sustainable practices into park operations aligns with growing environmental consciousness among consumers and offers a competitive advantage. The use of data analytics to optimize operations and enhance the visitor experience is another promising avenue for growth.
Growth Accelerators in the North America Amusement Parks Market Industry
Long-term growth will be driven by continued technological advancements creating immersive and interactive experiences, strategic partnerships leading to cross-promotional opportunities and expansion into new markets, and robust investments in infrastructure to cater to growing tourism.
Key Players Shaping the North America Amusement Parks Market Market
- Disney's Hollywood Studios
- Universal Studios Hollywood
- Universal Studios Orlando
- Epcot
- Seaworld
- Magic Kingdom
- Disney's Animal Kingdom
- Disney's California Adventure
- Islands of Adventure
- Disneyland
- List Not Exhaustive
Notable Milestones in North America Amusement Parks Market Sector
- July 2022: Five Star Parks & Attractions acquired three Malibu Jack's Indoor Theme Parks, signifying consolidation within the indoor theme park segment.
- January 2023: Delaware North expanded into the parks and lodging sector via the acquisition of Best Western Premier Grand Canyon Squire Inn, demonstrating the increasing integration of hospitality within the amusement park ecosystem.
- [Add other recent notable milestones here, with dates and brief descriptions]
In-Depth North America Amusement Parks Market Market Outlook
The North America amusement park market is poised for sustained growth over the forecast period. Continued technological innovation, strategic partnerships, and expansion into new markets will propel the industry forward. Strategic investments in creating unique and memorable experiences, coupled with effective marketing and customer engagement strategies, will be vital for success. The focus on delivering personalized and immersive experiences, alongside sustainable operations, will be key differentiators in a competitive landscape.
North America Amusement Parks Market Segmentation
-
1. Rides
- 1.1. Mechanical Rides
- 1.2. Water Rides
- 1.3. Other Rides
-
2. Age
- 2.1. Upto 18 years
- 2.2. 19 to 35 years
- 2.3. 36 to 50 years
- 2.4. 51 to 65 years
- 2.5. More than 65 years
-
3. Revenue
- 3.1. Tickets
- 3.2. Food & Beverages
- 3.3. Merchandise
- 3.4. Hotels/Resorts
- 3.5. Other Revenues
North America Amusement Parks Market Segmentation By Geography
-
1. North America
- 1.1. United States
- 1.2. Canada
- 1.3. Mexico
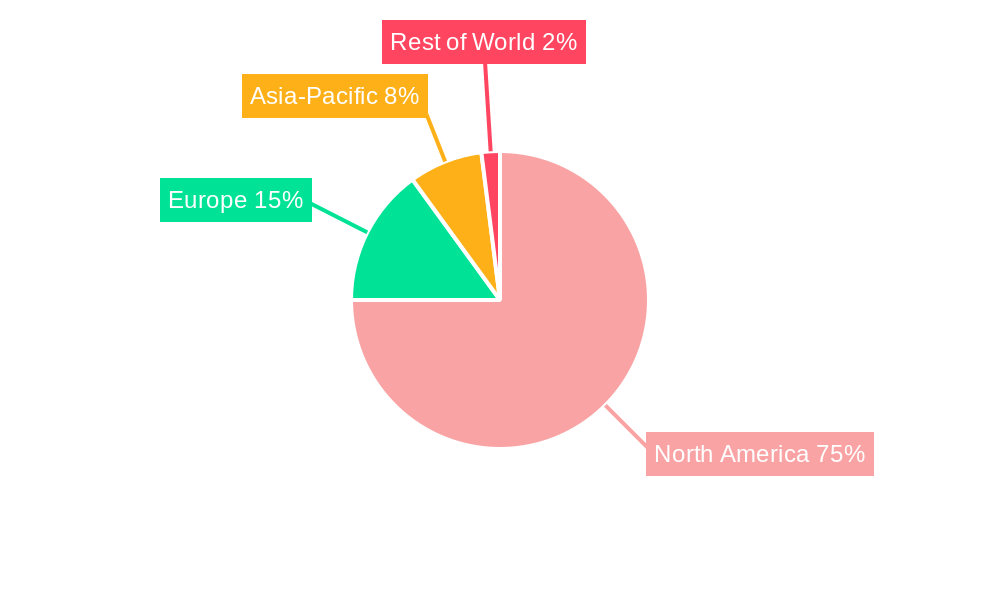
North America Amusement Parks Market Regional Market Share
Geographic Coverage of North America Amusement Parks Market
North America Amusement Parks Market REPORT HIGHLIGHTS
| Aspects | Details |
|---|---|
| Study Period | 2020-2034 |
| Base Year | 2025 |
| Estimated Year | 2026 |
| Forecast Period | 2026-2034 |
| Historical Period | 2020-2025 |
| Growth Rate | CAGR of 29.8% from 2020-2034 |
| Segmentation |
|
Table of Contents
- 1. Introduction
- 1.1. Research Scope
- 1.2. Market Segmentation
- 1.3. Research Objective
- 1.4. Definitions and Assumptions
- 2. Executive Summary
- 2.1. Market Snapshot
- 3. Market Dynamics
- 3.1. Market Drivers
- 3.2. Market Restrains
- 3.3. Market Trends
- 3.4. Market Opportunities
- 4. Market Factor Analysis
- 4.1. Porters Five Forces
- 4.1.1. Bargaining Power of Suppliers
- 4.1.2. Bargaining Power of Buyers
- 4.1.3. Threat of New Entrants
- 4.1.4. Threat of Substitutes
- 4.1.5. Competitive Rivalry
- 4.2. PESTEL analysis
- 4.3. BCG Analysis
- 4.3.1. Stars (High Growth, High Market Share)
- 4.3.2. Cash Cows (Low Growth, High Market Share)
- 4.3.3. Question Mark (High Growth, Low Market Share)
- 4.3.4. Dogs (Low Growth, Low Market Share)
- 4.4. Ansoff Matrix Analysis
- 4.5. Supply Chain Analysis
- 4.6. Regulatory Landscape
- 4.7. Current Market Potential and Opportunity Assessment (TAM–SAM–SOM Framework)
- 4.8. NRP Analyst Note
- 4.1. Porters Five Forces
- 5. Market Analysis, Insights and Forecast 2021-2033
- 5.1. Market Analysis, Insights and Forecast - by Rides
- 5.1.1. Mechanical Rides
- 5.1.2. Water Rides
- 5.1.3. Other Rides
- 5.2. Market Analysis, Insights and Forecast - by Age
- 5.2.1. Upto 18 years
- 5.2.2. 19 to 35 years
- 5.2.3. 36 to 50 years
- 5.2.4. 51 to 65 years
- 5.2.5. More than 65 years
- 5.3. Market Analysis, Insights and Forecast - by Revenue
- 5.3.1. Tickets
- 5.3.2. Food & Beverages
- 5.3.3. Merchandise
- 5.3.4. Hotels/Resorts
- 5.3.5. Other Revenues
- 5.4. Market Analysis, Insights and Forecast - by Region
- 5.4.1. North America
- 5.1. Market Analysis, Insights and Forecast - by Rides
- 6. North America Amusement Parks Market Analysis, Insights and Forecast, 2021-2033
- 6.1. Market Analysis, Insights and Forecast - by Rides
- 6.1.1. Mechanical Rides
- 6.1.2. Water Rides
- 6.1.3. Other Rides
- 6.2. Market Analysis, Insights and Forecast - by Age
- 6.2.1. Upto 18 years
- 6.2.2. 19 to 35 years
- 6.2.3. 36 to 50 years
- 6.2.4. 51 to 65 years
- 6.2.5. More than 65 years
- 6.3. Market Analysis, Insights and Forecast - by Revenue
- 6.3.1. Tickets
- 6.3.2. Food & Beverages
- 6.3.3. Merchandise
- 6.3.4. Hotels/Resorts
- 6.3.5. Other Revenues
- 6.1. Market Analysis, Insights and Forecast - by Rides
- 7. Competitive Analysis
- 7.1. Company Profiles
- 7.1.1 Disney's Hollywood Studios
- 7.1.1.1. Company Overview
- 7.1.1.2. Products
- 7.1.1.3. Company Financials
- 7.1.1.4. SWOT Analysis
- 7.1.2 Universal Studios
- 7.1.2.1. Company Overview
- 7.1.2.2. Products
- 7.1.2.3. Company Financials
- 7.1.2.4. SWOT Analysis
- 7.1.3 Epcot
- 7.1.3.1. Company Overview
- 7.1.3.2. Products
- 7.1.3.3. Company Financials
- 7.1.3.4. SWOT Analysis
- 7.1.4 Seaworld**List Not Exhaustive
- 7.1.4.1. Company Overview
- 7.1.4.2. Products
- 7.1.4.3. Company Financials
- 7.1.4.4. SWOT Analysis
- 7.1.5 Universal Studios Hollywood
- 7.1.5.1. Company Overview
- 7.1.5.2. Products
- 7.1.5.3. Company Financials
- 7.1.5.4. SWOT Analysis
- 7.1.6 Magic Kingdom
- 7.1.6.1. Company Overview
- 7.1.6.2. Products
- 7.1.6.3. Company Financials
- 7.1.6.4. SWOT Analysis
- 7.1.7 Disney's Animal Kingdom
- 7.1.7.1. Company Overview
- 7.1.7.2. Products
- 7.1.7.3. Company Financials
- 7.1.7.4. SWOT Analysis
- 7.1.8 Disney's California Adventure
- 7.1.8.1. Company Overview
- 7.1.8.2. Products
- 7.1.8.3. Company Financials
- 7.1.8.4. SWOT Analysis
- 7.1.9 Islands of Adventure
- 7.1.9.1. Company Overview
- 7.1.9.2. Products
- 7.1.9.3. Company Financials
- 7.1.9.4. SWOT Analysis
- 7.1.10 Disneyland
- 7.1.10.1. Company Overview
- 7.1.10.2. Products
- 7.1.10.3. Company Financials
- 7.1.10.4. SWOT Analysis
- 7.1.1 Disney's Hollywood Studios
- 7.2. Market Entropy
- 7.2.1 Company's Key Areas Served
- 7.2.2 Recent Developments
- 7.3. Company Market Share Analysis 2025
- 7.3.1 Top 5 Companies Market Share Analysis
- 7.3.2 Top 3 Companies Market Share Analysis
- 7.4. List of Potential Customers
- 8. Research Methodology
List of Figures
- Figure 1: North America Amusement Parks Market Revenue Breakdown (billion, %) by Product 2025 & 2033
- Figure 2: North America Amusement Parks Market Share (%) by Company 2025
List of Tables
- Table 1: North America Amusement Parks Market Revenue billion Forecast, by Rides 2020 & 2033
- Table 2: North America Amusement Parks Market Revenue billion Forecast, by Age 2020 & 2033
- Table 3: North America Amusement Parks Market Revenue billion Forecast, by Revenue 2020 & 2033
- Table 4: North America Amusement Parks Market Revenue billion Forecast, by Region 2020 & 2033
- Table 5: North America Amusement Parks Market Revenue billion Forecast, by Rides 2020 & 2033
- Table 6: North America Amusement Parks Market Revenue billion Forecast, by Age 2020 & 2033
- Table 7: North America Amusement Parks Market Revenue billion Forecast, by Revenue 2020 & 2033
- Table 8: North America Amusement Parks Market Revenue billion Forecast, by Country 2020 & 2033
- Table 9: United States North America Amusement Parks Market Revenue (billion) Forecast, by Application 2020 & 2033
- Table 10: Canada North America Amusement Parks Market Revenue (billion) Forecast, by Application 2020 & 2033
- Table 11: Mexico North America Amusement Parks Market Revenue (billion) Forecast, by Application 2020 & 2033
Frequently Asked Questions
1. What is the projected Compound Annual Growth Rate (CAGR) of the North America Amusement Parks Market?
The projected CAGR is approximately 29.8%.
2. Which companies are prominent players in the North America Amusement Parks Market?
Key companies in the market include Disney's Hollywood Studios, Universal Studios, Epcot, Seaworld**List Not Exhaustive, Universal Studios Hollywood, Magic Kingdom, Disney's Animal Kingdom, Disney's California Adventure, Islands of Adventure, Disneyland.
3. What are the main segments of the North America Amusement Parks Market?
The market segments include Rides, Age, Revenue.
4. Can you provide details about the market size?
The market size is estimated to be USD 33.3 billion as of 2022.
5. What are some drivers contributing to market growth?
Rise in the Number of Visitors to Museums is Driving the Market; Digitalization is Driving the Market.
6. What are the notable trends driving market growth?
Mechanical Rides Powering North America's Amusement Park Industry.
7. Are there any restraints impacting market growth?
Maintenance and Preservation Costs; Changing Visitor Preferences.
8. Can you provide examples of recent developments in the market?
January 2023: Global hospitality and entertainment company Delaware North announced its continued expansion in the parks and lodging sector through the acquisition of the Best Western Premier Grand Canyon Squire Inn.
9. What pricing options are available for accessing the report?
Pricing options include single-user, multi-user, and enterprise licenses priced at USD 4750, USD 4950, and USD 6800 respectively.
10. Is the market size provided in terms of value or volume?
The market size is provided in terms of value, measured in billion.
11. Are there any specific market keywords associated with the report?
Yes, the market keyword associated with the report is "North America Amusement Parks Market," which aids in identifying and referencing the specific market segment covered.
12. How do I determine which pricing option suits my needs best?
The pricing options vary based on user requirements and access needs. Individual users may opt for single-user licenses, while businesses requiring broader access may choose multi-user or enterprise licenses for cost-effective access to the report.
13. Are there any additional resources or data provided in the North America Amusement Parks Market report?
While the report offers comprehensive insights, it's advisable to review the specific contents or supplementary materials provided to ascertain if additional resources or data are available.
14. How can I stay updated on further developments or reports in the North America Amusement Parks Market?
To stay informed about further developments, trends, and reports in the North America Amusement Parks Market, consider subscribing to industry newsletters, following relevant companies and organizations, or regularly checking reputable industry news sources and publications.
Methodology
Step 1 - Identification of Relevant Samples Size from Population Database


Step 2 - Approaches for Defining Global Market Size (Value, Volume* & Price*)

Note*: In applicable scenarios
Step 3 - Data Sources
Primary Research
- Web Analytics
- Survey Reports
- Research Institute
- Latest Research Reports
- Opinion Leaders
Secondary Research
- Annual Reports
- White Paper
- Latest Press Release
- Industry Association
- Paid Database
- Investor Presentations

Step 4 - Data Triangulation
Involves using different sources of information in order to increase the validity of a study
These sources are likely to be stakeholders in a program - participants, other researchers, program staff, other community members, and so on.
Then we put all data in single framework & apply various statistical tools to find out the dynamic on the market.
During the analysis stage, feedback from the stakeholder groups would be compared to determine areas of agreement as well as areas of divergence