

Key Insights
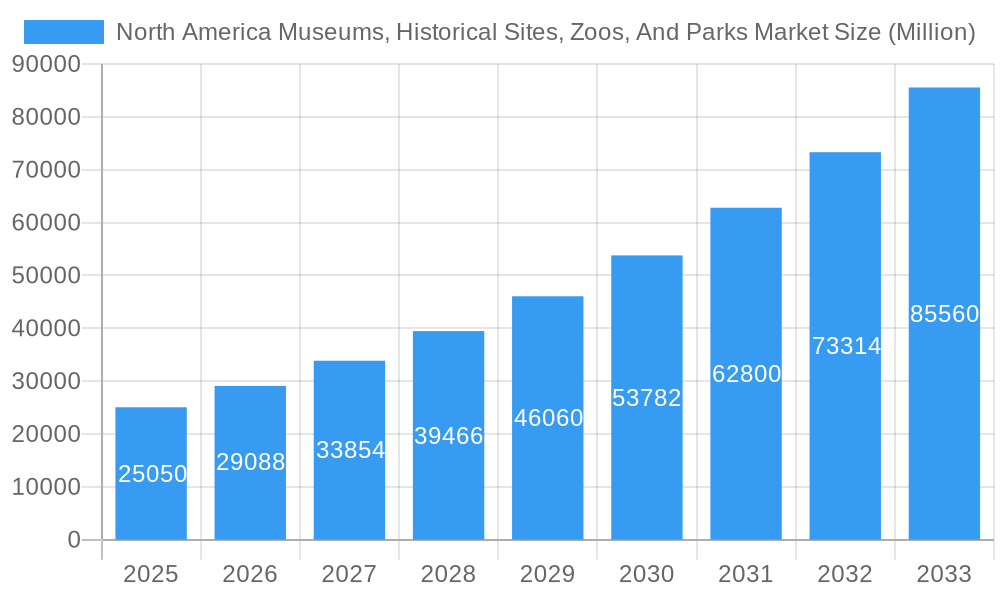
The North American Museums, Historical Sites, Zoos, and Parks market is experiencing robust growth, projected to reach $25.05 billion in 2025 and exhibiting a Compound Annual Growth Rate (CAGR) of 16.08% from 2025 to 2033. This expansion is fueled by several key factors. Firstly, increasing disposable incomes and a growing preference for experiential tourism are driving visitor numbers. Secondly, innovative marketing strategies, interactive exhibits, and enhanced visitor experiences are attracting broader demographics, including younger audiences. The integration of technology, such as augmented reality and virtual tours, also contributes significantly to market growth. Finally, government initiatives promoting cultural preservation and environmental conservation further bolster the industry. The market segmentation reveals a diverse revenue stream, with ticket sales being a major contributor alongside food and beverage sales and other ancillary revenue sources, such as merchandise and educational programs. While the United States is currently the dominant market within North America, significant growth potential exists in Canada and Mexico, particularly with investments in infrastructure and tourism promotion. Challenges include managing visitor congestion during peak seasons, maintaining historical sites, and balancing environmental protection with tourism development in nature parks.
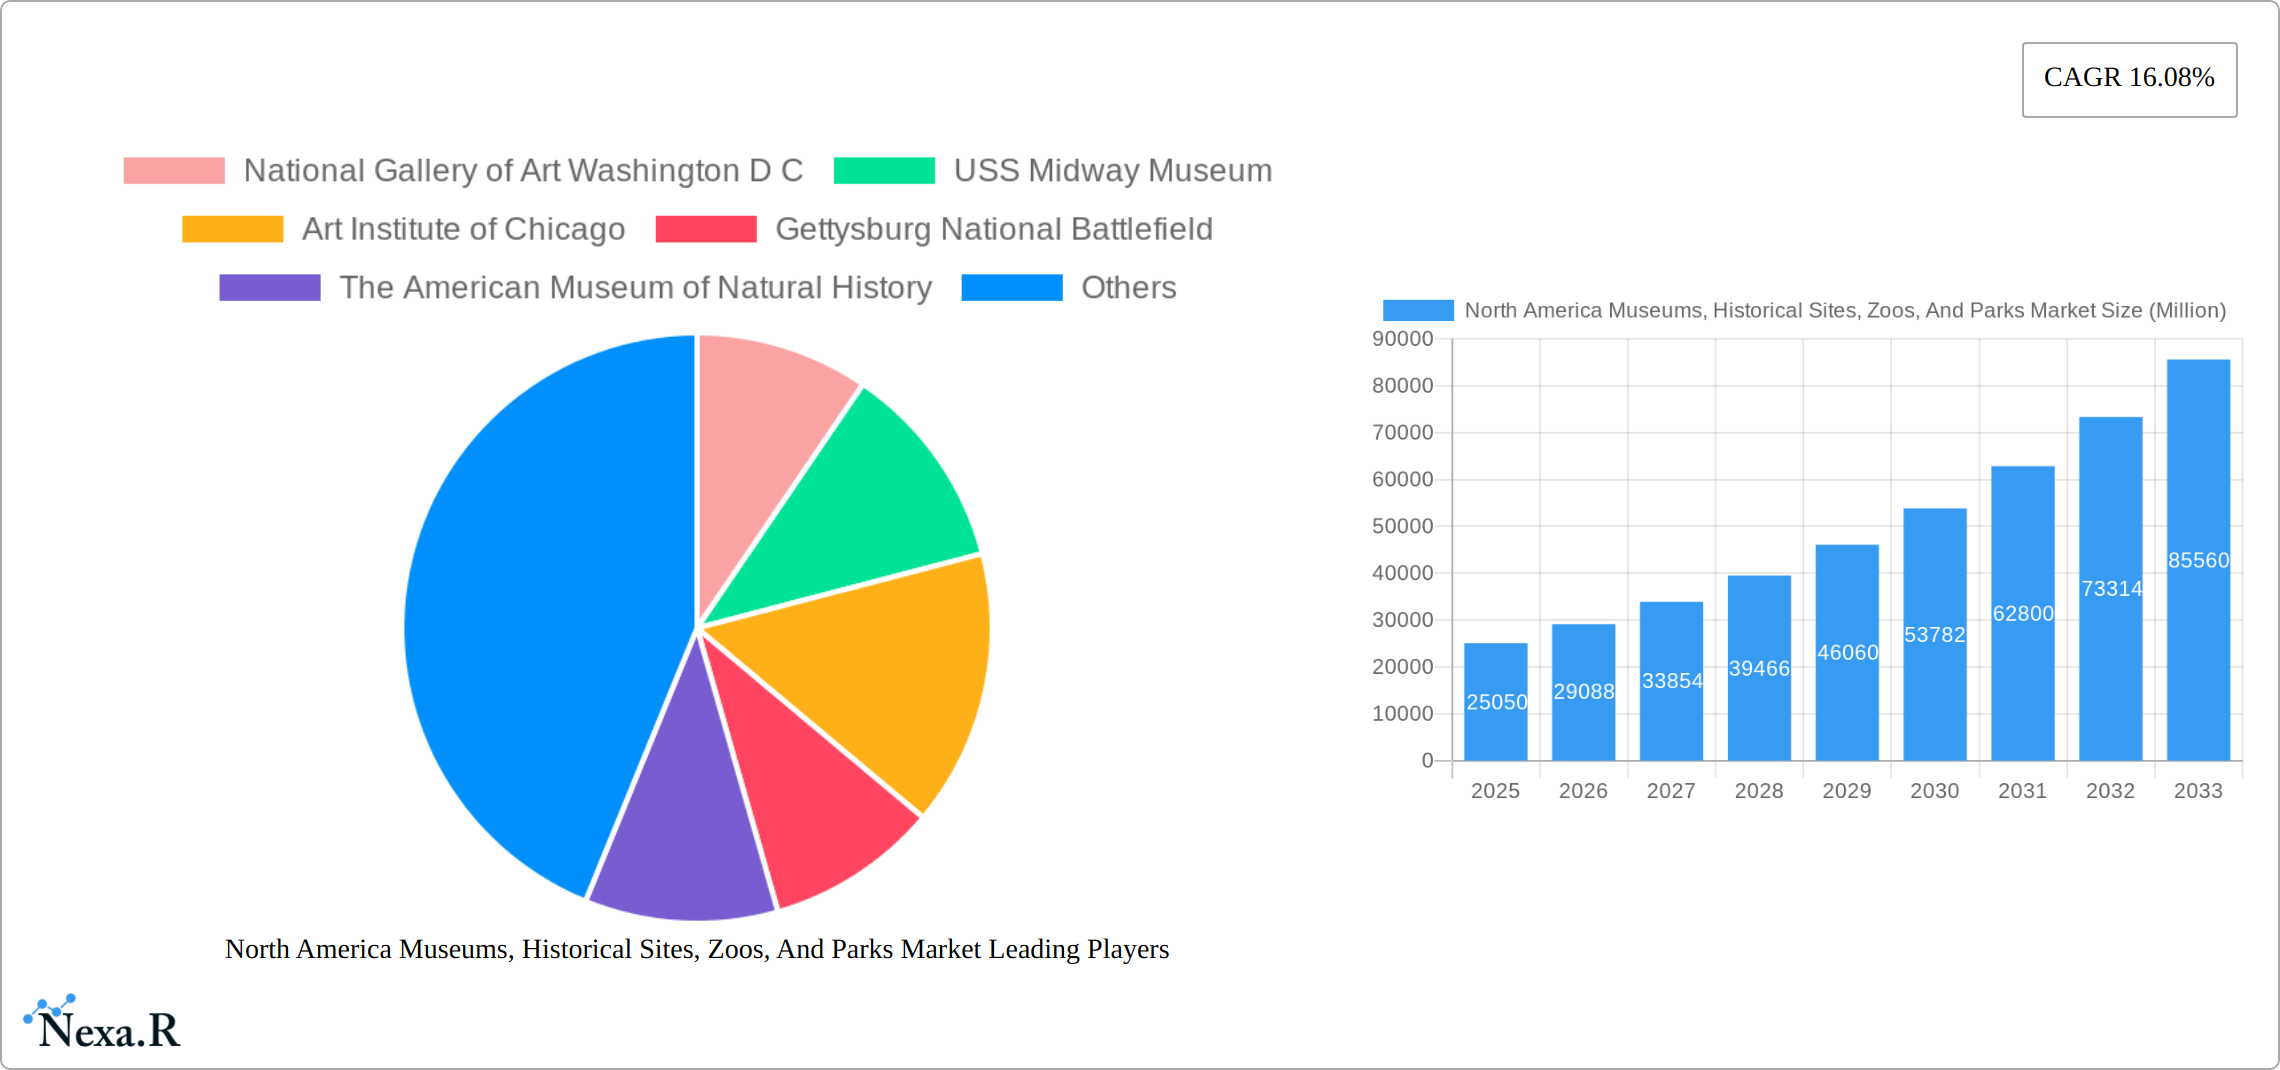
North America Museums, Historical Sites, Zoos, And Parks Market Market Size (In Billion)
The diverse range of attractions within this market – from renowned art museums like the National Gallery of Art and the Art Institute of Chicago to significant historical landmarks such as Gettysburg National Battlefield and Independence Hall, alongside popular zoos and national parks such as Yellowstone – contributes to its overall market strength. The market’s sustained growth trajectory hinges on continued innovation, effective management of resources, and a focus on providing high-quality, engaging experiences that cater to evolving visitor expectations. Future projections indicate a significant expansion driven by consistent investment in infrastructure, marketing, and digital technologies. This expansion should see a steady increase in both domestic and international tourism contributing to the overall market valuation. Careful consideration of sustainable practices and responsible tourism management will be critical to ensuring the long-term health and profitability of this dynamic sector.
North America Museums, Historical Sites, Zoos, And Parks Market Company Market Share
This in-depth report provides a comprehensive analysis of the North America Museums, Historical Sites, Zoos, and Parks market, encompassing market dynamics, growth trends, key players, and future outlook. The study period covers 2019-2033, with 2025 as the base and estimated year. This report is crucial for industry professionals, investors, and stakeholders seeking to understand and capitalize on opportunities within this dynamic sector. The market is segmented by revenue source (Tickets, Food & Beverages, Other Revenue Sources) and type (Museums, Historical Sites, Zoos & Botanical Gardens, Nature Parks, Other Similar Institutions).
North America Museums, Historical Sites, Zoos, And Parks Market Market Dynamics & Structure
The North American museums, historical sites, zoos, and parks market is characterized by a dynamic and evolving landscape. While it exhibits a moderately fragmented structure with a blend of large, well-established institutions and smaller, niche operators, strategic alliances and collaborative efforts are becoming increasingly prevalent. Market concentration is significantly influenced by factors such as prime geographic locations, strong tourism appeal, unique and compelling offerings, and effective marketing strategies. Technological innovation continues to be a pivotal force, with a growing emphasis on enhancing visitor experience and operational efficiency through digital ticketing systems, immersive virtual tours, interactive digital exhibits, and sophisticated data analytics. The regulatory framework is complex and varies across different jurisdictions, impacting critical areas like accessibility standards, stringent safety regulations, and robust environmental conservation efforts. Competitive pressures are multifaceted, stemming not only from direct substitute leisure activities like theme parks and entertainment venues but also from the ever-expanding realm of online experiences and digital content. The end-user demographic is exceptionally diverse, encompassing families seeking educational outings, school groups on field trips, international tourists exploring new destinations, and individual enthusiasts with specific interests. Mergers and acquisitions (M&A) activity within the sector, though moderate, is strategically driven by a desire for geographic expansion, operational consolidation, enhanced resource access, and the pursuit of synergistic benefits.
- Market Concentration: Moderately fragmented, with a noticeable presence of both large-scale institutions and numerous smaller, specialized entities. The top 5 players collectively held approximately xx% of the market share in 2024, indicating a competitive yet somewhat consolidated tier.
- Technological Innovation: Widespread adoption of digital technologies is revolutionizing ticketing, visitor engagement, and overall operational optimization. Key innovations include AI-powered personalization, augmented reality (AR) overlays for exhibits, and advanced data analytics for visitor flow management. The primary barriers to adoption remain the significant cost of implementation and the need for specialized technological expertise.
- Regulatory Landscape: The regulatory environment is a significant consideration, with varying mandates across jurisdictions concerning safety, accessibility, and environmental sustainability. There is a clear trend towards increased regulatory scrutiny concerning environmental impact, conservation practices, and ethical animal welfare standards in zoos.
- Competitive Substitutes: A broad spectrum of competitive substitutes exists, ranging from high-energy theme parks and diverse entertainment venues to the increasingly immersive and accessible world of online streaming and virtual experiences.
- End-User Demographics: The market caters to a highly diverse end-user base, including families, educational institutions, international travelers, and individuals with niche interests. Evolving demographic trends and shifting consumer preferences are crucial factors influencing market demand and shaping future offerings.
- M&A Activity: The sector experiences a moderate level of M&A activity, driven by strategic objectives such as expanding geographic reach, achieving greater operational efficiencies through economies of scale, and consolidating market presence. In 2024, approximately xx M&A deals were completed, reflecting a strategic approach to growth and market positioning.
North America Museums, Historical Sites, Zoos, And Parks Market Growth Trends & Insights
The North American museums, historical sites, zoos, and parks market is demonstrating robust and steady growth. This upward trajectory is fueled by a confluence of factors, including rising disposable incomes across key demographics, a sustained increase in domestic and international tourism, and a deepening societal interest in cultural heritage, educational enrichment, and natural conservation. The market size experienced a Compound Annual Growth Rate (CAGR) of xx% during the historical period (2019-2024), and it is projected to have reached an estimated value of $xx million in 2025. Market penetration varies considerably across its diverse segments; while museums and historical sites generally exhibit higher penetration rates, zoos and nature parks are actively working to expand their reach and appeal. Technological advancements, particularly in the realm of augmented reality (AR) and virtual reality (VR) applications, are fundamentally transforming the visitor experience, leading to heightened engagement, increased dwell times, and ultimately, augmented revenue streams. Furthermore, evolving consumer behavior, marked by a growing preference for personalized experiences and a strong inclination towards sustainable tourism, is significantly shaping prevailing market trends. The forecast period (2025-2033) anticipates a continued healthy growth trajectory, with an estimated CAGR of xx%, projecting the market to reach a substantial $xx million by 2033.
Dominant Regions, Countries, or Segments in North America Museums, Historical Sites, Zoos, And Parks Market
The market demonstrates regional disparities in growth. The leading regions are California, Florida, and New York, driven by strong tourism infrastructure, a high concentration of attractions, and favourable economic conditions. Within revenue sources, ticket sales comprise the largest share (xx%), followed by food and beverages (xx%), and other revenue sources (xx%). By type, museums and historical sites represent the largest segment due to their established presence and cultural significance. However, zoos and botanical gardens, and nature parks are showing significant growth potential, driven by increasing environmental awareness and the popularity of outdoor recreation.
- Key Drivers: Strong tourism infrastructure, high concentration of attractions, favourable economic conditions, increasing disposable incomes, and growing interest in cultural and educational experiences.
- Dominant Regions: California, Florida, and New York demonstrate the strongest market performance.
- Leading Segments (Revenue): Ticket sales dominate, followed by food and beverage, and "other" revenue sources.
- Leading Segments (Type): Museums and historical sites hold the largest market share, with significant growth potential observed in zoos and nature parks.
North America Museums, Historical Sites, Zoos, And Parks Market Product Landscape
The market features a diverse range of products and services, including traditional exhibits, interactive displays, educational programs, guided tours, specialized events, and ancillary services like restaurants and gift shops. Recent innovations include the integration of digital technologies, augmented reality (AR) and virtual reality (VR) experiences, and personalized mobile applications enhancing visitor engagement. Performance metrics focus on visitor numbers, revenue generation, customer satisfaction, and operational efficiency. Unique selling propositions vary by institution, focusing on unique collections, immersive experiences, and educational value.
Key Drivers, Barriers & Challenges in North America Museums, Historical Sites, Zoos, And Parks Market
Key Drivers: The market's expansion is primarily propelled by several strong drivers. A significant increase in tourism, both domestic and international, consistently brings new visitors. Rising disposable incomes empower more individuals and families to allocate resources towards leisure and cultural activities. There is a growing societal appreciation for and interest in cultural heritage, educational pursuits, and immersive natural experiences. Continuous technological advancements are pivotal in enhancing visitor engagement and creating more dynamic presentations. Furthermore, government initiatives aimed at promoting cultural preservation, heritage site conservation, and environmental protection provide crucial support and impetus for growth.
Challenges & Restraints: Despite the positive growth, the market faces considerable challenges and restraints. Intense competition from a wide array of substitute leisure activities, including entertainment complexes and digital alternatives, constantly vies for consumer attention and spending. Economic downturns can significantly impact visitor spending on discretionary activities. Seasonal fluctuations in attendance patterns pose operational and financial management challenges. Rising operational costs, encompassing staffing, maintenance, and exhibit development, can strain budgets, particularly for non-profit institutions. Potential funding constraints, especially for organizations reliant on grants and donations, remain a persistent concern. Disruptions in supply chains, affecting the procurement of exhibit materials and specialized equipment, can delay projects and increase costs. Navigating complex regulatory hurdles related to permits, zoning, and operational standards adds to the cost and complexity of operations. Finally, the intense competition among institutions for visitor attention and market share can impact individual profitability and sustainability.
Emerging Opportunities in North America Museums, Historical Sites, Zoos, And Parks Market
The North American museums, historical sites, zoos, and parks market is ripe with emerging opportunities. A significant area of growth lies in the strategic leveraging of digital technologies to create more engaging and personalized visitor experiences. This includes the development of truly immersive and interactive exhibits that go beyond passive observation, utilizing AR/VR, gamification, and multi-sensory elements. There is a growing demand for catering to specialized interests, such as niche historical periods, specific scientific disciplines, or the burgeoning field of sustainable tourism and ecotourism. The creation of highly personalized visitor journeys, tailored to individual preferences and learning styles, presents a key opportunity to enhance satisfaction and encourage repeat visits. Expanding outreach through robust online platforms, offering virtual content, educational resources, and e-commerce opportunities, can broaden reach beyond physical visitors. Untapped markets also exist in actively promoting attractions to underserved demographics, including low-income communities, individuals with disabilities, and specific age groups, thereby fostering greater inclusivity. Furthermore, strategic efforts to attract and cater to diverse international tourism markets can unlock significant growth potential.
Growth Accelerators in the North America Museums, Historical Sites, Zoos, And Parks Market Industry
Long-term growth will be driven by strategic partnerships (e.g., cross-promotional campaigns with tourism agencies), investments in technological upgrades, expansion into new markets, and development of unique and immersive visitor experiences. Sustainability initiatives and community engagement further enhance the market appeal.
Key Players Shaping the North America Museums, Historical Sites, Zoos, And Parks Market Market
- National Gallery of Art, Washington D.C.
- USS Midway Museum
- Art Institute of Chicago
- Gettysburg National Battlefield
- The American Museum of Natural History
- The Montreal Museum of Fine Arts
- Art Gallery of Ontario
- Independence Hall
- Museum of Anthropology at UBC
- Houston Zoo
- Jamestown Settlement
- Cincinnati Zoo & Botanical Garden
- Yellowstone National Park
- The Statue of Liberty
- Smithsonian National Museum of Natural History
- Metropolitan Museum of Art
- Louvre Abu Dhabi (North American presence/influence considered)
- Banff National Park
- Walt Disney Parks and Resorts (as a major leisure competitor influencing the market)
- Universal Parks & Resorts (as a major leisure competitor influencing the market)
Notable Milestones in North America Museums, Historical Sites, Zoos, And Parks Market Sector
- March 2023: The Columbus Zoo and Aquarium and The Wilds announced a $32.5 million capital spending program for improved animal well-being, enhanced guest experiences, and additional lodging. This signifies investment in infrastructure and experience enhancement, driving market growth.
- January 2023: Houston Zoo's $150 million "Keeping Our World Wild" campaign and subsequent Galápagos Islands exhibit opening showcase investment in major attractions and improved visitor experiences. This signals a trend towards significant capital expenditure to enhance visitor appeal and brand positioning.
In-Depth North America Museums, Historical Sites, Zoos, And Parks Market Market Outlook
The North American museums, historical sites, zoos, and parks market holds substantial future potential, driven by continued investment in infrastructure, technological innovation, and immersive experiences. Strategic partnerships, sustainable tourism initiatives, and targeted marketing to diverse demographics will be crucial for market expansion. The increasing focus on personalized and educational experiences promises robust growth in the forecast period.
North America Museums, Historical Sites, Zoos, And Parks Market Segmentation
-
1. Type
- 1.1. Museums
- 1.2. Historical Sites
- 1.3. Zoos And Botanical Gardens
- 1.4. Nature Parks
- 1.5. Other Similar Institutions
-
2. Revenue Source
- 2.1. Tickets
- 2.2. Food And Beverages
- 2.3. Other Revenue Souces
-
3. Geography
- 3.1. USA
- 3.2. Canada
- 3.3. Rest of North America
North America Museums, Historical Sites, Zoos, And Parks Market Segmentation By Geography
- 1. USA
- 2. Canada
- 3. Rest of North America
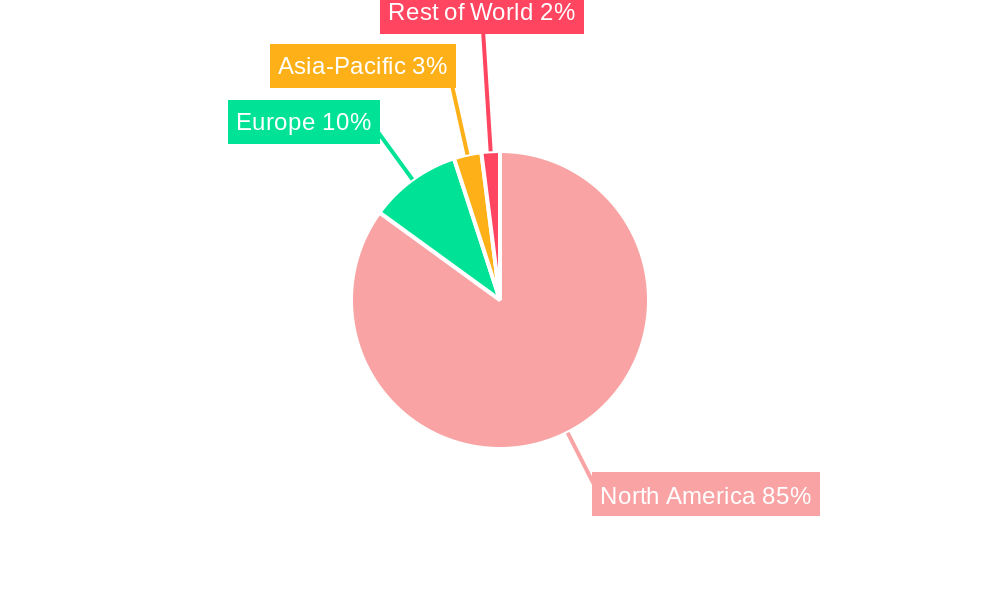
North America Museums, Historical Sites, Zoos, And Parks Market Regional Market Share
Geographic Coverage of North America Museums, Historical Sites, Zoos, And Parks Market
North America Museums, Historical Sites, Zoos, And Parks Market REPORT HIGHLIGHTS
| Aspects | Details |
|---|---|
| Study Period | 2020-2034 |
| Base Year | 2025 |
| Estimated Year | 2026 |
| Forecast Period | 2026-2034 |
| Historical Period | 2020-2025 |
| Growth Rate | CAGR of 16.08% from 2020-2034 |
| Segmentation |
|
Table of Contents
- 1. Introduction
- 1.1. Research Scope
- 1.2. Market Segmentation
- 1.3. Research Objective
- 1.4. Definitions and Assumptions
- 2. Executive Summary
- 2.1. Market Snapshot
- 3. Market Dynamics
- 3.1. Market Drivers
- 3.2. Market Restrains
- 3.3. Market Trends
- 3.4. Market Opportunities
- 4. Market Factor Analysis
- 4.1. Porters Five Forces
- 4.1.1. Bargaining Power of Suppliers
- 4.1.2. Bargaining Power of Buyers
- 4.1.3. Threat of New Entrants
- 4.1.4. Threat of Substitutes
- 4.1.5. Competitive Rivalry
- 4.2. PESTEL analysis
- 4.3. BCG Analysis
- 4.3.1. Stars (High Growth, High Market Share)
- 4.3.2. Cash Cows (Low Growth, High Market Share)
- 4.3.3. Question Mark (High Growth, Low Market Share)
- 4.3.4. Dogs (Low Growth, Low Market Share)
- 4.4. Ansoff Matrix Analysis
- 4.5. Supply Chain Analysis
- 4.6. Regulatory Landscape
- 4.7. Current Market Potential and Opportunity Assessment (TAM–SAM–SOM Framework)
- 4.8. NRP Analyst Note
- 4.1. Porters Five Forces
- 5. Market Analysis, Insights and Forecast 2021-2033
- 5.1. Market Analysis, Insights and Forecast - by Type
- 5.1.1. Museums
- 5.1.2. Historical Sites
- 5.1.3. Zoos And Botanical Gardens
- 5.1.4. Nature Parks
- 5.1.5. Other Similar Institutions
- 5.2. Market Analysis, Insights and Forecast - by Revenue Source
- 5.2.1. Tickets
- 5.2.2. Food And Beverages
- 5.2.3. Other Revenue Souces
- 5.3. Market Analysis, Insights and Forecast - by Geography
- 5.3.1. USA
- 5.3.2. Canada
- 5.3.3. Rest of North America
- 5.4. Market Analysis, Insights and Forecast - by Region
- 5.4.1. USA
- 5.4.2. Canada
- 5.4.3. Rest of North America
- 5.1. Market Analysis, Insights and Forecast - by Type
- 6. North America Museums, Historical Sites, Zoos, And Parks Market Analysis, Insights and Forecast, 2021-2033
- 6.1. Market Analysis, Insights and Forecast - by Type
- 6.1.1. Museums
- 6.1.2. Historical Sites
- 6.1.3. Zoos And Botanical Gardens
- 6.1.4. Nature Parks
- 6.1.5. Other Similar Institutions
- 6.2. Market Analysis, Insights and Forecast - by Revenue Source
- 6.2.1. Tickets
- 6.2.2. Food And Beverages
- 6.2.3. Other Revenue Souces
- 6.3. Market Analysis, Insights and Forecast - by Geography
- 6.3.1. USA
- 6.3.2. Canada
- 6.3.3. Rest of North America
- 6.1. Market Analysis, Insights and Forecast - by Type
- 7. USA North America Museums, Historical Sites, Zoos, And Parks Market Analysis, Insights and Forecast, 2020-2032
- 7.1. Market Analysis, Insights and Forecast - by Type
- 7.1.1. Museums
- 7.1.2. Historical Sites
- 7.1.3. Zoos And Botanical Gardens
- 7.1.4. Nature Parks
- 7.1.5. Other Similar Institutions
- 7.2. Market Analysis, Insights and Forecast - by Revenue Source
- 7.2.1. Tickets
- 7.2.2. Food And Beverages
- 7.2.3. Other Revenue Souces
- 7.3. Market Analysis, Insights and Forecast - by Geography
- 7.3.1. USA
- 7.3.2. Canada
- 7.3.3. Rest of North America
- 7.1. Market Analysis, Insights and Forecast - by Type
- 8. Canada North America Museums, Historical Sites, Zoos, And Parks Market Analysis, Insights and Forecast, 2020-2032
- 8.1. Market Analysis, Insights and Forecast - by Type
- 8.1.1. Museums
- 8.1.2. Historical Sites
- 8.1.3. Zoos And Botanical Gardens
- 8.1.4. Nature Parks
- 8.1.5. Other Similar Institutions
- 8.2. Market Analysis, Insights and Forecast - by Revenue Source
- 8.2.1. Tickets
- 8.2.2. Food And Beverages
- 8.2.3. Other Revenue Souces
- 8.3. Market Analysis, Insights and Forecast - by Geography
- 8.3.1. USA
- 8.3.2. Canada
- 8.3.3. Rest of North America
- 8.1. Market Analysis, Insights and Forecast - by Type
- 9. Rest of North America North America Museums, Historical Sites, Zoos, And Parks Market Analysis, Insights and Forecast, 2020-2032
- 9.1. Market Analysis, Insights and Forecast - by Type
- 9.1.1. Museums
- 9.1.2. Historical Sites
- 9.1.3. Zoos And Botanical Gardens
- 9.1.4. Nature Parks
- 9.1.5. Other Similar Institutions
- 9.2. Market Analysis, Insights and Forecast - by Revenue Source
- 9.2.1. Tickets
- 9.2.2. Food And Beverages
- 9.2.3. Other Revenue Souces
- 9.3. Market Analysis, Insights and Forecast - by Geography
- 9.3.1. USA
- 9.3.2. Canada
- 9.3.3. Rest of North America
- 9.1. Market Analysis, Insights and Forecast - by Type
- 10. Competitive Analysis
- 10.1. Company Profiles
- 10.1.1 National Gallery of Art Washington D C
- 10.1.1.1. Company Overview
- 10.1.1.2. Products
- 10.1.1.3. Company Financials
- 10.1.1.4. SWOT Analysis
- 10.1.2 USS Midway Museum
- 10.1.2.1. Company Overview
- 10.1.2.2. Products
- 10.1.2.3. Company Financials
- 10.1.2.4. SWOT Analysis
- 10.1.3 Art Institute of Chicago
- 10.1.3.1. Company Overview
- 10.1.3.2. Products
- 10.1.3.3. Company Financials
- 10.1.3.4. SWOT Analysis
- 10.1.4 Gettysburg National Battlefield
- 10.1.4.1. Company Overview
- 10.1.4.2. Products
- 10.1.4.3. Company Financials
- 10.1.4.4. SWOT Analysis
- 10.1.5 The American Museum of Natural History
- 10.1.5.1. Company Overview
- 10.1.5.2. Products
- 10.1.5.3. Company Financials
- 10.1.5.4. SWOT Analysis
- 10.1.6 The Montreal Museum of Fine Arts
- 10.1.6.1. Company Overview
- 10.1.6.2. Products
- 10.1.6.3. Company Financials
- 10.1.6.4. SWOT Analysis
- 10.1.7 Art Gallery of Ontario
- 10.1.7.1. Company Overview
- 10.1.7.2. Products
- 10.1.7.3. Company Financials
- 10.1.7.4. SWOT Analysis
- 10.1.8 Independence Hall
- 10.1.8.1. Company Overview
- 10.1.8.2. Products
- 10.1.8.3. Company Financials
- 10.1.8.4. SWOT Analysis
- 10.1.9 Museum of Anthropology at UBC
- 10.1.9.1. Company Overview
- 10.1.9.2. Products
- 10.1.9.3. Company Financials
- 10.1.9.4. SWOT Analysis
- 10.1.10 Houston Zoo
- 10.1.10.1. Company Overview
- 10.1.10.2. Products
- 10.1.10.3. Company Financials
- 10.1.10.4. SWOT Analysis
- 10.1.11 Jamestown Settlement
- 10.1.11.1. Company Overview
- 10.1.11.2. Products
- 10.1.11.3. Company Financials
- 10.1.11.4. SWOT Analysis
- 10.1.12 Cincinnati Zoo & Botanical Garden
- 10.1.12.1. Company Overview
- 10.1.12.2. Products
- 10.1.12.3. Company Financials
- 10.1.12.4. SWOT Analysis
- 10.1.13 Yellowstone National Park**List Not Exhaustive
- 10.1.13.1. Company Overview
- 10.1.13.2. Products
- 10.1.13.3. Company Financials
- 10.1.13.4. SWOT Analysis
- 10.1.14 The Statue of Liberty
- 10.1.14.1. Company Overview
- 10.1.14.2. Products
- 10.1.14.3. Company Financials
- 10.1.14.4. SWOT Analysis
- 10.1.1 National Gallery of Art Washington D C
- 10.2. Market Entropy
- 10.2.1 Company's Key Areas Served
- 10.2.2 Recent Developments
- 10.3. Company Market Share Analysis 2025
- 10.3.1 Top 5 Companies Market Share Analysis
- 10.3.2 Top 3 Companies Market Share Analysis
- 10.4. List of Potential Customers
- 11. Research Methodology
List of Figures
- Figure 1: North America Museums, Historical Sites, Zoos, And Parks Market Revenue Breakdown (Million, %) by Product 2025 & 2033
- Figure 2: North America Museums, Historical Sites, Zoos, And Parks Market Share (%) by Company 2025
List of Tables
- Table 1: North America Museums, Historical Sites, Zoos, And Parks Market Revenue Million Forecast, by Type 2020 & 2033
- Table 2: North America Museums, Historical Sites, Zoos, And Parks Market Revenue Million Forecast, by Revenue Source 2020 & 2033
- Table 3: North America Museums, Historical Sites, Zoos, And Parks Market Revenue Million Forecast, by Geography 2020 & 2033
- Table 4: North America Museums, Historical Sites, Zoos, And Parks Market Revenue Million Forecast, by Region 2020 & 2033
- Table 5: North America Museums, Historical Sites, Zoos, And Parks Market Revenue Million Forecast, by Type 2020 & 2033
- Table 6: North America Museums, Historical Sites, Zoos, And Parks Market Revenue Million Forecast, by Revenue Source 2020 & 2033
- Table 7: North America Museums, Historical Sites, Zoos, And Parks Market Revenue Million Forecast, by Geography 2020 & 2033
- Table 8: North America Museums, Historical Sites, Zoos, And Parks Market Revenue Million Forecast, by Country 2020 & 2033
- Table 9: North America Museums, Historical Sites, Zoos, And Parks Market Revenue Million Forecast, by Type 2020 & 2033
- Table 10: North America Museums, Historical Sites, Zoos, And Parks Market Revenue Million Forecast, by Revenue Source 2020 & 2033
- Table 11: North America Museums, Historical Sites, Zoos, And Parks Market Revenue Million Forecast, by Geography 2020 & 2033
- Table 12: North America Museums, Historical Sites, Zoos, And Parks Market Revenue Million Forecast, by Country 2020 & 2033
- Table 13: North America Museums, Historical Sites, Zoos, And Parks Market Revenue Million Forecast, by Type 2020 & 2033
- Table 14: North America Museums, Historical Sites, Zoos, And Parks Market Revenue Million Forecast, by Revenue Source 2020 & 2033
- Table 15: North America Museums, Historical Sites, Zoos, And Parks Market Revenue Million Forecast, by Geography 2020 & 2033
- Table 16: North America Museums, Historical Sites, Zoos, And Parks Market Revenue Million Forecast, by Country 2020 & 2033
Frequently Asked Questions
1. What is the projected Compound Annual Growth Rate (CAGR) of the North America Museums, Historical Sites, Zoos, And Parks Market?
The projected CAGR is approximately 16.08%.
2. Which companies are prominent players in the North America Museums, Historical Sites, Zoos, And Parks Market?
Key companies in the market include National Gallery of Art Washington D C, USS Midway Museum, Art Institute of Chicago, Gettysburg National Battlefield, The American Museum of Natural History, The Montreal Museum of Fine Arts, Art Gallery of Ontario, Independence Hall, Museum of Anthropology at UBC, Houston Zoo, Jamestown Settlement, Cincinnati Zoo & Botanical Garden, Yellowstone National Park**List Not Exhaustive, The Statue of Liberty.
3. What are the main segments of the North America Museums, Historical Sites, Zoos, And Parks Market?
The market segments include Type, Revenue Source, Geography.
4. Can you provide details about the market size?
The market size is estimated to be USD 25.05 Million as of 2022.
5. What are some drivers contributing to market growth?
Growing Tourism Increasing Demand for Hospitality Services; Consistent Demand for Business Travel and Corporate Hospitality Services.
6. What are the notable trends driving market growth?
Significance of Historical Sites Nurturing North America's Cultural and Economic Landscape.
7. Are there any restraints impacting market growth?
Stringent Government Policies and Regulations Limiting the Market Growth; Lack of Skilled Labor is a Challenge for the Market.
8. Can you provide examples of recent developments in the market?
March 2023: The Columbus Zoo and Aquarium and The Wilds, its wildlife conservation center, announced a capital spending program to stretch over the next 12 to 18 months. Projects include improved animal well-being, enhanced guest experiences, and additional lodging. Approximately $32.5 million is set aside for the redevelopment of the North American region.
9. What pricing options are available for accessing the report?
Pricing options include single-user, multi-user, and enterprise licenses priced at USD 4750, USD 5250, and USD 8750 respectively.
10. Is the market size provided in terms of value or volume?
The market size is provided in terms of value, measured in Million.
11. Are there any specific market keywords associated with the report?
Yes, the market keyword associated with the report is "North America Museums, Historical Sites, Zoos, And Parks Market," which aids in identifying and referencing the specific market segment covered.
12. How do I determine which pricing option suits my needs best?
The pricing options vary based on user requirements and access needs. Individual users may opt for single-user licenses, while businesses requiring broader access may choose multi-user or enterprise licenses for cost-effective access to the report.
13. Are there any additional resources or data provided in the North America Museums, Historical Sites, Zoos, And Parks Market report?
While the report offers comprehensive insights, it's advisable to review the specific contents or supplementary materials provided to ascertain if additional resources or data are available.
14. How can I stay updated on further developments or reports in the North America Museums, Historical Sites, Zoos, And Parks Market?
To stay informed about further developments, trends, and reports in the North America Museums, Historical Sites, Zoos, And Parks Market, consider subscribing to industry newsletters, following relevant companies and organizations, or regularly checking reputable industry news sources and publications.
Methodology
Step 1 - Identification of Relevant Samples Size from Population Database


Step 2 - Approaches for Defining Global Market Size (Value, Volume* & Price*)

Note*: In applicable scenarios
Step 3 - Data Sources
Primary Research
- Web Analytics
- Survey Reports
- Research Institute
- Latest Research Reports
- Opinion Leaders
Secondary Research
- Annual Reports
- White Paper
- Latest Press Release
- Industry Association
- Paid Database
- Investor Presentations

Step 4 - Data Triangulation
Involves using different sources of information in order to increase the validity of a study
These sources are likely to be stakeholders in a program - participants, other researchers, program staff, other community members, and so on.
Then we put all data in single framework & apply various statistical tools to find out the dynamic on the market.
During the analysis stage, feedback from the stakeholder groups would be compared to determine areas of agreement as well as areas of divergence