

Key Insights
The North Sea oil and gas industry, while facing headwinds, presents a resilient and evolving market landscape. The industry's mature nature, coupled with a CAGR exceeding 3%, indicates a sustained, albeit slower growth trajectory compared to emerging markets. Key drivers include ongoing demand for energy, particularly natural gas, in Europe, coupled with strategic investments in infrastructure upgrades and enhanced oil recovery (EOR) techniques to maximize production from existing fields. However, this growth is tempered by several restraints. Stringent environmental regulations, increasing operational costs, and the global push towards renewable energy sources are all contributing factors. The upstream sector, focusing on exploration and production, faces challenges from depleting reserves and higher exploration costs. The midstream sector, encompassing transportation and storage, is adapting to fluctuating demand and investing in pipeline upgrades and optimization. The downstream sector, refining and marketing, is experiencing competition from alternative fuels and is focusing on value-added products and efficiency improvements. Major players like Equinor, TotalEnergies, BP, Shell, and others are strategically navigating these complexities, investing in both traditional and emerging technologies to maintain profitability and market share.
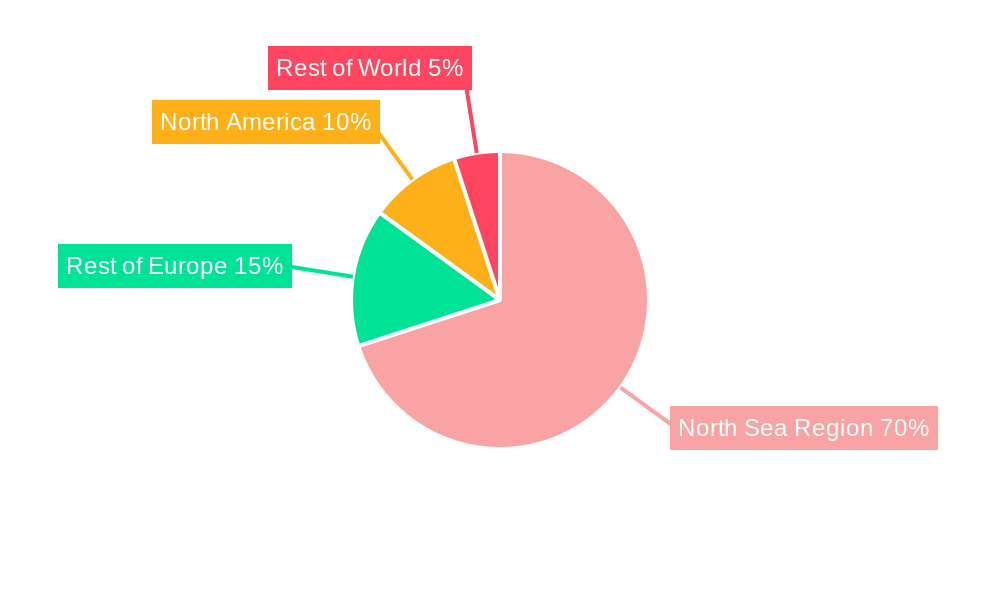
The regional distribution of the North Sea oil and gas industry is heavily concentrated in the North Sea region itself, comprising the UK, Norway, and Denmark. While the provided data includes a broader geographic scope, the core of the market’s activity remains in this area. The economic performance is intricately linked to global energy prices, making the market susceptible to price volatility. Future growth will likely be driven by strategic partnerships, technological advancements, such as carbon capture and storage (CCS) to address sustainability concerns, and the ongoing demand for energy security within Europe. The industry's transition toward a more sustainable future will involve substantial investments in renewable energy integration and diversification of energy sources. The competitive landscape remains highly consolidated, with significant players focusing on optimizing existing assets and exploring new opportunities for sustainable growth.

North Sea Region Oil & Gas Industry: Market Analysis & Forecast 2019-2033
This comprehensive report provides an in-depth analysis of the North Sea region's oil and gas industry, encompassing market dynamics, growth trends, competitive landscape, and future outlook. With a focus on Upstream, Midstream, and Downstream segments, this report offers invaluable insights for industry professionals, investors, and policymakers. The study period covers 2019-2033, with a base year of 2025 and a forecast period of 2025-2033. Key players analyzed include Equinor ASA, TotalEnergies SE, BP Plc, Royal Dutch Shell Plc, Transocean Ltd, Baker Hughes Company, Halliburton Company, Seadrill Ltd, Schlumberger Limited, and Valaris PLC. The report utilizes both quantitative and qualitative data to provide a holistic view of this dynamic market, projecting a market size of xx Million by 2033.
North Sea Region Oil & Gas Industry Market Dynamics & Structure
The North Sea oil and gas market is characterized by high market concentration among major international players, a complex regulatory environment, and ongoing technological innovation to enhance efficiency and sustainability. Mergers and acquisitions (M&A) activity plays a significant role in shaping the market landscape, with deal volumes fluctuating based on economic conditions and regulatory changes. The industry faces increasing pressure from alternative energy sources, necessitating adaptation and diversification strategies.
- Market Concentration: The market is dominated by a few major players, with the top 5 companies holding approximately xx% market share in 2025.
- Technological Innovation: Focus on enhanced oil recovery (EOR) techniques, digitalization, and automation to improve production efficiency and reduce operational costs. Barriers include high capital expenditure requirements and regulatory complexities.
- Regulatory Framework: Stringent environmental regulations and safety standards impact operational costs and investment decisions.
- Competitive Product Substitutes: Renewable energy sources pose a significant competitive threat, driving the need for diversification and carbon reduction strategies.
- End-User Demographics: Demand is primarily driven by industrial and residential sectors across the region.
- M&A Trends: Consolidation is expected to continue, with larger companies acquiring smaller players to expand their footprint and optimize resource allocation. The total value of M&A deals in 2024 reached approximately xx Million.
North Sea Region Oil & Gas Industry Growth Trends & Insights
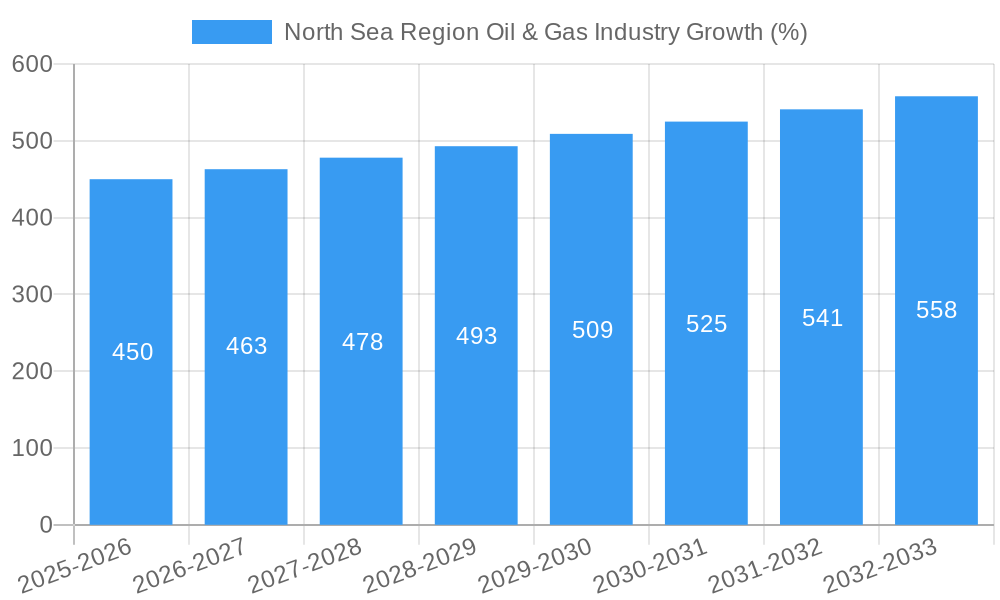
The North Sea oil and gas market experienced a period of decline during the historical period (2019-2024) due to fluctuating oil prices and pandemic-related disruptions. However, the market is projected to witness a steady growth trajectory during the forecast period (2025-2033), driven by increasing global energy demand and ongoing exploration activities. The Compound Annual Growth Rate (CAGR) is estimated to be xx% from 2025 to 2033. Technological advancements in exploration and production techniques, coupled with government initiatives aimed at bolstering energy security, contribute to this positive outlook. Market penetration of advanced technologies is expected to increase significantly, leading to improved operational efficiency and reduced environmental impact.
Dominant Regions, Countries, or Segments in North Sea Region Oil & Gas Industry
The Upstream segment currently holds the largest market share in the North Sea region, followed by Midstream and Downstream. Norway and the United Kingdom are the leading countries in terms of production and revenue generation. The dominance of the Upstream segment is attributed to significant ongoing exploration and production activities, supported by favorable government policies and a robust infrastructure.
- Upstream Segment Drivers:
- Significant reserves of oil and gas.
- Government incentives for exploration and production.
- Advanced exploration and production technologies.
- Norway's Dominance: Strong regulatory framework, skilled workforce, and high levels of investment contribute to Norway's leading position.
- UK's Market Share: Large reserves and established infrastructure drive the UK's significant market share.
- Growth Potential: Continued exploration, technological advancements, and potential discoveries in under-explored areas promise growth for the entire region.
North Sea Region Oil & Gas Industry Product Landscape
The North Sea oil and gas industry involves a range of products, from crude oil and natural gas to refined petroleum products and petrochemicals. Recent innovations focus on improving extraction techniques, refining processes, and environmental sustainability, notably through carbon capture and storage (CCS) technologies. These advancements aim to enhance efficiency, reduce environmental footprint, and increase the value proposition of the industry's output.
Key Drivers, Barriers & Challenges in North Sea Region Oil & Gas Industry
Key Drivers: Rising global energy demand, technological advancements leading to cost-effective extraction, and government support for energy security initiatives are key growth drivers. Specific examples include the implementation of CCS technology and investments in offshore wind energy to diversify the energy mix.
Key Challenges: High operational costs, volatile oil prices, stringent environmental regulations, and declining reserves pose significant challenges. Supply chain disruptions and geopolitical instability also impact the industry, resulting in production delays and increased costs (estimated at xx Million in 2024).
Emerging Opportunities in North Sea Region Oil & Gas Industry
Emerging opportunities include expansion into renewable energy sources (wind, solar), development of carbon capture and storage technologies, and exploration of new resources in under-explored areas. Furthermore, advancements in digitalization and data analytics offer potential for optimized operations and reduced environmental impact.
Growth Accelerators in the North Sea Region Oil & Gas Industry Industry
Long-term growth is driven by continued technological advancements in exploration and production, strategic partnerships between oil companies and renewable energy players, and government support for a transition towards a lower-carbon energy future.
Key Players Shaping the North Sea Region Oil & Gas Industry Market
- Equinor ASA
- TotalEnergies SE
- BP Plc
- Royal Dutch Shell Plc
- Transocean Ltd
- Baker Hughes Company
- Halliburton Company
- Seadrill Ltd
- Schlumberger Limited
- Valaris PLC
Notable Milestones in North Sea Region Oil & Gas Industry Sector
- 2020: Significant decline in oil prices due to the COVID-19 pandemic.
- 2021: Increased investment in renewable energy projects.
- 2022: Announcement of several major offshore wind farm projects.
- 2023: Launch of new carbon capture and storage initiatives.
- 2024: Several mergers and acquisitions involving smaller oil and gas companies.
In-Depth North Sea Region Oil & Gas Industry Market Outlook
The future of the North Sea oil and gas industry hinges on a successful transition towards a lower-carbon energy mix. While oil and gas will remain relevant for the foreseeable future, the industry must embrace renewable energy sources and invest heavily in carbon reduction technologies to ensure long-term sustainability and competitiveness. Strategic partnerships and technological innovation will be crucial to unlock the significant growth potential that remains within the region, particularly in the development of offshore wind and CCS infrastructure.
North Sea Region Oil & Gas Industry Segmentation
-
1. Sector
- 1.1. Upstream
- 1.2. Midstream
- 1.3. Downstream
North Sea Region Oil & Gas Industry Segmentation By Geography
- 1. United Kingdom
- 2. Norway
- 3. Rest of North Sea Region
North Sea Region Oil & Gas Industry REPORT HIGHLIGHTS
| Aspects | Details |
|---|---|
| Study Period | 2019-2033 |
| Base Year | 2024 |
| Estimated Year | 2025 |
| Forecast Period | 2025-2033 |
| Historical Period | 2019-2024 |
| Growth Rate | CAGR of > 3.00% from 2019-2033 |
| Segmentation |
|
Table of Contents
- 1. Introduction
- 1.1. Research Scope
- 1.2. Market Segmentation
- 1.3. Research Methodology
- 1.4. Definitions and Assumptions
- 2. Executive Summary
- 2.1. Introduction
- 3. Market Dynamics
- 3.1. Introduction
- 3.2. Market Drivers
- 3.2.1. 4.; Increased Government Regulations for Greenhouse Gas Emissions 4.; Encouraging Production and Consumption of Renewable Aviation Fuel
- 3.3. Market Restrains
- 3.3.1. 4.; The High Costs of Renewable Aviation Fuel
- 3.4. Market Trends
- 3.4.1. Upstream Sector to Dominate the Market
- 4. Market Factor Analysis
- 4.1. Porters Five Forces
- 4.2. Supply/Value Chain
- 4.3. PESTEL analysis
- 4.4. Market Entropy
- 4.5. Patent/Trademark Analysis
- 5. Global North Sea Region Oil & Gas Industry Analysis, Insights and Forecast, 2019-2031
- 5.1. Market Analysis, Insights and Forecast - by Sector
- 5.1.1. Upstream
- 5.1.2. Midstream
- 5.1.3. Downstream
- 5.2. Market Analysis, Insights and Forecast - by Region
- 5.2.1. United Kingdom
- 5.2.2. Norway
- 5.2.3. Rest of North Sea Region
- 5.1. Market Analysis, Insights and Forecast - by Sector
- 6. United Kingdom North Sea Region Oil & Gas Industry Analysis, Insights and Forecast, 2019-2031
- 6.1. Market Analysis, Insights and Forecast - by Sector
- 6.1.1. Upstream
- 6.1.2. Midstream
- 6.1.3. Downstream
- 6.1. Market Analysis, Insights and Forecast - by Sector
- 7. Norway North Sea Region Oil & Gas Industry Analysis, Insights and Forecast, 2019-2031
- 7.1. Market Analysis, Insights and Forecast - by Sector
- 7.1.1. Upstream
- 7.1.2. Midstream
- 7.1.3. Downstream
- 7.1. Market Analysis, Insights and Forecast - by Sector
- 8. Rest of North Sea Region North Sea Region Oil & Gas Industry Analysis, Insights and Forecast, 2019-2031
- 8.1. Market Analysis, Insights and Forecast - by Sector
- 8.1.1. Upstream
- 8.1.2. Midstream
- 8.1.3. Downstream
- 8.1. Market Analysis, Insights and Forecast - by Sector
- 9. North America North Sea Region Oil & Gas Industry Analysis, Insights and Forecast, 2019-2031
- 9.1. Market Analysis, Insights and Forecast - By Country/Sub-region
- 9.1.1 United States
- 9.1.2 Canada
- 9.1.3 Mexico
- 10. Europe North Sea Region Oil & Gas Industry Analysis, Insights and Forecast, 2019-2031
- 10.1. Market Analysis, Insights and Forecast - By Country/Sub-region
- 10.1.1 Germany
- 10.1.2 United Kingdom
- 10.1.3 France
- 10.1.4 Spain
- 10.1.5 Italy
- 10.1.6 Spain
- 10.1.7 Belgium
- 10.1.8 Netherland
- 10.1.9 Nordics
- 10.1.10 Rest of Europe
- 11. Asia Pacific North Sea Region Oil & Gas Industry Analysis, Insights and Forecast, 2019-2031
- 11.1. Market Analysis, Insights and Forecast - By Country/Sub-region
- 11.1.1 China
- 11.1.2 Japan
- 11.1.3 India
- 11.1.4 South Korea
- 11.1.5 Southeast Asia
- 11.1.6 Australia
- 11.1.7 Indonesia
- 11.1.8 Phillipes
- 11.1.9 Singapore
- 11.1.10 Thailandc
- 11.1.11 Rest of Asia Pacific
- 12. South America North Sea Region Oil & Gas Industry Analysis, Insights and Forecast, 2019-2031
- 12.1. Market Analysis, Insights and Forecast - By Country/Sub-region
- 12.1.1 Brazil
- 12.1.2 Argentina
- 12.1.3 Peru
- 12.1.4 Chile
- 12.1.5 Colombia
- 12.1.6 Ecuador
- 12.1.7 Venezuela
- 12.1.8 Rest of South America
- 13. North America North Sea Region Oil & Gas Industry Analysis, Insights and Forecast, 2019-2031
- 13.1. Market Analysis, Insights and Forecast - By Country/Sub-region
- 13.1.1 United States
- 13.1.2 Canada
- 13.1.3 Mexico
- 14. MEA North Sea Region Oil & Gas Industry Analysis, Insights and Forecast, 2019-2031
- 14.1. Market Analysis, Insights and Forecast - By Country/Sub-region
- 14.1.1 United Arab Emirates
- 14.1.2 Saudi Arabia
- 14.1.3 South Africa
- 14.1.4 Rest of Middle East and Africa
- 15. Competitive Analysis
- 15.1. Global Market Share Analysis 2024
- 15.2. Company Profiles
- 15.2.1 Equinor ASA
- 15.2.1.1. Overview
- 15.2.1.2. Products
- 15.2.1.3. SWOT Analysis
- 15.2.1.4. Recent Developments
- 15.2.1.5. Financials (Based on Availability)
- 15.2.2 Total S A *List Not Exhaustive
- 15.2.2.1. Overview
- 15.2.2.2. Products
- 15.2.2.3. SWOT Analysis
- 15.2.2.4. Recent Developments
- 15.2.2.5. Financials (Based on Availability)
- 15.2.3 BP Plc
- 15.2.3.1. Overview
- 15.2.3.2. Products
- 15.2.3.3. SWOT Analysis
- 15.2.3.4. Recent Developments
- 15.2.3.5. Financials (Based on Availability)
- 15.2.4 Royal Dutch Shell Plc
- 15.2.4.1. Overview
- 15.2.4.2. Products
- 15.2.4.3. SWOT Analysis
- 15.2.4.4. Recent Developments
- 15.2.4.5. Financials (Based on Availability)
- 15.2.5 Transocean Ltd
- 15.2.5.1. Overview
- 15.2.5.2. Products
- 15.2.5.3. SWOT Analysis
- 15.2.5.4. Recent Developments
- 15.2.5.5. Financials (Based on Availability)
- 15.2.6 Baker Hughes Company
- 15.2.6.1. Overview
- 15.2.6.2. Products
- 15.2.6.3. SWOT Analysis
- 15.2.6.4. Recent Developments
- 15.2.6.5. Financials (Based on Availability)
- 15.2.7 Halliburton Company
- 15.2.7.1. Overview
- 15.2.7.2. Products
- 15.2.7.3. SWOT Analysis
- 15.2.7.4. Recent Developments
- 15.2.7.5. Financials (Based on Availability)
- 15.2.8 Seadrill Ltd
- 15.2.8.1. Overview
- 15.2.8.2. Products
- 15.2.8.3. SWOT Analysis
- 15.2.8.4. Recent Developments
- 15.2.8.5. Financials (Based on Availability)
- 15.2.9 Schlumberger Limited
- 15.2.9.1. Overview
- 15.2.9.2. Products
- 15.2.9.3. SWOT Analysis
- 15.2.9.4. Recent Developments
- 15.2.9.5. Financials (Based on Availability)
- 15.2.10 Valaris PLC
- 15.2.10.1. Overview
- 15.2.10.2. Products
- 15.2.10.3. SWOT Analysis
- 15.2.10.4. Recent Developments
- 15.2.10.5. Financials (Based on Availability)
- 15.2.1 Equinor ASA
List of Figures
- Figure 1: Global North Sea Region Oil & Gas Industry Revenue Breakdown (Million, %) by Region 2024 & 2032
- Figure 2: North America North Sea Region Oil & Gas Industry Revenue (Million), by Country 2024 & 2032
- Figure 3: North America North Sea Region Oil & Gas Industry Revenue Share (%), by Country 2024 & 2032
- Figure 4: Europe North Sea Region Oil & Gas Industry Revenue (Million), by Country 2024 & 2032
- Figure 5: Europe North Sea Region Oil & Gas Industry Revenue Share (%), by Country 2024 & 2032
- Figure 6: Asia Pacific North Sea Region Oil & Gas Industry Revenue (Million), by Country 2024 & 2032
- Figure 7: Asia Pacific North Sea Region Oil & Gas Industry Revenue Share (%), by Country 2024 & 2032
- Figure 8: South America North Sea Region Oil & Gas Industry Revenue (Million), by Country 2024 & 2032
- Figure 9: South America North Sea Region Oil & Gas Industry Revenue Share (%), by Country 2024 & 2032
- Figure 10: North America North Sea Region Oil & Gas Industry Revenue (Million), by Country 2024 & 2032
- Figure 11: North America North Sea Region Oil & Gas Industry Revenue Share (%), by Country 2024 & 2032
- Figure 12: MEA North Sea Region Oil & Gas Industry Revenue (Million), by Country 2024 & 2032
- Figure 13: MEA North Sea Region Oil & Gas Industry Revenue Share (%), by Country 2024 & 2032
- Figure 14: United Kingdom North Sea Region Oil & Gas Industry Revenue (Million), by Sector 2024 & 2032
- Figure 15: United Kingdom North Sea Region Oil & Gas Industry Revenue Share (%), by Sector 2024 & 2032
- Figure 16: United Kingdom North Sea Region Oil & Gas Industry Revenue (Million), by Country 2024 & 2032
- Figure 17: United Kingdom North Sea Region Oil & Gas Industry Revenue Share (%), by Country 2024 & 2032
- Figure 18: Norway North Sea Region Oil & Gas Industry Revenue (Million), by Sector 2024 & 2032
- Figure 19: Norway North Sea Region Oil & Gas Industry Revenue Share (%), by Sector 2024 & 2032
- Figure 20: Norway North Sea Region Oil & Gas Industry Revenue (Million), by Country 2024 & 2032
- Figure 21: Norway North Sea Region Oil & Gas Industry Revenue Share (%), by Country 2024 & 2032
- Figure 22: Rest of North Sea Region North Sea Region Oil & Gas Industry Revenue (Million), by Sector 2024 & 2032
- Figure 23: Rest of North Sea Region North Sea Region Oil & Gas Industry Revenue Share (%), by Sector 2024 & 2032
- Figure 24: Rest of North Sea Region North Sea Region Oil & Gas Industry Revenue (Million), by Country 2024 & 2032
- Figure 25: Rest of North Sea Region North Sea Region Oil & Gas Industry Revenue Share (%), by Country 2024 & 2032
List of Tables
- Table 1: Global North Sea Region Oil & Gas Industry Revenue Million Forecast, by Region 2019 & 2032
- Table 2: Global North Sea Region Oil & Gas Industry Revenue Million Forecast, by Sector 2019 & 2032
- Table 3: Global North Sea Region Oil & Gas Industry Revenue Million Forecast, by Region 2019 & 2032
- Table 4: Global North Sea Region Oil & Gas Industry Revenue Million Forecast, by Country 2019 & 2032
- Table 5: United States North Sea Region Oil & Gas Industry Revenue (Million) Forecast, by Application 2019 & 2032
- Table 6: Canada North Sea Region Oil & Gas Industry Revenue (Million) Forecast, by Application 2019 & 2032
- Table 7: Mexico North Sea Region Oil & Gas Industry Revenue (Million) Forecast, by Application 2019 & 2032
- Table 8: Global North Sea Region Oil & Gas Industry Revenue Million Forecast, by Country 2019 & 2032
- Table 9: Germany North Sea Region Oil & Gas Industry Revenue (Million) Forecast, by Application 2019 & 2032
- Table 10: United Kingdom North Sea Region Oil & Gas Industry Revenue (Million) Forecast, by Application 2019 & 2032
- Table 11: France North Sea Region Oil & Gas Industry Revenue (Million) Forecast, by Application 2019 & 2032
- Table 12: Spain North Sea Region Oil & Gas Industry Revenue (Million) Forecast, by Application 2019 & 2032
- Table 13: Italy North Sea Region Oil & Gas Industry Revenue (Million) Forecast, by Application 2019 & 2032
- Table 14: Spain North Sea Region Oil & Gas Industry Revenue (Million) Forecast, by Application 2019 & 2032
- Table 15: Belgium North Sea Region Oil & Gas Industry Revenue (Million) Forecast, by Application 2019 & 2032
- Table 16: Netherland North Sea Region Oil & Gas Industry Revenue (Million) Forecast, by Application 2019 & 2032
- Table 17: Nordics North Sea Region Oil & Gas Industry Revenue (Million) Forecast, by Application 2019 & 2032
- Table 18: Rest of Europe North Sea Region Oil & Gas Industry Revenue (Million) Forecast, by Application 2019 & 2032
- Table 19: Global North Sea Region Oil & Gas Industry Revenue Million Forecast, by Country 2019 & 2032
- Table 20: China North Sea Region Oil & Gas Industry Revenue (Million) Forecast, by Application 2019 & 2032
- Table 21: Japan North Sea Region Oil & Gas Industry Revenue (Million) Forecast, by Application 2019 & 2032
- Table 22: India North Sea Region Oil & Gas Industry Revenue (Million) Forecast, by Application 2019 & 2032
- Table 23: South Korea North Sea Region Oil & Gas Industry Revenue (Million) Forecast, by Application 2019 & 2032
- Table 24: Southeast Asia North Sea Region Oil & Gas Industry Revenue (Million) Forecast, by Application 2019 & 2032
- Table 25: Australia North Sea Region Oil & Gas Industry Revenue (Million) Forecast, by Application 2019 & 2032
- Table 26: Indonesia North Sea Region Oil & Gas Industry Revenue (Million) Forecast, by Application 2019 & 2032
- Table 27: Phillipes North Sea Region Oil & Gas Industry Revenue (Million) Forecast, by Application 2019 & 2032
- Table 28: Singapore North Sea Region Oil & Gas Industry Revenue (Million) Forecast, by Application 2019 & 2032
- Table 29: Thailandc North Sea Region Oil & Gas Industry Revenue (Million) Forecast, by Application 2019 & 2032
- Table 30: Rest of Asia Pacific North Sea Region Oil & Gas Industry Revenue (Million) Forecast, by Application 2019 & 2032
- Table 31: Global North Sea Region Oil & Gas Industry Revenue Million Forecast, by Country 2019 & 2032
- Table 32: Brazil North Sea Region Oil & Gas Industry Revenue (Million) Forecast, by Application 2019 & 2032
- Table 33: Argentina North Sea Region Oil & Gas Industry Revenue (Million) Forecast, by Application 2019 & 2032
- Table 34: Peru North Sea Region Oil & Gas Industry Revenue (Million) Forecast, by Application 2019 & 2032
- Table 35: Chile North Sea Region Oil & Gas Industry Revenue (Million) Forecast, by Application 2019 & 2032
- Table 36: Colombia North Sea Region Oil & Gas Industry Revenue (Million) Forecast, by Application 2019 & 2032
- Table 37: Ecuador North Sea Region Oil & Gas Industry Revenue (Million) Forecast, by Application 2019 & 2032
- Table 38: Venezuela North Sea Region Oil & Gas Industry Revenue (Million) Forecast, by Application 2019 & 2032
- Table 39: Rest of South America North Sea Region Oil & Gas Industry Revenue (Million) Forecast, by Application 2019 & 2032
- Table 40: Global North Sea Region Oil & Gas Industry Revenue Million Forecast, by Country 2019 & 2032
- Table 41: United States North Sea Region Oil & Gas Industry Revenue (Million) Forecast, by Application 2019 & 2032
- Table 42: Canada North Sea Region Oil & Gas Industry Revenue (Million) Forecast, by Application 2019 & 2032
- Table 43: Mexico North Sea Region Oil & Gas Industry Revenue (Million) Forecast, by Application 2019 & 2032
- Table 44: Global North Sea Region Oil & Gas Industry Revenue Million Forecast, by Country 2019 & 2032
- Table 45: United Arab Emirates North Sea Region Oil & Gas Industry Revenue (Million) Forecast, by Application 2019 & 2032
- Table 46: Saudi Arabia North Sea Region Oil & Gas Industry Revenue (Million) Forecast, by Application 2019 & 2032
- Table 47: South Africa North Sea Region Oil & Gas Industry Revenue (Million) Forecast, by Application 2019 & 2032
- Table 48: Rest of Middle East and Africa North Sea Region Oil & Gas Industry Revenue (Million) Forecast, by Application 2019 & 2032
- Table 49: Global North Sea Region Oil & Gas Industry Revenue Million Forecast, by Sector 2019 & 2032
- Table 50: Global North Sea Region Oil & Gas Industry Revenue Million Forecast, by Country 2019 & 2032
- Table 51: Global North Sea Region Oil & Gas Industry Revenue Million Forecast, by Sector 2019 & 2032
- Table 52: Global North Sea Region Oil & Gas Industry Revenue Million Forecast, by Country 2019 & 2032
- Table 53: Global North Sea Region Oil & Gas Industry Revenue Million Forecast, by Sector 2019 & 2032
- Table 54: Global North Sea Region Oil & Gas Industry Revenue Million Forecast, by Country 2019 & 2032
Frequently Asked Questions
1. What is the projected Compound Annual Growth Rate (CAGR) of the North Sea Region Oil & Gas Industry?
The projected CAGR is approximately > 3.00%.
2. Which companies are prominent players in the North Sea Region Oil & Gas Industry?
Key companies in the market include Equinor ASA, Total S A *List Not Exhaustive, BP Plc, Royal Dutch Shell Plc, Transocean Ltd, Baker Hughes Company, Halliburton Company, Seadrill Ltd, Schlumberger Limited, Valaris PLC.
3. What are the main segments of the North Sea Region Oil & Gas Industry?
The market segments include Sector.
4. Can you provide details about the market size?
The market size is estimated to be USD XX Million as of 2022.
5. What are some drivers contributing to market growth?
4.; Increased Government Regulations for Greenhouse Gas Emissions 4.; Encouraging Production and Consumption of Renewable Aviation Fuel.
6. What are the notable trends driving market growth?
Upstream Sector to Dominate the Market.
7. Are there any restraints impacting market growth?
4.; The High Costs of Renewable Aviation Fuel.
8. Can you provide examples of recent developments in the market?
N/A
9. What pricing options are available for accessing the report?
Pricing options include single-user, multi-user, and enterprise licenses priced at USD 4750, USD 5250, and USD 8750 respectively.
10. Is the market size provided in terms of value or volume?
The market size is provided in terms of value, measured in Million.
11. Are there any specific market keywords associated with the report?
Yes, the market keyword associated with the report is "North Sea Region Oil & Gas Industry," which aids in identifying and referencing the specific market segment covered.
12. How do I determine which pricing option suits my needs best?
The pricing options vary based on user requirements and access needs. Individual users may opt for single-user licenses, while businesses requiring broader access may choose multi-user or enterprise licenses for cost-effective access to the report.
13. Are there any additional resources or data provided in the North Sea Region Oil & Gas Industry report?
While the report offers comprehensive insights, it's advisable to review the specific contents or supplementary materials provided to ascertain if additional resources or data are available.
14. How can I stay updated on further developments or reports in the North Sea Region Oil & Gas Industry?
To stay informed about further developments, trends, and reports in the North Sea Region Oil & Gas Industry, consider subscribing to industry newsletters, following relevant companies and organizations, or regularly checking reputable industry news sources and publications.
Methodology
Step 1 - Identification of Relevant Samples Size from Population Database


Step 2 - Approaches for Defining Global Market Size (Value, Volume* & Price*)

Note*: In applicable scenarios
Step 3 - Data Sources
Primary Research
- Web Analytics
- Survey Reports
- Research Institute
- Latest Research Reports
- Opinion Leaders
Secondary Research
- Annual Reports
- White Paper
- Latest Press Release
- Industry Association
- Paid Database
- Investor Presentations

Step 4 - Data Triangulation
Involves using different sources of information in order to increase the validity of a study
These sources are likely to be stakeholders in a program - participants, other researchers, program staff, other community members, and so on.
Then we put all data in single framework & apply various statistical tools to find out the dynamic on the market.
During the analysis stage, feedback from the stakeholder groups would be compared to determine areas of agreement as well as areas of divergence
