

Key Insights
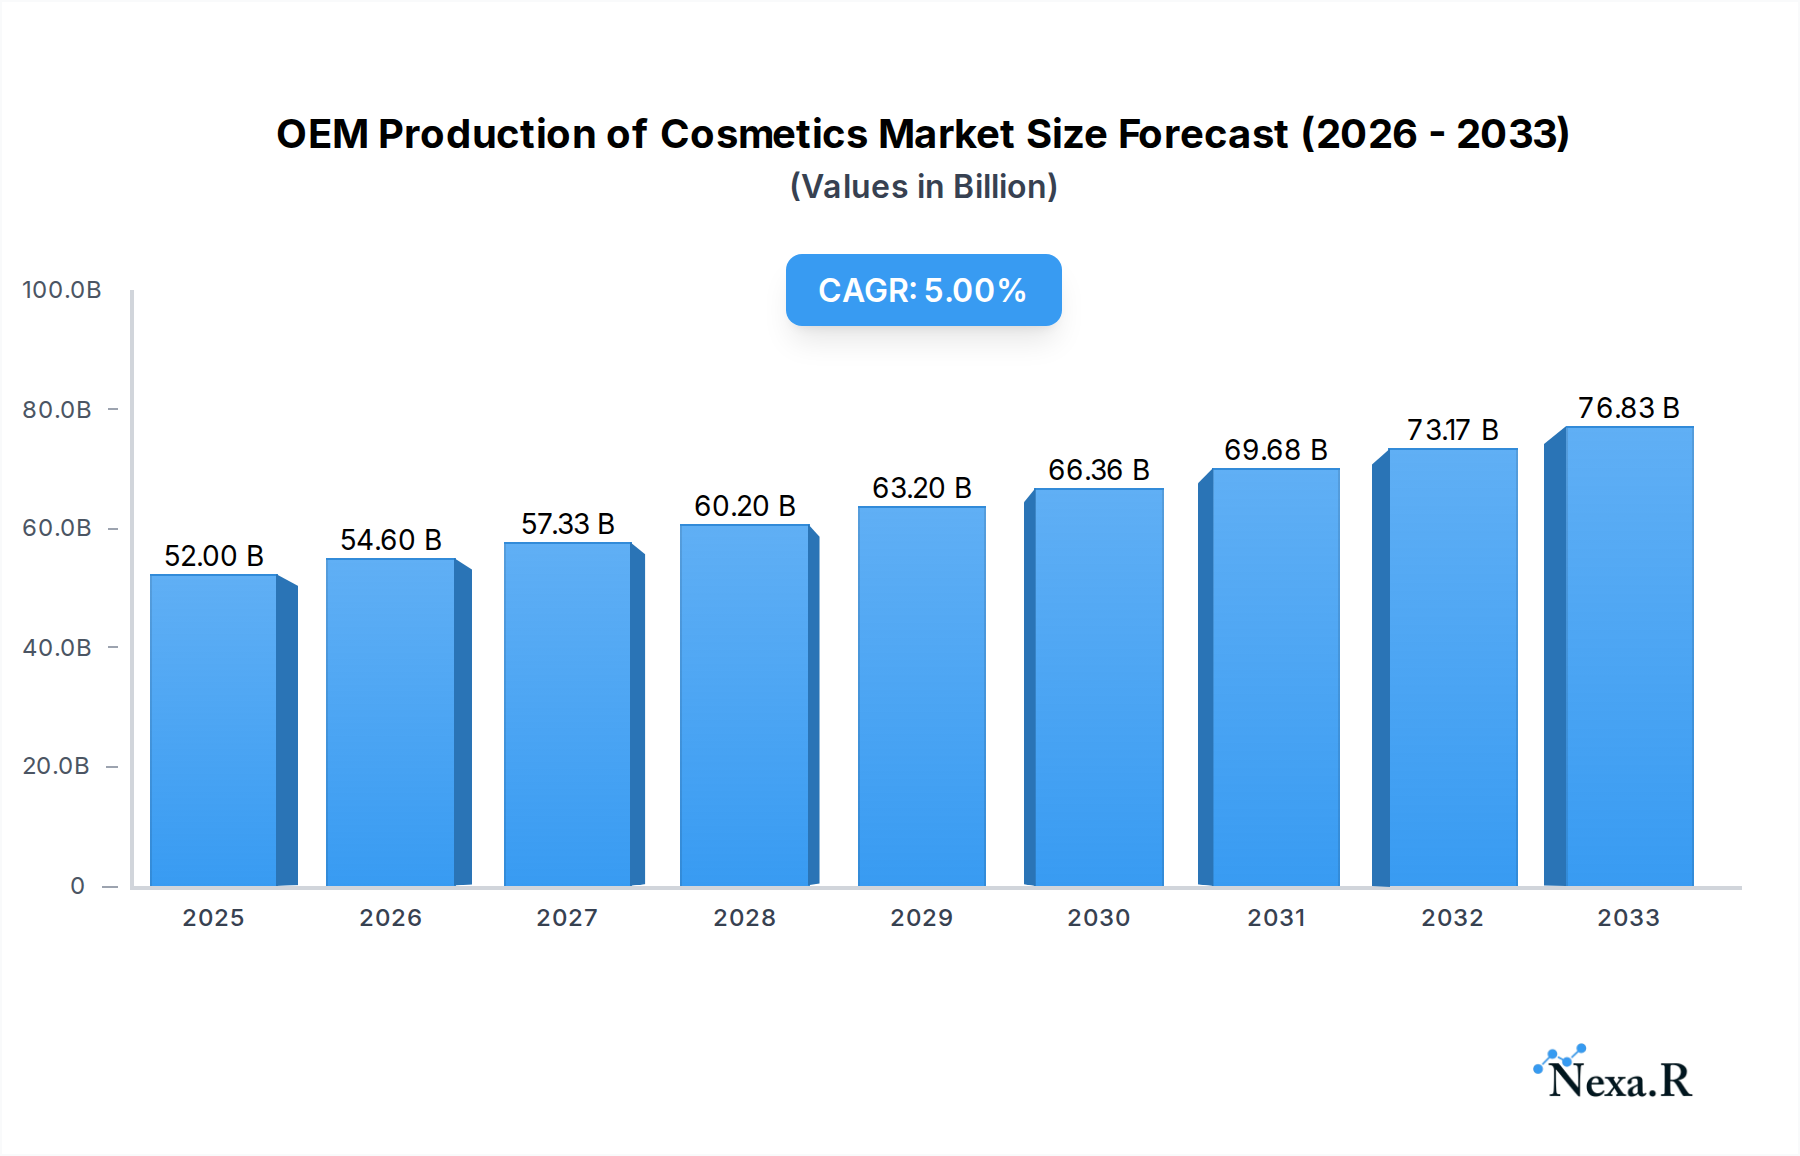
The global OEM production of cosmetics market is poised for substantial growth, projected to reach $52,000 million by 2025, expanding at a Compound Annual Growth Rate (CAGR) of 5% through 2033. This robust expansion is primarily fueled by several key drivers, including the burgeoning demand for personalized beauty products, the increasing trend of contract manufacturing for both established brands and emerging startups, and the growing influence of e-commerce in democratizing access to cosmetic production. The market is also benefiting from advancements in formulation technologies and the rising consumer preference for innovative and specialized beauty solutions. Furthermore, the outsourcing of manufacturing by brands seeking cost efficiencies and faster time-to-market significantly contributes to this upward trajectory. The OEM segment within cosmetics production is particularly dynamic, enabling businesses to leverage specialized expertise and infrastructure without the burden of in-house development and manufacturing.

OEM Production of Cosmetics Market Size (In Billion)
Looking ahead, the market will continue to be shaped by evolving consumer preferences and technological advancements. The growing emphasis on clean beauty, sustainability, and ethical sourcing will necessitate OEM manufacturers to adapt their offerings and production processes. Innovations in ingredient science, packaging solutions, and formulation techniques will create new opportunities for growth. While the market presents immense potential, certain restraints such as fluctuating raw material costs and stringent regulatory compliances across different regions could pose challenges. However, the overall outlook remains highly optimistic, driven by the increasing globalization of the beauty industry and the consistent demand for a diverse range of cosmetic products, spanning skincare, makeup, and personal care. The market's segmentation by application, including ODM, OEM, and OBM, and by product type underscores its multifaceted nature and the varied strategies employed by key players.
OEM Production of Cosmetics Company Market Share
Unlock deep insights into the global OEM (Original Equipment Manufacturer) production of cosmetics market. This in-depth report provides a 360-degree view of market dynamics, growth trajectories, regional dominance, product innovations, and strategic opportunities. Covering the historical period (2019-2024), base year (2025), and forecast period (2025-2033), this analysis is essential for stakeholders seeking to navigate the evolving landscape of private label cosmetics manufacturing, contract manufacturing, and beauty product development.
OEM Production of Cosmetics Market Dynamics & Structure
The OEM production of cosmetics market is characterized by a moderately concentrated structure, with a few leading players commanding significant market share, alongside a growing number of specialized manufacturers catering to niche demands. Technological innovation is a primary driver, fueled by advancements in ingredient formulation, sustainable packaging solutions, and cutting-edge delivery systems for skincare, makeup, and personal care products. Regulatory frameworks, particularly concerning ingredient safety, efficacy claims, and environmental impact, are becoming increasingly stringent globally, shaping manufacturing processes and product development. Competitive product substitutes include readily available branded products and the growing DIY beauty trend. End-user demographics are shifting, with a rising demand for personalized, clean beauty, and efficacy-driven formulations across all age groups. Mergers and acquisitions (M&A) trends are observed as larger companies seek to expand their capabilities, acquire innovative technologies, or gain access to new markets. For instance, the market witnessed approximately 15 significant M&A deals within the historical period, with an estimated combined value of $1.2 billion.
- Market Concentration: Dominated by key players like COSMAX and KOLMAR KOREA, with an increasing presence of agile mid-sized and smaller specialized manufacturers.
- Technological Innovation: Driven by advancements in bio-fermentation, nanotechnology for ingredient delivery, and sustainable material science for packaging.
- Regulatory Frameworks: Strict adherence to FDA, EU Cosmetics Regulation, and various national cosmetic safety standards, impacting formulation and claims.
- Competitive Landscape: Intense competition from established beauty brands and an emerging direct-to-consumer (DTC) model.
- End-User Demographics: Growing demand for vegan, cruelty-free, and scientifically proven cosmetic products.
- M&A Trends: Strategic acquisitions to bolster R&D capabilities and expand product portfolios.
OEM Production of Cosmetics Growth Trends & Insights
The OEM production of cosmetics market is poised for robust growth, projected to expand at a Compound Annual Growth Rate (CAGR) of approximately 7.8% from 2025 to 2033. This expansion is underpinned by several key trends. Firstly, the increasing popularity of private label brands and the growing number of indie beauty startups seeking expert manufacturing partners significantly boost demand for OEM services. In the base year 2025, the global market size for OEM cosmetic production is estimated at a substantial $75.5 billion. This figure is expected to climb to $135.2 billion by 2033. The adoption rate of outsourced cosmetic manufacturing continues to rise as brands focus on marketing and distribution, entrusting production to specialized OEM facilities. Technological disruptions are playing a crucial role, with AI-powered formulation development, advanced skincare ingredients, and innovative packaging materials becoming increasingly sought after. Consumer behavior shifts are a major catalyst, reflecting a heightened awareness of ingredient transparency, sustainability, and personalized beauty solutions. This translates into a higher demand for specialized OEM capabilities, such as the production of clean beauty products, personalized formulations based on genetic data, and eco-friendly packaging options. The penetration of OEM services across all cosmetic segments, including skincare, makeup, and personal care, is expanding, indicating a mature and diversified market. The estimated market size for skincare OEM is $35.8 billion, makeup OEM stands at $28.7 billion, and personal care OEM at $11.0 billion in 2025.
Dominant Regions, Countries, or Segments in OEM Production of Cosmetics
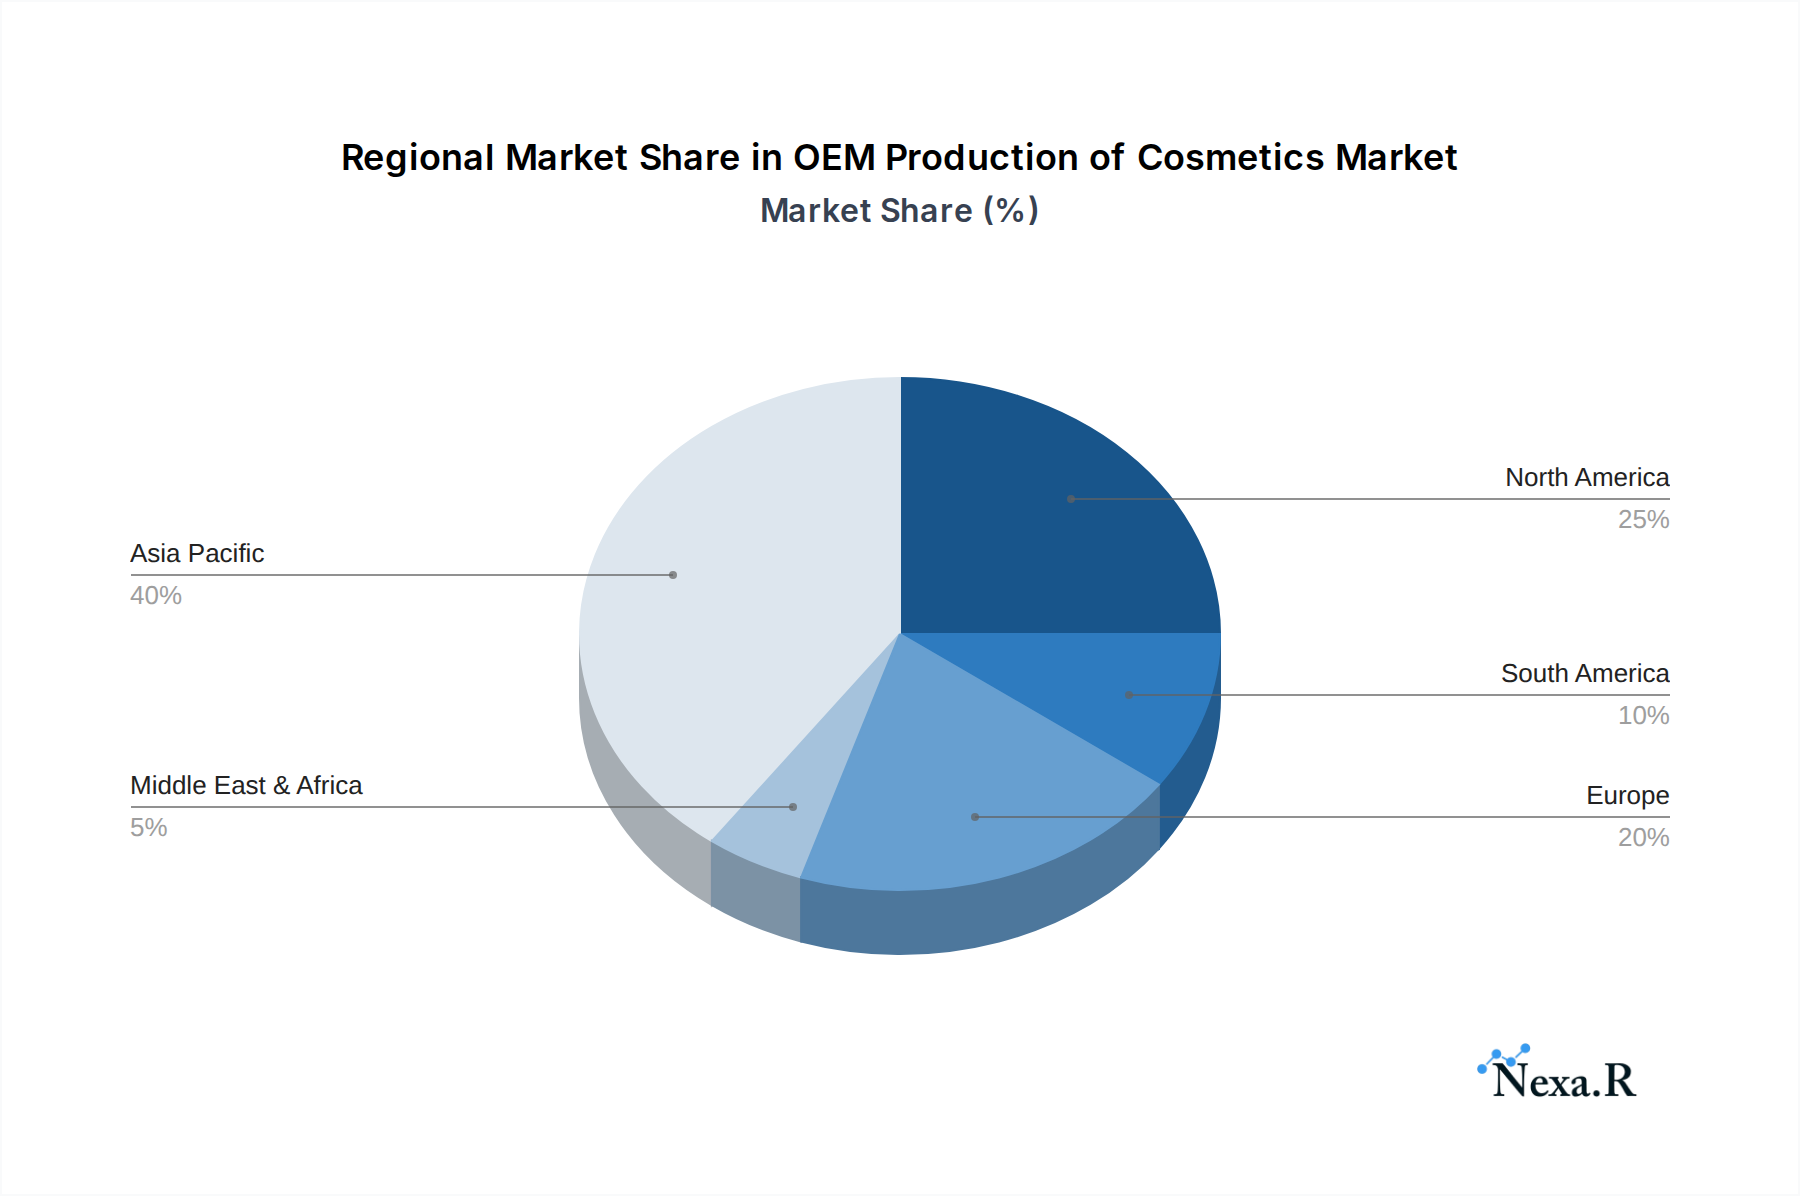
The Asia Pacific region is a dominant force in the OEM production of cosmetics market, driven by its robust manufacturing infrastructure, skilled labor force, and a burgeoning domestic consumer base for beauty products. Within Asia Pacific, China stands out as a leading country, boasting a vast network of OEM manufacturers, from large-scale operations to specialized facilities. This dominance is fueled by cost-effectiveness, rapid product development cycles, and government support for the manufacturing sector. The Skin Care segment, under the OEM application, is a significant growth driver, contributing an estimated $35.8 billion in 2025. This segment's prominence is attributed to the ever-increasing global demand for anti-aging, whitening, moisturizing, and sun protection products, all of which are extensively outsourced to OEM producers. Key drivers for China's dominance include its extensive supply chain for raw materials, significant investment in R&D by local and international companies, and favorable trade policies. South Korea and Japan also play crucial roles within Asia Pacific, particularly in high-end and technologically advanced skincare and makeup formulations, contributing to the region's overall market share, estimated at 45% of the global OEM cosmetics market in 2025. The region's growth potential is further amplified by the increasing disposable income and evolving consumer preferences in emerging economies within Asia.
- Leading Region: Asia Pacific (estimated 45% market share in 2025)
- Leading Country: China (significant manufacturing hub and export base)
- Dominant Application: OEM (contract manufacturing for established and emerging brands)
- Dominant Type: Skin Care (driven by global demand for efficacy and anti-aging solutions)
- Key Drivers in China: Cost-effectiveness, extensive supply chain, government support, rapid development cycles.
- Market Share (2025 Estimates):
- Skin Care OEM: $35.8 billion
- Makeup OEM: $28.7 billion
- Personal Care OEM: $11.0 billion
- Other OEM: $0.0 billion
OEM Production of Cosmetics Product Landscape
The OEM production of cosmetics market is characterized by a diverse and innovative product landscape, reflecting evolving consumer demands and technological advancements. Manufacturers are increasingly specializing in formulations that cater to specific needs, such as clean beauty, vegan, cruelty-free, and personalized skincare. Unique selling propositions often lie in advanced ingredient sourcing, proprietary formulation technologies, and sustainable packaging solutions. For instance, the development of potent, nature-derived active ingredients and biodegradable packaging materials are key differentiators. Performance metrics are rigorously tested, focusing on efficacy, safety, and stability. The market sees a significant output of anti-aging serums, brightening creams, personalized makeup foundations, and microbiome-friendly personal care products.
Key Drivers, Barriers & Challenges in OEM Production of Cosmetics
The OEM production of cosmetics market is propelled by several key drivers. The escalating demand for private label brands, the growth of indie beauty startups, and the cost-efficiency of outsourcing production are primary forces. Technological advancements in ingredient science and formulation, coupled with increasing consumer interest in specialized and personalized products, further accelerate market growth.
- Technological Advancement: Innovations in active ingredients, delivery systems, and sustainable materials.
- Consumer Demand: Rising preference for personalized, clean, and efficacy-driven beauty products.
- Cost Efficiency: Outsourcing production to OEMs offers economies of scale and reduces overhead for brands.
- Agility and Speed-to-Market: OEMs enable brands to quickly adapt to trends and launch new products.
However, the market faces significant barriers and challenges. Stringent and evolving regulatory frameworks across different regions can be complex and costly to navigate. Supply chain disruptions, particularly concerning the availability and cost of raw materials and packaging components, pose a constant threat. Intense competition from established brands and other OEMs can lead to price pressures and reduced profit margins. Ensuring consistent quality and scalability for growing brands can also be a challenge.
- Regulatory Hurdles: Navigating diverse and changing international cosmetic regulations.
- Supply Chain Volatility: Fluctuations in raw material costs and availability, impacting production timelines.
- Intense Competition: Price wars and the need for constant innovation to differentiate.
- Quality Control & Scalability: Maintaining high standards while scaling production to meet demand.
Emerging Opportunities in OEM Production of Cosmetics
Emerging opportunities in the OEM production of cosmetics lie in the burgeoning demand for sustainable and eco-friendly solutions. This includes the development of biodegradable packaging, ethically sourced ingredients, and waterless formulations. The rise of personalized beauty, driven by advancements in AI and genetic testing, presents a significant avenue for OEMs capable of offering custom formulation services. Untapped markets in emerging economies, with their growing middle class and increasing disposable income, also offer substantial growth potential.
- Sustainable and Clean Beauty: Focus on natural, organic, vegan, and cruelty-free ingredients and packaging.
- Personalized Beauty Solutions: Leveraging technology for custom formulations and tailored product lines.
- Emerging Market Expansion: Catering to the growing beauty needs in developing economies.
- Niche Product Development: Specializing in innovative categories like microbiome-friendly products or CBD-infused cosmetics.
Growth Accelerators in the OEM Production of Cosmetics Industry
Long-term growth in the OEM production of cosmetics industry is significantly accelerated by strategic partnerships between brands and manufacturers that foster innovation and co-development. Technological breakthroughs, such as advancements in biotechnological ingredients, nano-encapsulation for enhanced efficacy, and AI-driven product development platforms, are pivotal. Market expansion strategies, including the establishment of new manufacturing facilities in strategic locations to serve growing regional demands or the diversification into new product categories, also act as powerful growth catalysts. The increasing trend of brands focusing on their core competencies (marketing, sales) while entrusting manufacturing to specialized OEMs further bolsters this growth trajectory.
Key Players Shaping the OEM Production of Cosmetics Market
- NIHON KOLMAR
- COSMAX
- KOLMAR KOREA
- Intertek Technology (Suzhou Industrial Park) Co.,Ltd.
- Guangzhou Dongfang Biotechnology Co.,Ltd.
- Guangdong Bawei Biotechnology Co.,Ltd.
- Jiangsu Meiaisi Cosmetics Co.,Ltd.
- Shanghai Zhenchen Cosmetics Co.,Ltd.
- Shanghai Chuangyuan Cosmetics Company
- Beijing Dongcai Daily Chemicals Co.,Ltd.
- Guangdong Sanhao Technology Co.,Ltd.
- Shanghai Paris Shidi Daily Chemical Co.,Ltd.
- Liangguan Biochemical Technology Co.,Ltd.
- North Bell Cosmetics Co.,Ltd.
- BioTruly Company
- Beihao Group
Notable Milestones in OEM Production of Cosmetics Sector
- 2020: COSMAX and KOLMAR KOREA significantly increased their investment in R&D for K-beauty formulations, leading to a surge in export growth.
- 2021: Growing consumer awareness drove a substantial demand for "clean beauty" ingredients, prompting many OEMs to develop specialized eco-friendly product lines.
- 2022: Intertek Technology (Suzhou Industrial Park) Co.,Ltd. expanded its R&D facilities, focusing on advanced skincare ingredient research and development, meeting the demand for high-efficacy products.
- 2023: A surge in M&A activities, with several mid-sized OEMs being acquired by larger conglomerates seeking to enhance their market presence and technological capabilities.
- 2024: Increased focus on sustainable packaging solutions, with many manufacturers investing in biodegradable and recyclable materials to meet brand and consumer expectations.
In-Depth OEM Production of Cosmetics Market Outlook
The OEM production of cosmetics market is set for continued expansion, driven by a convergence of powerful growth accelerators. Technological breakthroughs in sustainable ingredient sourcing and advanced formulation techniques will empower OEMs to offer innovative and eco-conscious products. Strategic partnerships between leading cosmetic brands and agile OEM manufacturers will foster co-creation and rapid market penetration. The ongoing shift towards personalized beauty, coupled with the expansion into untapped emerging markets, presents substantial future potential. This dynamic environment offers significant opportunities for OEMs that can adapt to evolving consumer preferences, embrace technological innovation, and maintain high standards of quality and sustainability.
OEM Production of Cosmetics Segmentation
-
1. Application
- 1.1. ODM
- 1.2. OEM
- 1.3. OBM
-
2. Types
- 2.1. Skin Care
- 2.2. Makeup
- 2.3. Personal Care
- 2.4. Other
OEM Production of Cosmetics Segmentation By Geography
-
1. North America
- 1.1. United States
- 1.2. Canada
- 1.3. Mexico
-
2. South America
- 2.1. Brazil
- 2.2. Argentina
- 2.3. Rest of South America
-
3. Europe
- 3.1. United Kingdom
- 3.2. Germany
- 3.3. France
- 3.4. Italy
- 3.5. Spain
- 3.6. Russia
- 3.7. Benelux
- 3.8. Nordics
- 3.9. Rest of Europe
-
4. Middle East & Africa
- 4.1. Turkey
- 4.2. Israel
- 4.3. GCC
- 4.4. North Africa
- 4.5. South Africa
- 4.6. Rest of Middle East & Africa
-
5. Asia Pacific
- 5.1. China
- 5.2. India
- 5.3. Japan
- 5.4. South Korea
- 5.5. ASEAN
- 5.6. Oceania
- 5.7. Rest of Asia Pacific
OEM Production of Cosmetics Regional Market Share
Geographic Coverage of OEM Production of Cosmetics
OEM Production of Cosmetics REPORT HIGHLIGHTS
| Aspects | Details |
|---|---|
| Study Period | 2020-2034 |
| Base Year | 2025 |
| Estimated Year | 2026 |
| Forecast Period | 2026-2034 |
| Historical Period | 2020-2025 |
| Growth Rate | CAGR of 7.3% from 2020-2034 |
| Segmentation |
|
Table of Contents
- 1. Introduction
- 1.1. Research Scope
- 1.2. Market Segmentation
- 1.3. Research Objective
- 1.4. Definitions and Assumptions
- 2. Executive Summary
- 2.1. Market Snapshot
- 3. Market Dynamics
- 3.1. Market Drivers
- 3.2. Market Restrains
- 3.3. Market Trends
- 3.4. Market Opportunities
- 4. Market Factor Analysis
- 4.1. Porters Five Forces
- 4.1.1. Bargaining Power of Suppliers
- 4.1.2. Bargaining Power of Buyers
- 4.1.3. Threat of New Entrants
- 4.1.4. Threat of Substitutes
- 4.1.5. Competitive Rivalry
- 4.2. PESTEL analysis
- 4.3. BCG Analysis
- 4.3.1. Stars (High Growth, High Market Share)
- 4.3.2. Cash Cows (Low Growth, High Market Share)
- 4.3.3. Question Mark (High Growth, Low Market Share)
- 4.3.4. Dogs (Low Growth, Low Market Share)
- 4.4. Ansoff Matrix Analysis
- 4.5. Supply Chain Analysis
- 4.6. Regulatory Landscape
- 4.7. Current Market Potential and Opportunity Assessment (TAM–SAM–SOM Framework)
- 4.8. NRP Analyst Note
- 4.1. Porters Five Forces
- 5. Market Analysis, Insights and Forecast 2021-2033
- 5.1. Market Analysis, Insights and Forecast - by Application
- 5.1.1. ODM
- 5.1.2. OEM
- 5.1.3. OBM
- 5.2. Market Analysis, Insights and Forecast - by Types
- 5.2.1. Skin Care
- 5.2.2. Makeup
- 5.2.3. Personal Care
- 5.2.4. Other
- 5.3. Market Analysis, Insights and Forecast - by Region
- 5.3.1. North America
- 5.3.2. South America
- 5.3.3. Europe
- 5.3.4. Middle East & Africa
- 5.3.5. Asia Pacific
- 5.1. Market Analysis, Insights and Forecast - by Application
- 6. Global OEM Production of Cosmetics Analysis, Insights and Forecast, 2021-2033
- 6.1. Market Analysis, Insights and Forecast - by Application
- 6.1.1. ODM
- 6.1.2. OEM
- 6.1.3. OBM
- 6.2. Market Analysis, Insights and Forecast - by Types
- 6.2.1. Skin Care
- 6.2.2. Makeup
- 6.2.3. Personal Care
- 6.2.4. Other
- 6.1. Market Analysis, Insights and Forecast - by Application
- 7. North America OEM Production of Cosmetics Analysis, Insights and Forecast, 2020-2032
- 7.1. Market Analysis, Insights and Forecast - by Application
- 7.1.1. ODM
- 7.1.2. OEM
- 7.1.3. OBM
- 7.2. Market Analysis, Insights and Forecast - by Types
- 7.2.1. Skin Care
- 7.2.2. Makeup
- 7.2.3. Personal Care
- 7.2.4. Other
- 7.1. Market Analysis, Insights and Forecast - by Application
- 8. South America OEM Production of Cosmetics Analysis, Insights and Forecast, 2020-2032
- 8.1. Market Analysis, Insights and Forecast - by Application
- 8.1.1. ODM
- 8.1.2. OEM
- 8.1.3. OBM
- 8.2. Market Analysis, Insights and Forecast - by Types
- 8.2.1. Skin Care
- 8.2.2. Makeup
- 8.2.3. Personal Care
- 8.2.4. Other
- 8.1. Market Analysis, Insights and Forecast - by Application
- 9. Europe OEM Production of Cosmetics Analysis, Insights and Forecast, 2020-2032
- 9.1. Market Analysis, Insights and Forecast - by Application
- 9.1.1. ODM
- 9.1.2. OEM
- 9.1.3. OBM
- 9.2. Market Analysis, Insights and Forecast - by Types
- 9.2.1. Skin Care
- 9.2.2. Makeup
- 9.2.3. Personal Care
- 9.2.4. Other
- 9.1. Market Analysis, Insights and Forecast - by Application
- 10. Middle East & Africa OEM Production of Cosmetics Analysis, Insights and Forecast, 2020-2032
- 10.1. Market Analysis, Insights and Forecast - by Application
- 10.1.1. ODM
- 10.1.2. OEM
- 10.1.3. OBM
- 10.2. Market Analysis, Insights and Forecast - by Types
- 10.2.1. Skin Care
- 10.2.2. Makeup
- 10.2.3. Personal Care
- 10.2.4. Other
- 10.1. Market Analysis, Insights and Forecast - by Application
- 11. Asia Pacific OEM Production of Cosmetics Analysis, Insights and Forecast, 2020-2032
- 11.1. Market Analysis, Insights and Forecast - by Application
- 11.1.1. ODM
- 11.1.2. OEM
- 11.1.3. OBM
- 11.2. Market Analysis, Insights and Forecast - by Types
- 11.2.1. Skin Care
- 11.2.2. Makeup
- 11.2.3. Personal Care
- 11.2.4. Other
- 11.1. Market Analysis, Insights and Forecast - by Application
- 12. Competitive Analysis
- 12.1. Company Profiles
- 12.1.1 NIHON KOLMAR
- 12.1.1.1. Company Overview
- 12.1.1.2. Products
- 12.1.1.3. Company Financials
- 12.1.1.4. SWOT Analysis
- 12.1.2 COSMAX
- 12.1.2.1. Company Overview
- 12.1.2.2. Products
- 12.1.2.3. Company Financials
- 12.1.2.4. SWOT Analysis
- 12.1.3 KOLMAR KOREA
- 12.1.3.1. Company Overview
- 12.1.3.2. Products
- 12.1.3.3. Company Financials
- 12.1.3.4. SWOT Analysis
- 12.1.4 Intertek Technology (Suzhou Industrial Park) Co.
- 12.1.4.1. Company Overview
- 12.1.4.2. Products
- 12.1.4.3. Company Financials
- 12.1.4.4. SWOT Analysis
- 12.1.5 Ltd.
- 12.1.5.1. Company Overview
- 12.1.5.2. Products
- 12.1.5.3. Company Financials
- 12.1.5.4. SWOT Analysis
- 12.1.6 Guangzhou Dongfang Biotechnology Co.
- 12.1.6.1. Company Overview
- 12.1.6.2. Products
- 12.1.6.3. Company Financials
- 12.1.6.4. SWOT Analysis
- 12.1.7 Ltd.
- 12.1.7.1. Company Overview
- 12.1.7.2. Products
- 12.1.7.3. Company Financials
- 12.1.7.4. SWOT Analysis
- 12.1.8 Guangdong Bawei Biotechnology Co.
- 12.1.8.1. Company Overview
- 12.1.8.2. Products
- 12.1.8.3. Company Financials
- 12.1.8.4. SWOT Analysis
- 12.1.9 Ltd.
- 12.1.9.1. Company Overview
- 12.1.9.2. Products
- 12.1.9.3. Company Financials
- 12.1.9.4. SWOT Analysis
- 12.1.10 Jiangsu Meiaisi Cosmetics Co.
- 12.1.10.1. Company Overview
- 12.1.10.2. Products
- 12.1.10.3. Company Financials
- 12.1.10.4. SWOT Analysis
- 12.1.11 Ltd.
- 12.1.11.1. Company Overview
- 12.1.11.2. Products
- 12.1.11.3. Company Financials
- 12.1.11.4. SWOT Analysis
- 12.1.12 Shanghai Zhenchen Cosmetics Co.
- 12.1.12.1. Company Overview
- 12.1.12.2. Products
- 12.1.12.3. Company Financials
- 12.1.12.4. SWOT Analysis
- 12.1.13 Ltd.
- 12.1.13.1. Company Overview
- 12.1.13.2. Products
- 12.1.13.3. Company Financials
- 12.1.13.4. SWOT Analysis
- 12.1.14 Shanghai Chuangyuan Cosmetics Company
- 12.1.14.1. Company Overview
- 12.1.14.2. Products
- 12.1.14.3. Company Financials
- 12.1.14.4. SWOT Analysis
- 12.1.15 Beijing Dongcai Daily Chemicals Co.
- 12.1.15.1. Company Overview
- 12.1.15.2. Products
- 12.1.15.3. Company Financials
- 12.1.15.4. SWOT Analysis
- 12.1.16 Ltd.
- 12.1.16.1. Company Overview
- 12.1.16.2. Products
- 12.1.16.3. Company Financials
- 12.1.16.4. SWOT Analysis
- 12.1.17 Guangdong Sanhao Technology Co.
- 12.1.17.1. Company Overview
- 12.1.17.2. Products
- 12.1.17.3. Company Financials
- 12.1.17.4. SWOT Analysis
- 12.1.18 Ltd.
- 12.1.18.1. Company Overview
- 12.1.18.2. Products
- 12.1.18.3. Company Financials
- 12.1.18.4. SWOT Analysis
- 12.1.19 Shanghai Paris Shidi Daily Chemical Co.
- 12.1.19.1. Company Overview
- 12.1.19.2. Products
- 12.1.19.3. Company Financials
- 12.1.19.4. SWOT Analysis
- 12.1.20 Ltd.
- 12.1.20.1. Company Overview
- 12.1.20.2. Products
- 12.1.20.3. Company Financials
- 12.1.20.4. SWOT Analysis
- 12.1.21 Liangguan Biochemical Technology Co.
- 12.1.21.1. Company Overview
- 12.1.21.2. Products
- 12.1.21.3. Company Financials
- 12.1.21.4. SWOT Analysis
- 12.1.22 Ltd.
- 12.1.22.1. Company Overview
- 12.1.22.2. Products
- 12.1.22.3. Company Financials
- 12.1.22.4. SWOT Analysis
- 12.1.23 North Bell Cosmetics Co.
- 12.1.23.1. Company Overview
- 12.1.23.2. Products
- 12.1.23.3. Company Financials
- 12.1.23.4. SWOT Analysis
- 12.1.24 Ltd.
- 12.1.24.1. Company Overview
- 12.1.24.2. Products
- 12.1.24.3. Company Financials
- 12.1.24.4. SWOT Analysis
- 12.1.25 BioTruly Company
- 12.1.25.1. Company Overview
- 12.1.25.2. Products
- 12.1.25.3. Company Financials
- 12.1.25.4. SWOT Analysis
- 12.1.26 Beihao Group
- 12.1.26.1. Company Overview
- 12.1.26.2. Products
- 12.1.26.3. Company Financials
- 12.1.26.4. SWOT Analysis
- 12.1.1 NIHON KOLMAR
- 12.2. Market Entropy
- 12.2.1 Company's Key Areas Served
- 12.2.2 Recent Developments
- 12.3. Company Market Share Analysis 2025
- 12.3.1 Top 5 Companies Market Share Analysis
- 12.3.2 Top 3 Companies Market Share Analysis
- 12.4. List of Potential Customers
- 13. Research Methodology
List of Figures
- Figure 1: Global OEM Production of Cosmetics Revenue Breakdown (billion, %) by Region 2025 & 2033
- Figure 2: North America OEM Production of Cosmetics Revenue (billion), by Application 2025 & 2033
- Figure 3: North America OEM Production of Cosmetics Revenue Share (%), by Application 2025 & 2033
- Figure 4: North America OEM Production of Cosmetics Revenue (billion), by Types 2025 & 2033
- Figure 5: North America OEM Production of Cosmetics Revenue Share (%), by Types 2025 & 2033
- Figure 6: North America OEM Production of Cosmetics Revenue (billion), by Country 2025 & 2033
- Figure 7: North America OEM Production of Cosmetics Revenue Share (%), by Country 2025 & 2033
- Figure 8: South America OEM Production of Cosmetics Revenue (billion), by Application 2025 & 2033
- Figure 9: South America OEM Production of Cosmetics Revenue Share (%), by Application 2025 & 2033
- Figure 10: South America OEM Production of Cosmetics Revenue (billion), by Types 2025 & 2033
- Figure 11: South America OEM Production of Cosmetics Revenue Share (%), by Types 2025 & 2033
- Figure 12: South America OEM Production of Cosmetics Revenue (billion), by Country 2025 & 2033
- Figure 13: South America OEM Production of Cosmetics Revenue Share (%), by Country 2025 & 2033
- Figure 14: Europe OEM Production of Cosmetics Revenue (billion), by Application 2025 & 2033
- Figure 15: Europe OEM Production of Cosmetics Revenue Share (%), by Application 2025 & 2033
- Figure 16: Europe OEM Production of Cosmetics Revenue (billion), by Types 2025 & 2033
- Figure 17: Europe OEM Production of Cosmetics Revenue Share (%), by Types 2025 & 2033
- Figure 18: Europe OEM Production of Cosmetics Revenue (billion), by Country 2025 & 2033
- Figure 19: Europe OEM Production of Cosmetics Revenue Share (%), by Country 2025 & 2033
- Figure 20: Middle East & Africa OEM Production of Cosmetics Revenue (billion), by Application 2025 & 2033
- Figure 21: Middle East & Africa OEM Production of Cosmetics Revenue Share (%), by Application 2025 & 2033
- Figure 22: Middle East & Africa OEM Production of Cosmetics Revenue (billion), by Types 2025 & 2033
- Figure 23: Middle East & Africa OEM Production of Cosmetics Revenue Share (%), by Types 2025 & 2033
- Figure 24: Middle East & Africa OEM Production of Cosmetics Revenue (billion), by Country 2025 & 2033
- Figure 25: Middle East & Africa OEM Production of Cosmetics Revenue Share (%), by Country 2025 & 2033
- Figure 26: Asia Pacific OEM Production of Cosmetics Revenue (billion), by Application 2025 & 2033
- Figure 27: Asia Pacific OEM Production of Cosmetics Revenue Share (%), by Application 2025 & 2033
- Figure 28: Asia Pacific OEM Production of Cosmetics Revenue (billion), by Types 2025 & 2033
- Figure 29: Asia Pacific OEM Production of Cosmetics Revenue Share (%), by Types 2025 & 2033
- Figure 30: Asia Pacific OEM Production of Cosmetics Revenue (billion), by Country 2025 & 2033
- Figure 31: Asia Pacific OEM Production of Cosmetics Revenue Share (%), by Country 2025 & 2033
List of Tables
- Table 1: Global OEM Production of Cosmetics Revenue billion Forecast, by Application 2020 & 2033
- Table 2: Global OEM Production of Cosmetics Revenue billion Forecast, by Types 2020 & 2033
- Table 3: Global OEM Production of Cosmetics Revenue billion Forecast, by Region 2020 & 2033
- Table 4: Global OEM Production of Cosmetics Revenue billion Forecast, by Application 2020 & 2033
- Table 5: Global OEM Production of Cosmetics Revenue billion Forecast, by Types 2020 & 2033
- Table 6: Global OEM Production of Cosmetics Revenue billion Forecast, by Country 2020 & 2033
- Table 7: United States OEM Production of Cosmetics Revenue (billion) Forecast, by Application 2020 & 2033
- Table 8: Canada OEM Production of Cosmetics Revenue (billion) Forecast, by Application 2020 & 2033
- Table 9: Mexico OEM Production of Cosmetics Revenue (billion) Forecast, by Application 2020 & 2033
- Table 10: Global OEM Production of Cosmetics Revenue billion Forecast, by Application 2020 & 2033
- Table 11: Global OEM Production of Cosmetics Revenue billion Forecast, by Types 2020 & 2033
- Table 12: Global OEM Production of Cosmetics Revenue billion Forecast, by Country 2020 & 2033
- Table 13: Brazil OEM Production of Cosmetics Revenue (billion) Forecast, by Application 2020 & 2033
- Table 14: Argentina OEM Production of Cosmetics Revenue (billion) Forecast, by Application 2020 & 2033
- Table 15: Rest of South America OEM Production of Cosmetics Revenue (billion) Forecast, by Application 2020 & 2033
- Table 16: Global OEM Production of Cosmetics Revenue billion Forecast, by Application 2020 & 2033
- Table 17: Global OEM Production of Cosmetics Revenue billion Forecast, by Types 2020 & 2033
- Table 18: Global OEM Production of Cosmetics Revenue billion Forecast, by Country 2020 & 2033
- Table 19: United Kingdom OEM Production of Cosmetics Revenue (billion) Forecast, by Application 2020 & 2033
- Table 20: Germany OEM Production of Cosmetics Revenue (billion) Forecast, by Application 2020 & 2033
- Table 21: France OEM Production of Cosmetics Revenue (billion) Forecast, by Application 2020 & 2033
- Table 22: Italy OEM Production of Cosmetics Revenue (billion) Forecast, by Application 2020 & 2033
- Table 23: Spain OEM Production of Cosmetics Revenue (billion) Forecast, by Application 2020 & 2033
- Table 24: Russia OEM Production of Cosmetics Revenue (billion) Forecast, by Application 2020 & 2033
- Table 25: Benelux OEM Production of Cosmetics Revenue (billion) Forecast, by Application 2020 & 2033
- Table 26: Nordics OEM Production of Cosmetics Revenue (billion) Forecast, by Application 2020 & 2033
- Table 27: Rest of Europe OEM Production of Cosmetics Revenue (billion) Forecast, by Application 2020 & 2033
- Table 28: Global OEM Production of Cosmetics Revenue billion Forecast, by Application 2020 & 2033
- Table 29: Global OEM Production of Cosmetics Revenue billion Forecast, by Types 2020 & 2033
- Table 30: Global OEM Production of Cosmetics Revenue billion Forecast, by Country 2020 & 2033
- Table 31: Turkey OEM Production of Cosmetics Revenue (billion) Forecast, by Application 2020 & 2033
- Table 32: Israel OEM Production of Cosmetics Revenue (billion) Forecast, by Application 2020 & 2033
- Table 33: GCC OEM Production of Cosmetics Revenue (billion) Forecast, by Application 2020 & 2033
- Table 34: North Africa OEM Production of Cosmetics Revenue (billion) Forecast, by Application 2020 & 2033
- Table 35: South Africa OEM Production of Cosmetics Revenue (billion) Forecast, by Application 2020 & 2033
- Table 36: Rest of Middle East & Africa OEM Production of Cosmetics Revenue (billion) Forecast, by Application 2020 & 2033
- Table 37: Global OEM Production of Cosmetics Revenue billion Forecast, by Application 2020 & 2033
- Table 38: Global OEM Production of Cosmetics Revenue billion Forecast, by Types 2020 & 2033
- Table 39: Global OEM Production of Cosmetics Revenue billion Forecast, by Country 2020 & 2033
- Table 40: China OEM Production of Cosmetics Revenue (billion) Forecast, by Application 2020 & 2033
- Table 41: India OEM Production of Cosmetics Revenue (billion) Forecast, by Application 2020 & 2033
- Table 42: Japan OEM Production of Cosmetics Revenue (billion) Forecast, by Application 2020 & 2033
- Table 43: South Korea OEM Production of Cosmetics Revenue (billion) Forecast, by Application 2020 & 2033
- Table 44: ASEAN OEM Production of Cosmetics Revenue (billion) Forecast, by Application 2020 & 2033
- Table 45: Oceania OEM Production of Cosmetics Revenue (billion) Forecast, by Application 2020 & 2033
- Table 46: Rest of Asia Pacific OEM Production of Cosmetics Revenue (billion) Forecast, by Application 2020 & 2033
Frequently Asked Questions
1. What is the projected Compound Annual Growth Rate (CAGR) of the OEM Production of Cosmetics?
The projected CAGR is approximately 7.3%.
2. Which companies are prominent players in the OEM Production of Cosmetics?
Key companies in the market include NIHON KOLMAR, COSMAX, KOLMAR KOREA, Intertek Technology (Suzhou Industrial Park) Co., Ltd., Guangzhou Dongfang Biotechnology Co., Ltd., Guangdong Bawei Biotechnology Co., Ltd., Jiangsu Meiaisi Cosmetics Co., Ltd., Shanghai Zhenchen Cosmetics Co., Ltd., Shanghai Chuangyuan Cosmetics Company, Beijing Dongcai Daily Chemicals Co., Ltd., Guangdong Sanhao Technology Co., Ltd., Shanghai Paris Shidi Daily Chemical Co., Ltd., Liangguan Biochemical Technology Co., Ltd., North Bell Cosmetics Co., Ltd., BioTruly Company, Beihao Group.
3. What are the main segments of the OEM Production of Cosmetics?
The market segments include Application, Types.
4. Can you provide details about the market size?
The market size is estimated to be USD 52.4 billion as of 2022.
5. What are some drivers contributing to market growth?
N/A
6. What are the notable trends driving market growth?
N/A
7. Are there any restraints impacting market growth?
N/A
8. Can you provide examples of recent developments in the market?
N/A
9. What pricing options are available for accessing the report?
Pricing options include single-user, multi-user, and enterprise licenses priced at USD 3950.00, USD 5925.00, and USD 7900.00 respectively.
10. Is the market size provided in terms of value or volume?
The market size is provided in terms of value, measured in billion.
11. Are there any specific market keywords associated with the report?
Yes, the market keyword associated with the report is "OEM Production of Cosmetics," which aids in identifying and referencing the specific market segment covered.
12. How do I determine which pricing option suits my needs best?
The pricing options vary based on user requirements and access needs. Individual users may opt for single-user licenses, while businesses requiring broader access may choose multi-user or enterprise licenses for cost-effective access to the report.
13. Are there any additional resources or data provided in the OEM Production of Cosmetics report?
While the report offers comprehensive insights, it's advisable to review the specific contents or supplementary materials provided to ascertain if additional resources or data are available.
14. How can I stay updated on further developments or reports in the OEM Production of Cosmetics?
To stay informed about further developments, trends, and reports in the OEM Production of Cosmetics, consider subscribing to industry newsletters, following relevant companies and organizations, or regularly checking reputable industry news sources and publications.
Methodology
Step 1 - Identification of Relevant Samples Size from Population Database


Step 2 - Approaches for Defining Global Market Size (Value, Volume* & Price*)

Note*: In applicable scenarios
Step 3 - Data Sources
Primary Research
- Web Analytics
- Survey Reports
- Research Institute
- Latest Research Reports
- Opinion Leaders
Secondary Research
- Annual Reports
- White Paper
- Latest Press Release
- Industry Association
- Paid Database
- Investor Presentations

Step 4 - Data Triangulation
Involves using different sources of information in order to increase the validity of a study
These sources are likely to be stakeholders in a program - participants, other researchers, program staff, other community members, and so on.
Then we put all data in single framework & apply various statistical tools to find out the dynamic on the market.
During the analysis stage, feedback from the stakeholder groups would be compared to determine areas of agreement as well as areas of divergence