

Key Insights
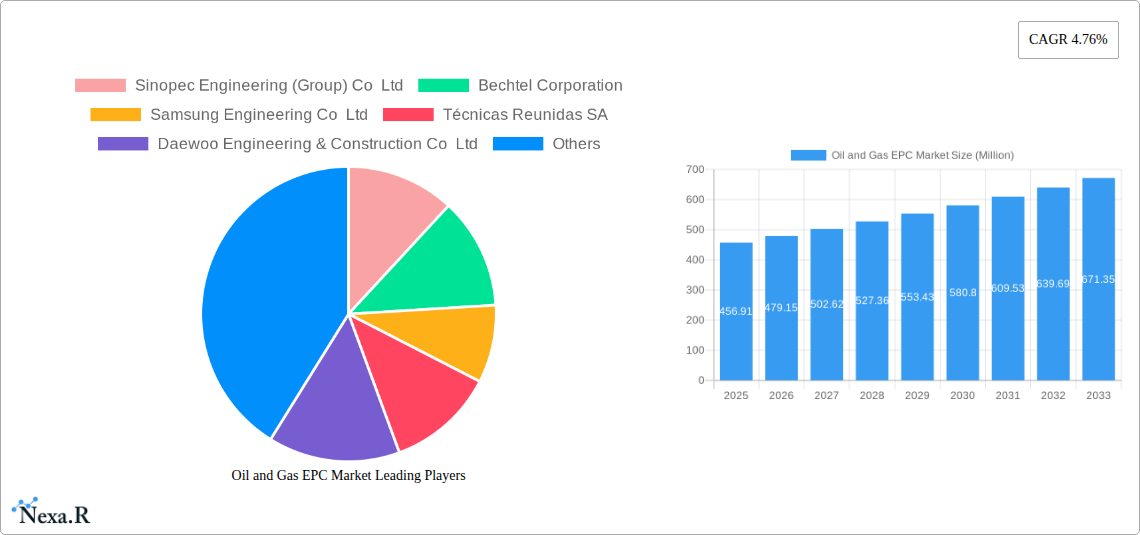
The Oil and Gas Engineering, Procurement, and Construction (EPC) market, valued at $456.91 million in 2025, is projected to experience robust growth, driven primarily by increasing global energy demand and substantial investments in upstream oil and gas exploration and production projects. This growth is further fueled by ongoing developments in renewable energy sources, particularly in offshore wind and related infrastructure. The market's expansion is segmented across upstream, midstream, and downstream sectors, with the upstream sector, encompassing exploration and production activities, anticipated to dominate owing to the persistent need for new oil and gas reserves. Technological advancements in areas like digitalization, automation, and advanced analytics are streamlining EPC processes, enhancing efficiency, and contributing to cost reduction, while stricter environmental regulations are pushing the industry toward more sustainable practices, influencing project designs and construction methodologies. Key players like Sinopec, Bechtel, and Samsung Engineering are strategically investing in technological innovation and geographical diversification to maintain a competitive edge in this dynamic landscape. The Asia-Pacific region, particularly China and India, is expected to witness substantial growth due to rapid industrialization and infrastructure development.
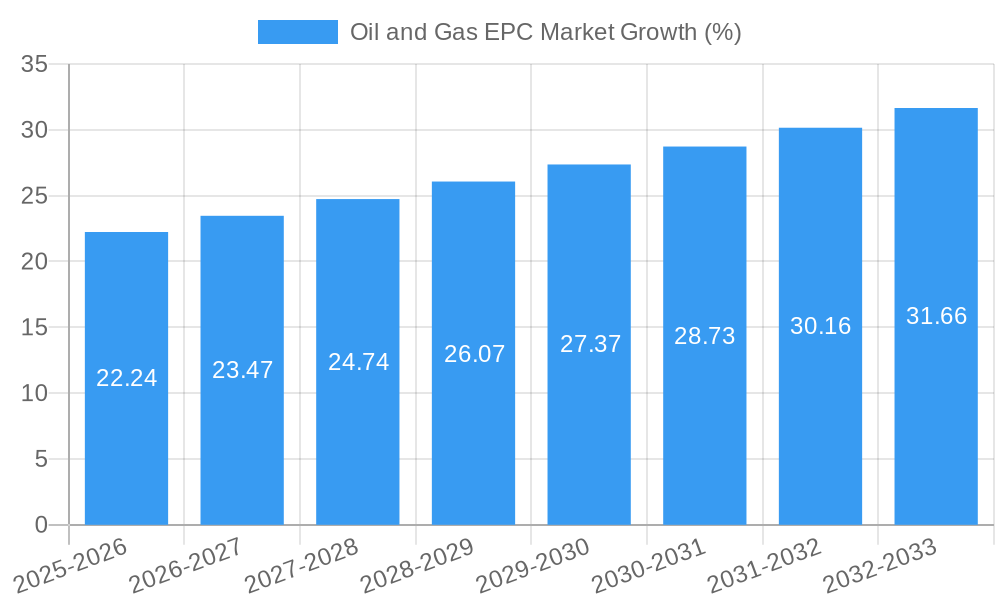
Despite the optimistic outlook, several restraints impact market growth. Fluctuations in oil and gas prices create uncertainty in project investments, and geopolitical instability can disrupt project timelines and budgets. Furthermore, the increasing emphasis on sustainability and emission reduction targets necessitates higher upfront investments in environmentally friendly technologies and necessitates careful consideration of carbon footprint during project planning and execution. The competition amongst EPC companies is intensifying, requiring companies to continuously innovate and optimize their services to secure contracts. The forecast period (2025-2033) anticipates continued expansion, with the CAGR of 4.76% reflecting a balance between growth drivers and existing challenges. The market's future trajectory hinges on the successful management of these factors and the continued adaptation to evolving industry dynamics.
Oil and Gas EPC Market: A Comprehensive Report (2019-2033)
This comprehensive report provides an in-depth analysis of the Oil and Gas EPC market, offering invaluable insights for industry professionals, investors, and strategic decision-makers. We delve into market dynamics, growth trends, regional dominance, key players, and future opportunities, covering the Upstream, Midstream, and Downstream sectors. The report utilizes data from 2019-2024 (historical period), with a base year of 2025 and forecasts extending to 2033. The market size is presented in million units.
Oil and Gas EPC Market Dynamics & Structure
The Oil and Gas EPC market is characterized by moderate concentration, with a few major players holding significant market share. Technological innovation, particularly in digitalization and automation, is a key driver, alongside evolving regulatory frameworks and environmental concerns. The market experiences considerable M&A activity, shaping the competitive landscape. Substitutes, while limited, include alternative energy project development approaches. End-user demographics are heavily influenced by global energy demand and government policies.
- Market Concentration: The top 5 players account for approximately xx% of the global market share in 2025.
- Technological Innovation: Adoption of advanced technologies like digital twins and AI-powered project management tools is increasing, improving efficiency and reducing costs.
- Regulatory Frameworks: Stringent environmental regulations and safety standards are impacting project timelines and costs.
- M&A Activity: The number of M&A deals in the sector averaged xx per year between 2019 and 2024, with a projected increase to xx per year during the forecast period.
- Innovation Barriers: High initial investment costs and integration challenges with existing infrastructure hinder rapid technology adoption.
Oil and Gas EPC Market Growth Trends & Insights
The Oil and Gas EPC market exhibited a CAGR of xx% during the historical period (2019-2024). This growth is primarily driven by increasing global energy demand, particularly in developing economies, and ongoing investments in upstream and downstream projects. Technological advancements are enhancing project efficiency and reducing costs, while fluctuating oil and gas prices present a significant challenge. Market penetration of advanced technologies remains relatively low, with significant potential for future growth. Consumer behavior, influenced by ESG concerns, is driving demand for sustainable EPC solutions. The forecast period (2025-2033) projects a CAGR of xx%, with the market size reaching xx million units by 2033.
Dominant Regions, Countries, or Segments in Oil and Gas EPC Market
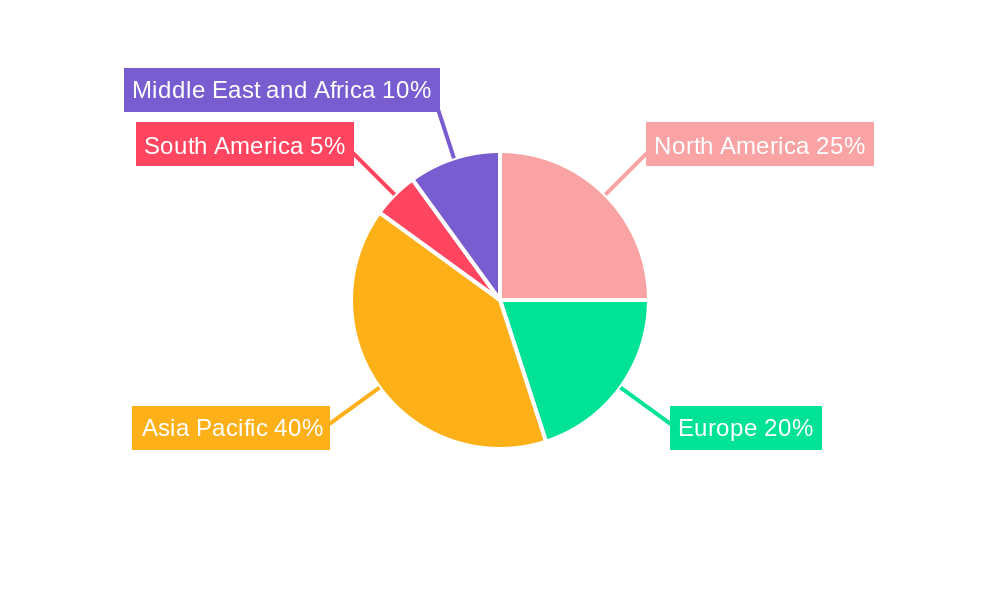
The Middle East is currently the leading region in the Oil and Gas EPC market, driven by substantial investments in LNG projects and ongoing infrastructure development. North America and Asia-Pacific also show significant growth potential. The Upstream sector dominates the market, contributing approximately xx% of the total revenue in 2025, followed by the Downstream sector at xx%.
- Key Drivers in the Middle East: Massive investments in LNG infrastructure (e.g., QatarEnergy's North Field South project), supportive government policies, and abundant hydrocarbon reserves.
- Growth Potential in Asia-Pacific: Rapid economic growth and increasing energy demand in developing countries fuel investments in oil and gas infrastructure projects.
- Upstream Sector Dominance: The majority of EPC contracts are related to exploration, extraction, and processing of oil and gas resources, driving high demand for upstream-focused EPC services.
Oil and Gas EPC Market Product Landscape
The Oil and Gas EPC market offers a diverse range of services, from engineering and design to procurement and construction. Innovation focuses on improving project efficiency, reducing costs, and enhancing safety through digitalization, modularization, and advanced materials. Unique selling propositions center around specialized expertise, integrated project delivery models, and technological advancements that minimize environmental impact.
Key Drivers, Barriers & Challenges in Oil and Gas EPC Market
Key Drivers: Increasing global energy demand, government initiatives to boost domestic oil and gas production, and ongoing investments in renewable energy projects (with associated infrastructure needs). Technological advancements, such as automation and digitalization, are further streamlining processes and increasing efficiency.
Key Challenges: Fluctuations in oil and gas prices, supply chain disruptions, geopolitical instability, and stringent environmental regulations impose significant challenges. The increasing complexity of projects, coupled with skilled labor shortages, further contributes to project delays and cost overruns. Competitive pressures among major EPC contractors are intensifying, driving the need for continuous innovation and cost optimization.
Emerging Opportunities in Oil and Gas EPC Market
Emerging opportunities lie in the growing demand for carbon capture, utilization, and storage (CCUS) technologies, along with increasing investments in renewable energy infrastructure. Untapped markets in developing economies present significant growth potential, alongside the development of more sustainable and efficient EPC solutions. The integration of digital technologies and advanced analytics is revolutionizing project management, presenting opportunities for optimized design and construction processes.
Growth Accelerators in the Oil and Gas EPC Market Industry
Technological advancements, including the deployment of AI and machine learning for project optimization, are playing a crucial role in driving market growth. Strategic partnerships and alliances among EPC contractors and technology providers are enhancing innovation and accelerating the adoption of new technologies. Expanding into emerging markets and focusing on delivering sustainable solutions contribute significantly to long-term growth prospects.
Key Players Shaping the Oil and Gas EPC Market Market
- Sinopec Engineering (Group) Co Ltd
- Bechtel Corporation
- Samsung Engineering Co Ltd
- Técnicas Reunidas SA
- Daewoo Engineering & Construction Co Ltd
- National Petroleum Construction Company
- KBR Inc
- Petrofac Limited
- Hyundai Engineering & Construction Co Ltd
- Saipem SpA
- Korea Shipbuilding & Offshore Engineering Co Ltd
- Fluor Corporation
- John Wood Group PLC
- TechnipFMC PLC
- McDermott International Ltd
Notable Milestones in Oil and Gas EPC Market Sector
- May 2023: QatarEnergy awards the EPC contract for the North Field South (NFS) project, a significant development boosting LNG production capacity.
- July 2022: Saipem SpA secures multiple onshore and offshore contracts in the Middle East, valued at approximately USD 1.25 billion, demonstrating substantial investment in the region.
In-Depth Oil and Gas EPC Market Market Outlook
The Oil and Gas EPC market is poised for sustained growth driven by persistent global energy demand, particularly in emerging economies. Strategic investments in technological advancements, coupled with a focus on sustainable solutions and expansion into new markets, offer significant opportunities for long-term growth and profitability. Companies that effectively adapt to evolving regulatory landscapes and embrace digitalization are best positioned to succeed in this dynamic market.
Oil and Gas EPC Market Segmentation
-
1. Sector
- 1.1. Upstream
- 1.2. Downstream
- 1.3. Midstream
Oil and Gas EPC Market Segmentation By Geography
-
1. North America
- 1.1. United States
- 1.2. Canada
- 1.3. Rest of North America
-
2. Europe
- 2.1. Germany
- 2.2. France
- 2.3. United Kingdom
- 2.4. Rest of Europe
-
3. Asia Pacific
- 3.1. China
- 3.2. India
- 3.3. Japan
- 3.4. South Korea
- 3.5. Rest of Asia Pacific
-
4. South America
- 4.1. Brazil
- 4.2. Argentina
- 4.3. Rest of South America
-
5. Middle East and Africa
- 5.1. Saudi Arabia
- 5.2. United Arab Emirates
- 5.3. South Africa
- 5.4. Rest of Middle East and Africa
Oil and Gas EPC Market REPORT HIGHLIGHTS
| Aspects | Details |
|---|---|
| Study Period | 2019-2033 |
| Base Year | 2024 |
| Estimated Year | 2025 |
| Forecast Period | 2025-2033 |
| Historical Period | 2019-2024 |
| Growth Rate | CAGR of 4.76% from 2019-2033 |
| Segmentation |
|
Table of Contents
- 1. Introduction
- 1.1. Research Scope
- 1.2. Market Segmentation
- 1.3. Research Methodology
- 1.4. Definitions and Assumptions
- 2. Executive Summary
- 2.1. Introduction
- 3. Market Dynamics
- 3.1. Introduction
- 3.2. Market Drivers
- 3.2.1. 4.; Growing Demand to Develop the Natural Gas Infrastructure4.; Increase in Offshore Oil and Gas Exploration and Production (E&P) Activities
- 3.3. Market Restrains
- 3.3.1. 4.; High Volatility of Oil and Gas Prices
- 3.4. Market Trends
- 3.4.1. Upstream Segment Expected to Dominate the Market
- 4. Market Factor Analysis
- 4.1. Porters Five Forces
- 4.2. Supply/Value Chain
- 4.3. PESTEL analysis
- 4.4. Market Entropy
- 4.5. Patent/Trademark Analysis
- 5. Global Oil and Gas EPC Market Analysis, Insights and Forecast, 2019-2031
- 5.1. Market Analysis, Insights and Forecast - by Sector
- 5.1.1. Upstream
- 5.1.2. Downstream
- 5.1.3. Midstream
- 5.2. Market Analysis, Insights and Forecast - by Region
- 5.2.1. North America
- 5.2.2. Europe
- 5.2.3. Asia Pacific
- 5.2.4. South America
- 5.2.5. Middle East and Africa
- 5.1. Market Analysis, Insights and Forecast - by Sector
- 6. North America Oil and Gas EPC Market Analysis, Insights and Forecast, 2019-2031
- 6.1. Market Analysis, Insights and Forecast - by Sector
- 6.1.1. Upstream
- 6.1.2. Downstream
- 6.1.3. Midstream
- 6.1. Market Analysis, Insights and Forecast - by Sector
- 7. Europe Oil and Gas EPC Market Analysis, Insights and Forecast, 2019-2031
- 7.1. Market Analysis, Insights and Forecast - by Sector
- 7.1.1. Upstream
- 7.1.2. Downstream
- 7.1.3. Midstream
- 7.1. Market Analysis, Insights and Forecast - by Sector
- 8. Asia Pacific Oil and Gas EPC Market Analysis, Insights and Forecast, 2019-2031
- 8.1. Market Analysis, Insights and Forecast - by Sector
- 8.1.1. Upstream
- 8.1.2. Downstream
- 8.1.3. Midstream
- 8.1. Market Analysis, Insights and Forecast - by Sector
- 9. South America Oil and Gas EPC Market Analysis, Insights and Forecast, 2019-2031
- 9.1. Market Analysis, Insights and Forecast - by Sector
- 9.1.1. Upstream
- 9.1.2. Downstream
- 9.1.3. Midstream
- 9.1. Market Analysis, Insights and Forecast - by Sector
- 10. Middle East and Africa Oil and Gas EPC Market Analysis, Insights and Forecast, 2019-2031
- 10.1. Market Analysis, Insights and Forecast - by Sector
- 10.1.1. Upstream
- 10.1.2. Downstream
- 10.1.3. Midstream
- 10.1. Market Analysis, Insights and Forecast - by Sector
- 11. North America Oil and Gas EPC Market Analysis, Insights and Forecast, 2019-2031
- 11.1. Market Analysis, Insights and Forecast - By Country/Sub-region
- 11.1.1 United States
- 11.1.2 Canada
- 11.1.3 Rest of North America
- 12. Europe Oil and Gas EPC Market Analysis, Insights and Forecast, 2019-2031
- 12.1. Market Analysis, Insights and Forecast - By Country/Sub-region
- 12.1.1 Germany
- 12.1.2 France
- 12.1.3 United Kingdom
- 12.1.4 Rest of Europe
- 13. Asia Pacific Oil and Gas EPC Market Analysis, Insights and Forecast, 2019-2031
- 13.1. Market Analysis, Insights and Forecast - By Country/Sub-region
- 13.1.1 China
- 13.1.2 India
- 13.1.3 Japan
- 13.1.4 South Korea
- 13.1.5 Rest of Asia Pacific
- 14. South America Oil and Gas EPC Market Analysis, Insights and Forecast, 2019-2031
- 14.1. Market Analysis, Insights and Forecast - By Country/Sub-region
- 14.1.1 Brazil
- 14.1.2 Argentina
- 14.1.3 Rest of South America
- 15. Middle East and Africa Oil and Gas EPC Market Analysis, Insights and Forecast, 2019-2031
- 15.1. Market Analysis, Insights and Forecast - By Country/Sub-region
- 15.1.1 Saudi Arabia
- 15.1.2 United Arab Emirates
- 15.1.3 South Africa
- 15.1.4 Rest of Middle East and Africa
- 16. Competitive Analysis
- 16.1. Global Market Share Analysis 2024
- 16.2. Company Profiles
- 16.2.1 Sinopec Engineering (Group) Co Ltd
- 16.2.1.1. Overview
- 16.2.1.2. Products
- 16.2.1.3. SWOT Analysis
- 16.2.1.4. Recent Developments
- 16.2.1.5. Financials (Based on Availability)
- 16.2.2 Bechtel Corporation
- 16.2.2.1. Overview
- 16.2.2.2. Products
- 16.2.2.3. SWOT Analysis
- 16.2.2.4. Recent Developments
- 16.2.2.5. Financials (Based on Availability)
- 16.2.3 Samsung Engineering Co Ltd
- 16.2.3.1. Overview
- 16.2.3.2. Products
- 16.2.3.3. SWOT Analysis
- 16.2.3.4. Recent Developments
- 16.2.3.5. Financials (Based on Availability)
- 16.2.4 Técnicas Reunidas SA
- 16.2.4.1. Overview
- 16.2.4.2. Products
- 16.2.4.3. SWOT Analysis
- 16.2.4.4. Recent Developments
- 16.2.4.5. Financials (Based on Availability)
- 16.2.5 Daewoo Engineering & Construction Co Ltd
- 16.2.5.1. Overview
- 16.2.5.2. Products
- 16.2.5.3. SWOT Analysis
- 16.2.5.4. Recent Developments
- 16.2.5.5. Financials (Based on Availability)
- 16.2.6 National Petroleum Construction Company
- 16.2.6.1. Overview
- 16.2.6.2. Products
- 16.2.6.3. SWOT Analysis
- 16.2.6.4. Recent Developments
- 16.2.6.5. Financials (Based on Availability)
- 16.2.7 KBR Inc
- 16.2.7.1. Overview
- 16.2.7.2. Products
- 16.2.7.3. SWOT Analysis
- 16.2.7.4. Recent Developments
- 16.2.7.5. Financials (Based on Availability)
- 16.2.8 Petrofac Limited
- 16.2.8.1. Overview
- 16.2.8.2. Products
- 16.2.8.3. SWOT Analysis
- 16.2.8.4. Recent Developments
- 16.2.8.5. Financials (Based on Availability)
- 16.2.9 Hyundai Engineering & Construction Co Ltd
- 16.2.9.1. Overview
- 16.2.9.2. Products
- 16.2.9.3. SWOT Analysis
- 16.2.9.4. Recent Developments
- 16.2.9.5. Financials (Based on Availability)
- 16.2.10 Saipem SpA
- 16.2.10.1. Overview
- 16.2.10.2. Products
- 16.2.10.3. SWOT Analysis
- 16.2.10.4. Recent Developments
- 16.2.10.5. Financials (Based on Availability)
- 16.2.11 Korea Shipbuilding & Offshore Engineering Co Ltd
- 16.2.11.1. Overview
- 16.2.11.2. Products
- 16.2.11.3. SWOT Analysis
- 16.2.11.4. Recent Developments
- 16.2.11.5. Financials (Based on Availability)
- 16.2.12 Fluor Corporation
- 16.2.12.1. Overview
- 16.2.12.2. Products
- 16.2.12.3. SWOT Analysis
- 16.2.12.4. Recent Developments
- 16.2.12.5. Financials (Based on Availability)
- 16.2.13 John Wood Group PLC
- 16.2.13.1. Overview
- 16.2.13.2. Products
- 16.2.13.3. SWOT Analysis
- 16.2.13.4. Recent Developments
- 16.2.13.5. Financials (Based on Availability)
- 16.2.14 TechnipFMC PLC
- 16.2.14.1. Overview
- 16.2.14.2. Products
- 16.2.14.3. SWOT Analysis
- 16.2.14.4. Recent Developments
- 16.2.14.5. Financials (Based on Availability)
- 16.2.15 McDermott International Ltd
- 16.2.15.1. Overview
- 16.2.15.2. Products
- 16.2.15.3. SWOT Analysis
- 16.2.15.4. Recent Developments
- 16.2.15.5. Financials (Based on Availability)
- 16.2.1 Sinopec Engineering (Group) Co Ltd
List of Figures
- Figure 1: Global Oil and Gas EPC Market Revenue Breakdown (Million, %) by Region 2024 & 2032
- Figure 2: North America Oil and Gas EPC Market Revenue (Million), by Country 2024 & 2032
- Figure 3: North America Oil and Gas EPC Market Revenue Share (%), by Country 2024 & 2032
- Figure 4: Europe Oil and Gas EPC Market Revenue (Million), by Country 2024 & 2032
- Figure 5: Europe Oil and Gas EPC Market Revenue Share (%), by Country 2024 & 2032
- Figure 6: Asia Pacific Oil and Gas EPC Market Revenue (Million), by Country 2024 & 2032
- Figure 7: Asia Pacific Oil and Gas EPC Market Revenue Share (%), by Country 2024 & 2032
- Figure 8: South America Oil and Gas EPC Market Revenue (Million), by Country 2024 & 2032
- Figure 9: South America Oil and Gas EPC Market Revenue Share (%), by Country 2024 & 2032
- Figure 10: Middle East and Africa Oil and Gas EPC Market Revenue (Million), by Country 2024 & 2032
- Figure 11: Middle East and Africa Oil and Gas EPC Market Revenue Share (%), by Country 2024 & 2032
- Figure 12: North America Oil and Gas EPC Market Revenue (Million), by Sector 2024 & 2032
- Figure 13: North America Oil and Gas EPC Market Revenue Share (%), by Sector 2024 & 2032
- Figure 14: North America Oil and Gas EPC Market Revenue (Million), by Country 2024 & 2032
- Figure 15: North America Oil and Gas EPC Market Revenue Share (%), by Country 2024 & 2032
- Figure 16: Europe Oil and Gas EPC Market Revenue (Million), by Sector 2024 & 2032
- Figure 17: Europe Oil and Gas EPC Market Revenue Share (%), by Sector 2024 & 2032
- Figure 18: Europe Oil and Gas EPC Market Revenue (Million), by Country 2024 & 2032
- Figure 19: Europe Oil and Gas EPC Market Revenue Share (%), by Country 2024 & 2032
- Figure 20: Asia Pacific Oil and Gas EPC Market Revenue (Million), by Sector 2024 & 2032
- Figure 21: Asia Pacific Oil and Gas EPC Market Revenue Share (%), by Sector 2024 & 2032
- Figure 22: Asia Pacific Oil and Gas EPC Market Revenue (Million), by Country 2024 & 2032
- Figure 23: Asia Pacific Oil and Gas EPC Market Revenue Share (%), by Country 2024 & 2032
- Figure 24: South America Oil and Gas EPC Market Revenue (Million), by Sector 2024 & 2032
- Figure 25: South America Oil and Gas EPC Market Revenue Share (%), by Sector 2024 & 2032
- Figure 26: South America Oil and Gas EPC Market Revenue (Million), by Country 2024 & 2032
- Figure 27: South America Oil and Gas EPC Market Revenue Share (%), by Country 2024 & 2032
- Figure 28: Middle East and Africa Oil and Gas EPC Market Revenue (Million), by Sector 2024 & 2032
- Figure 29: Middle East and Africa Oil and Gas EPC Market Revenue Share (%), by Sector 2024 & 2032
- Figure 30: Middle East and Africa Oil and Gas EPC Market Revenue (Million), by Country 2024 & 2032
- Figure 31: Middle East and Africa Oil and Gas EPC Market Revenue Share (%), by Country 2024 & 2032
List of Tables
- Table 1: Global Oil and Gas EPC Market Revenue Million Forecast, by Region 2019 & 2032
- Table 2: Global Oil and Gas EPC Market Revenue Million Forecast, by Sector 2019 & 2032
- Table 3: Global Oil and Gas EPC Market Revenue Million Forecast, by Region 2019 & 2032
- Table 4: Global Oil and Gas EPC Market Revenue Million Forecast, by Country 2019 & 2032
- Table 5: United States Oil and Gas EPC Market Revenue (Million) Forecast, by Application 2019 & 2032
- Table 6: Canada Oil and Gas EPC Market Revenue (Million) Forecast, by Application 2019 & 2032
- Table 7: Rest of North America Oil and Gas EPC Market Revenue (Million) Forecast, by Application 2019 & 2032
- Table 8: Global Oil and Gas EPC Market Revenue Million Forecast, by Country 2019 & 2032
- Table 9: Germany Oil and Gas EPC Market Revenue (Million) Forecast, by Application 2019 & 2032
- Table 10: France Oil and Gas EPC Market Revenue (Million) Forecast, by Application 2019 & 2032
- Table 11: United Kingdom Oil and Gas EPC Market Revenue (Million) Forecast, by Application 2019 & 2032
- Table 12: Rest of Europe Oil and Gas EPC Market Revenue (Million) Forecast, by Application 2019 & 2032
- Table 13: Global Oil and Gas EPC Market Revenue Million Forecast, by Country 2019 & 2032
- Table 14: China Oil and Gas EPC Market Revenue (Million) Forecast, by Application 2019 & 2032
- Table 15: India Oil and Gas EPC Market Revenue (Million) Forecast, by Application 2019 & 2032
- Table 16: Japan Oil and Gas EPC Market Revenue (Million) Forecast, by Application 2019 & 2032
- Table 17: South Korea Oil and Gas EPC Market Revenue (Million) Forecast, by Application 2019 & 2032
- Table 18: Rest of Asia Pacific Oil and Gas EPC Market Revenue (Million) Forecast, by Application 2019 & 2032
- Table 19: Global Oil and Gas EPC Market Revenue Million Forecast, by Country 2019 & 2032
- Table 20: Brazil Oil and Gas EPC Market Revenue (Million) Forecast, by Application 2019 & 2032
- Table 21: Argentina Oil and Gas EPC Market Revenue (Million) Forecast, by Application 2019 & 2032
- Table 22: Rest of South America Oil and Gas EPC Market Revenue (Million) Forecast, by Application 2019 & 2032
- Table 23: Global Oil and Gas EPC Market Revenue Million Forecast, by Country 2019 & 2032
- Table 24: Saudi Arabia Oil and Gas EPC Market Revenue (Million) Forecast, by Application 2019 & 2032
- Table 25: United Arab Emirates Oil and Gas EPC Market Revenue (Million) Forecast, by Application 2019 & 2032
- Table 26: South Africa Oil and Gas EPC Market Revenue (Million) Forecast, by Application 2019 & 2032
- Table 27: Rest of Middle East and Africa Oil and Gas EPC Market Revenue (Million) Forecast, by Application 2019 & 2032
- Table 28: Global Oil and Gas EPC Market Revenue Million Forecast, by Sector 2019 & 2032
- Table 29: Global Oil and Gas EPC Market Revenue Million Forecast, by Country 2019 & 2032
- Table 30: United States Oil and Gas EPC Market Revenue (Million) Forecast, by Application 2019 & 2032
- Table 31: Canada Oil and Gas EPC Market Revenue (Million) Forecast, by Application 2019 & 2032
- Table 32: Rest of North America Oil and Gas EPC Market Revenue (Million) Forecast, by Application 2019 & 2032
- Table 33: Global Oil and Gas EPC Market Revenue Million Forecast, by Sector 2019 & 2032
- Table 34: Global Oil and Gas EPC Market Revenue Million Forecast, by Country 2019 & 2032
- Table 35: Germany Oil and Gas EPC Market Revenue (Million) Forecast, by Application 2019 & 2032
- Table 36: France Oil and Gas EPC Market Revenue (Million) Forecast, by Application 2019 & 2032
- Table 37: United Kingdom Oil and Gas EPC Market Revenue (Million) Forecast, by Application 2019 & 2032
- Table 38: Rest of Europe Oil and Gas EPC Market Revenue (Million) Forecast, by Application 2019 & 2032
- Table 39: Global Oil and Gas EPC Market Revenue Million Forecast, by Sector 2019 & 2032
- Table 40: Global Oil and Gas EPC Market Revenue Million Forecast, by Country 2019 & 2032
- Table 41: China Oil and Gas EPC Market Revenue (Million) Forecast, by Application 2019 & 2032
- Table 42: India Oil and Gas EPC Market Revenue (Million) Forecast, by Application 2019 & 2032
- Table 43: Japan Oil and Gas EPC Market Revenue (Million) Forecast, by Application 2019 & 2032
- Table 44: South Korea Oil and Gas EPC Market Revenue (Million) Forecast, by Application 2019 & 2032
- Table 45: Rest of Asia Pacific Oil and Gas EPC Market Revenue (Million) Forecast, by Application 2019 & 2032
- Table 46: Global Oil and Gas EPC Market Revenue Million Forecast, by Sector 2019 & 2032
- Table 47: Global Oil and Gas EPC Market Revenue Million Forecast, by Country 2019 & 2032
- Table 48: Brazil Oil and Gas EPC Market Revenue (Million) Forecast, by Application 2019 & 2032
- Table 49: Argentina Oil and Gas EPC Market Revenue (Million) Forecast, by Application 2019 & 2032
- Table 50: Rest of South America Oil and Gas EPC Market Revenue (Million) Forecast, by Application 2019 & 2032
- Table 51: Global Oil and Gas EPC Market Revenue Million Forecast, by Sector 2019 & 2032
- Table 52: Global Oil and Gas EPC Market Revenue Million Forecast, by Country 2019 & 2032
- Table 53: Saudi Arabia Oil and Gas EPC Market Revenue (Million) Forecast, by Application 2019 & 2032
- Table 54: United Arab Emirates Oil and Gas EPC Market Revenue (Million) Forecast, by Application 2019 & 2032
- Table 55: South Africa Oil and Gas EPC Market Revenue (Million) Forecast, by Application 2019 & 2032
- Table 56: Rest of Middle East and Africa Oil and Gas EPC Market Revenue (Million) Forecast, by Application 2019 & 2032
Frequently Asked Questions
1. What is the projected Compound Annual Growth Rate (CAGR) of the Oil and Gas EPC Market?
The projected CAGR is approximately 4.76%.
2. Which companies are prominent players in the Oil and Gas EPC Market?
Key companies in the market include Sinopec Engineering (Group) Co Ltd, Bechtel Corporation, Samsung Engineering Co Ltd, Técnicas Reunidas SA, Daewoo Engineering & Construction Co Ltd, National Petroleum Construction Company, KBR Inc, Petrofac Limited, Hyundai Engineering & Construction Co Ltd, Saipem SpA, Korea Shipbuilding & Offshore Engineering Co Ltd, Fluor Corporation, John Wood Group PLC, TechnipFMC PLC, McDermott International Ltd.
3. What are the main segments of the Oil and Gas EPC Market?
The market segments include Sector.
4. Can you provide details about the market size?
The market size is estimated to be USD 456.91 Million as of 2022.
5. What are some drivers contributing to market growth?
4.; Growing Demand to Develop the Natural Gas Infrastructure4.; Increase in Offshore Oil and Gas Exploration and Production (E&P) Activities.
6. What are the notable trends driving market growth?
Upstream Segment Expected to Dominate the Market.
7. Are there any restraints impacting market growth?
4.; High Volatility of Oil and Gas Prices.
8. Can you provide examples of recent developments in the market?
May 2023, QatarEnergy announced the award of the engineering, procurement, and construction (EPC) contract for the North Field South (NFS) project, which comprises two LNG mega trains with a combined capacity of 16 million tons per annum (MTPA). NFS, jointly with the North Field East (NFE) project, will expand Qatar’s LNG production capacity from the current 77 MTPA to 126 MTPA. QatarEnergy maintains a 75% interest in the NFS project and has already signed partnership agreements with TotalEnergies, Shell, and ConocoPhillips for the remaining 25%.
9. What pricing options are available for accessing the report?
Pricing options include single-user, multi-user, and enterprise licenses priced at USD 4750, USD 5250, and USD 8750 respectively.
10. Is the market size provided in terms of value or volume?
The market size is provided in terms of value, measured in Million.
11. Are there any specific market keywords associated with the report?
Yes, the market keyword associated with the report is "Oil and Gas EPC Market," which aids in identifying and referencing the specific market segment covered.
12. How do I determine which pricing option suits my needs best?
The pricing options vary based on user requirements and access needs. Individual users may opt for single-user licenses, while businesses requiring broader access may choose multi-user or enterprise licenses for cost-effective access to the report.
13. Are there any additional resources or data provided in the Oil and Gas EPC Market report?
While the report offers comprehensive insights, it's advisable to review the specific contents or supplementary materials provided to ascertain if additional resources or data are available.
14. How can I stay updated on further developments or reports in the Oil and Gas EPC Market?
To stay informed about further developments, trends, and reports in the Oil and Gas EPC Market, consider subscribing to industry newsletters, following relevant companies and organizations, or regularly checking reputable industry news sources and publications.
Methodology
Step 1 - Identification of Relevant Samples Size from Population Database


Step 2 - Approaches for Defining Global Market Size (Value, Volume* & Price*)

Note*: In applicable scenarios
Step 3 - Data Sources
Primary Research
- Web Analytics
- Survey Reports
- Research Institute
- Latest Research Reports
- Opinion Leaders
Secondary Research
- Annual Reports
- White Paper
- Latest Press Release
- Industry Association
- Paid Database
- Investor Presentations

Step 4 - Data Triangulation
Involves using different sources of information in order to increase the validity of a study
These sources are likely to be stakeholders in a program - participants, other researchers, program staff, other community members, and so on.
Then we put all data in single framework & apply various statistical tools to find out the dynamic on the market.
During the analysis stage, feedback from the stakeholder groups would be compared to determine areas of agreement as well as areas of divergence
