

Key Insights
The Trinidad and Tobago oil and gas industry, while historically significant, is currently navigating a period of transition. The country's reserves, while substantial, are showing signs of depletion, necessitating a strategic shift towards diversification and enhanced operational efficiency. Production levels, while fluctuating, have shown a moderate decline in recent years, impacted by both natural resource limitations and global energy price volatility. However, the sector continues to be a cornerstone of the national economy, contributing significantly to government revenue and employment. Government initiatives aimed at attracting foreign investment and promoting exploration in deeper waters and utilizing advanced technologies like enhanced oil recovery techniques are underway, but their full impact is yet to be fully realized. This signifies a need for robust regulatory frameworks to support sustainable practices, alongside exploration for new resources, to ensure the sector's long-term viability.
The future outlook for the Trinidad and Tobago oil and gas industry hinges on several factors. These include the global demand for energy, the success of exploration efforts, the implementation of effective policies to attract investment, and the adoption of sustainable practices. While challenges exist, opportunities remain, particularly in the development of downstream industries such as petrochemicals and liquefied natural gas (LNG). The focus on improving infrastructure and bolstering the skills base through workforce training initiatives will play a critical role in shaping the sector's resilience and growth potential. Successfully balancing economic growth with environmental sustainability is crucial, necessitating a cautious approach that prioritizes responsible resource management and reduced carbon emissions. A robust regulatory environment that encourages innovation while protecting the environment will be essential in navigating the transition towards a more diversified and sustainable energy future.
Oil and Gas Industry in Trinidad and Tobago: 2019-2033 Market Report
This comprehensive report provides an in-depth analysis of the Oil and Gas industry in Trinidad and Tobago, offering invaluable insights for industry professionals, investors, and strategic planners. Covering the period 2019-2033, with a focus on 2025, this report meticulously examines market dynamics, growth trends, dominant segments, and future opportunities within this crucial sector. The report leverages extensive data analysis and expert insights to deliver a clear and actionable understanding of this dynamic market. Keywords: Trinidad and Tobago Oil and Gas, Onshore Oil and Gas, Offshore Oil and Gas, Energy Market Trinidad, Trinidad and Tobago Energy Sector, Oil and Gas Market Analysis, National Gas Company of Trinidad and Tobago, Shell Trinidad and Tobago, BP Trinidad and Tobago.
Oil and Gas Industry in Trinidad and Tobago Market Dynamics & Structure
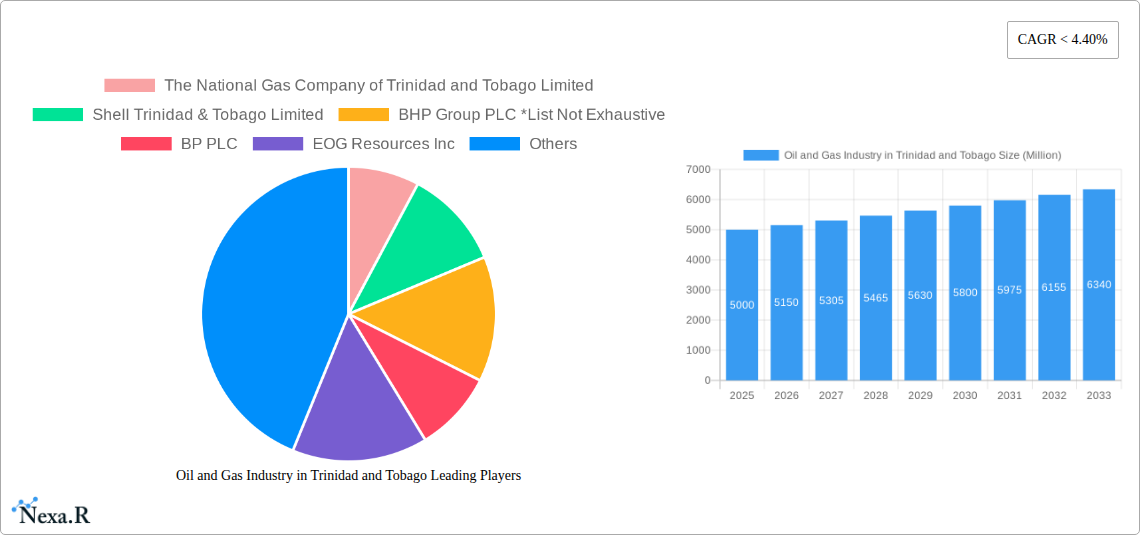
The Trinidad and Tobago oil and gas market is characterized by a moderate level of market concentration, with a few major players holding significant shares. The National Gas Company of Trinidad and Tobago Limited plays a dominant role, alongside international players such as Shell Trinidad & Tobago Limited, BP PLC, and BHP Group PLC. However, the presence of numerous smaller operators contributes to a competitive landscape. Technological innovation is a key driver, with companies investing in enhanced oil recovery techniques and exploring renewable energy integration. The regulatory framework, while generally supportive of the industry, faces ongoing adjustments to balance environmental concerns with economic growth. The market experiences competitive pressure from substitute energy sources and global price fluctuations. M&A activity has been relatively moderate in recent years, with a focus on strategic asset acquisitions rather than large-scale mergers. The end-user demographic is primarily industrial, with significant demand from petrochemical and power generation sectors.
- Market Concentration: Moderate, with a few major players holding a significant share (estimated xx%).
- Technological Innovation: Focus on EOR techniques and renewable energy integration.
- Regulatory Framework: Supportive, with ongoing adjustments for environmental considerations.
- Competitive Substitutes: Renewable energy sources pose a growing threat.
- M&A Activity: Moderate, primarily focused on strategic asset acquisitions; deal volume estimated at xx Million USD in 2024.
- End-User Demographics: Primarily industrial (power generation and petrochemicals).
Oil and Gas Industry in Trinidad and Tobago Growth Trends & Insights
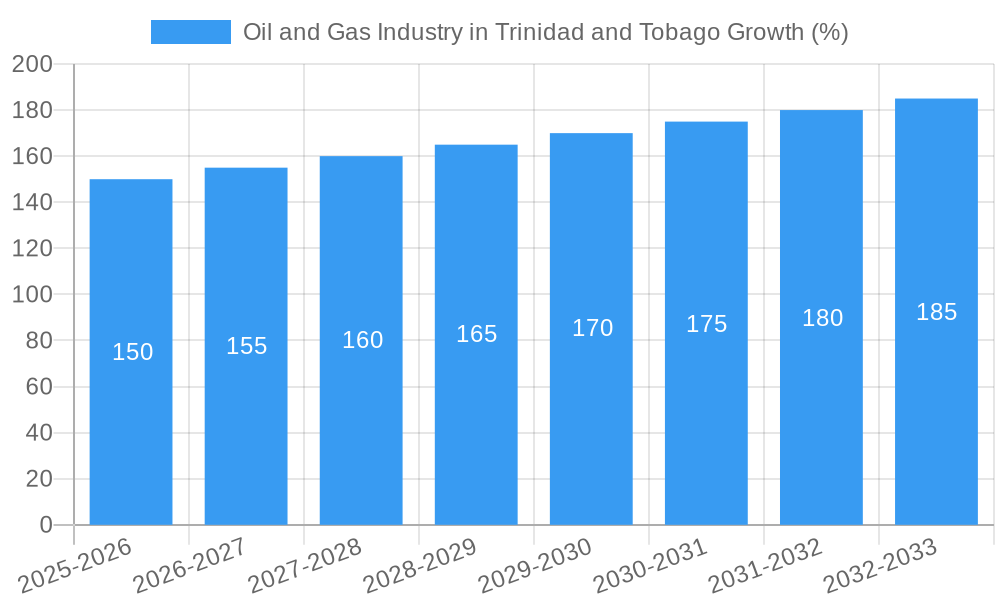
The Trinidad and Tobago oil and gas market experienced fluctuating growth during the historical period (2019-2024), influenced by global price volatility and domestic policy shifts. The base year (2025) reflects a stabilization with gradual growth projected for the forecast period (2025-2033). While production levels may plateau in some areas, investments in advanced technologies like enhanced oil recovery and exploration in new areas promise continued output. The adoption of advanced technologies and digitization is gradually increasing, driven by efficiency and safety concerns. Consumer behavior, predominantly among industrial users, remains largely driven by price and reliability of supply. The overall market size is expected to show a Compound Annual Growth Rate (CAGR) of xx% during the forecast period. Market penetration for newer technologies is expected to reach xx% by 2033.
Dominant Regions, Countries, or Segments in Oil and Gas Industry in Trinidad and Tobago
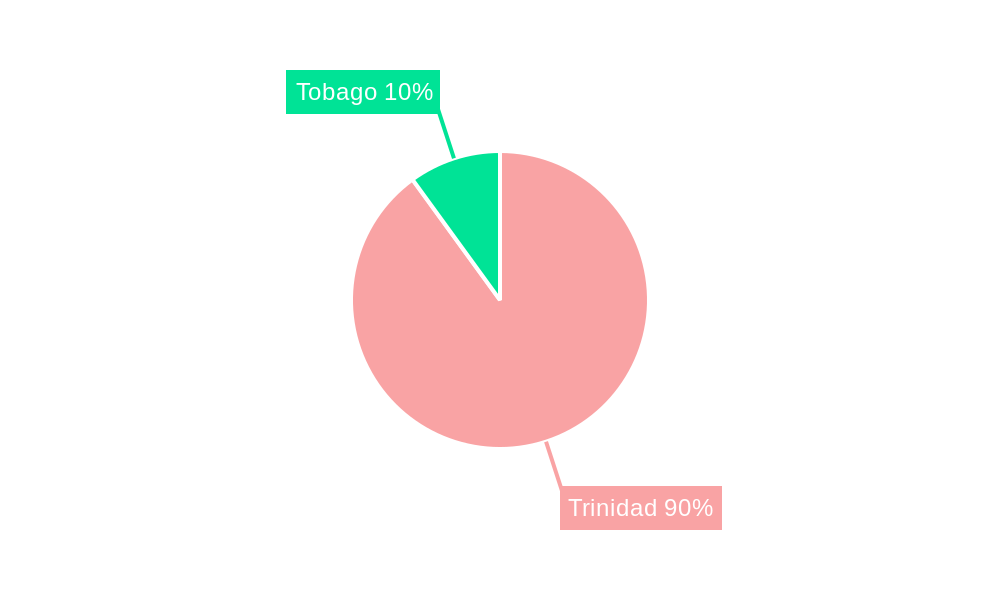
Both onshore and offshore segments contribute significantly to Trinidad and Tobago's oil and gas production. However, the offshore segment dominates in terms of volume due to larger reserves and exploration opportunities. The southern and eastern regions of the country are hotspots for activity. The dominance of the offshore segment is largely driven by substantial reserves discovered over the years and continuous investment in advanced offshore exploration and production technologies. Government policies promoting exploration and investment in infrastructure further contribute to this dominance.
- Offshore Segment Dominance: Driven by substantial reserves and advanced technology.
- Key Drivers: Significant hydrocarbon reserves, substantial investment in offshore infrastructure, and supportive government policies.
- Growth Potential: Continued investment in deep-water exploration and production holds significant potential.
- Market Share: Offshore segment holds approximately xx% of the market share.
Oil and Gas Industry in Trinidad and Tobago Product Landscape
The product landscape encompasses a range of crude oils, natural gas, and associated petrochemical products. Recent innovations focus on enhanced oil recovery techniques to maximize extraction from mature fields and the development of cleaner energy sources in line with environmental concerns. Companies are increasingly adopting advanced analytics and data-driven approaches to optimize production and reduce operational costs. A key selling proposition is the reliability and consistent supply of high-quality hydrocarbons.
Key Drivers, Barriers & Challenges in Oil and Gas Industry in Trinidad and Tobago
Key Drivers: Abundant hydrocarbon reserves, supportive government policies (although subject to change based on evolving environmental concerns), and strategic partnerships with international energy companies drive the market's growth. Technological advancements in exploration and production enhance efficiency and output.
Key Challenges: Fluctuations in global oil and gas prices pose a major challenge, along with environmental regulations and the need to transition towards cleaner energy sources. Aging infrastructure requires upgrades, leading to increased capital expenditures. Maintaining a skilled workforce and addressing supply chain vulnerabilities are ongoing challenges. Competition from alternative energy sources is a growing concern. The impact of these challenges can be quantified by examining fluctuations in investment and production levels; for example, a xx% decline in investment was observed in 2022 due to price volatility.
Emerging Opportunities in Oil and Gas Industry in Trinidad and Tobago
Emerging opportunities include expanding into renewable energy sources (solar, wind) to diversify the energy portfolio, exploring deeper offshore reserves, and leveraging advanced technologies like artificial intelligence and machine learning to enhance operational efficiency and optimize production. The development of a robust petrochemical industry holds significant potential, as does attracting further foreign direct investment for exploration and infrastructure development.
Growth Accelerators in the Oil and Gas Industry in Trinidad and Tobago Industry
Long-term growth will be driven by sustained investment in technological innovation, including the exploration of deepwater reserves, carbon capture and storage solutions, and integration with renewable energy. Strategic partnerships with international players will bring in much-needed expertise and capital. Government initiatives focused on infrastructure development and skills development will play a crucial role.
Key Players Shaping the Oil and Gas Industry in Trinidad and Tobago Market
- The National Gas Company of Trinidad and Tobago Limited
- Shell Trinidad & Tobago Limited
- BHP Group PLC
- BP PLC
- EOG Resources Inc
Notable Milestones in Oil and Gas Industry in Trinidad and Tobago Sector
- 2020: Implementation of new environmental regulations impacting operational practices.
- 2021: Announcement of a major deepwater exploration project.
- 2022: Partnership formed between NGC and a foreign energy company to develop renewable energy.
- 2023: Successful completion of an EOR project, increasing output by xx%.
- 2024: Launch of a new petrochemical plant.
In-Depth Oil and Gas Industry in Trinidad and Tobago Market Outlook
The future of the Trinidad and Tobago oil and gas industry hinges on adapting to global energy transition trends while leveraging existing resources effectively. The focus should be on strategic diversification into cleaner energy, technological innovation to enhance production efficiency and sustainability, and strategic partnerships to attract investment and expertise. The market presents a blend of challenges and opportunities, offering significant potential for growth in both traditional and renewable energy sectors. The country's strategic location and existing infrastructure offer a solid foundation for continued success in the years to come, albeit with a necessary emphasis on adapting to a changing global landscape.
Oil and Gas Industry in Trinidad and Tobago Segmentation
-
1. Location of Deployment
- 1.1. Onshore
- 1.2. Offshore
Oil and Gas Industry in Trinidad and Tobago Segmentation By Geography
-
1. North America
- 1.1. United States
- 1.2. Canada
- 1.3. Mexico
-
2. South America
- 2.1. Brazil
- 2.2. Argentina
- 2.3. Rest of South America
-
3. Europe
- 3.1. United Kingdom
- 3.2. Germany
- 3.3. France
- 3.4. Italy
- 3.5. Spain
- 3.6. Russia
- 3.7. Benelux
- 3.8. Nordics
- 3.9. Rest of Europe
-
4. Middle East & Africa
- 4.1. Turkey
- 4.2. Israel
- 4.3. GCC
- 4.4. North Africa
- 4.5. South Africa
- 4.6. Rest of Middle East & Africa
-
5. Asia Pacific
- 5.1. China
- 5.2. India
- 5.3. Japan
- 5.4. South Korea
- 5.5. ASEAN
- 5.6. Oceania
- 5.7. Rest of Asia Pacific
Oil and Gas Industry in Trinidad and Tobago REPORT HIGHLIGHTS
| Aspects | Details |
|---|---|
| Study Period | 2019-2033 |
| Base Year | 2024 |
| Estimated Year | 2025 |
| Forecast Period | 2025-2033 |
| Historical Period | 2019-2024 |
| Growth Rate | CAGR of < 4.40% from 2019-2033 |
| Segmentation |
|
Table of Contents
- 1. Introduction
- 1.1. Research Scope
- 1.2. Market Segmentation
- 1.3. Research Methodology
- 1.4. Definitions and Assumptions
- 2. Executive Summary
- 2.1. Introduction
- 3. Market Dynamics
- 3.1. Introduction
- 3.2. Market Drivers
- 3.2.1. 4.; Increasing Investment in Oil and Gas Sector4.; Supportive Government Policies
- 3.3. Market Restrains
- 3.3.1. 4.; Inclination towards renewable energy
- 3.4. Market Trends
- 3.4.1. Offshore Oil and Gas Production to Dominate the Market
- 4. Market Factor Analysis
- 4.1. Porters Five Forces
- 4.2. Supply/Value Chain
- 4.3. PESTEL analysis
- 4.4. Market Entropy
- 4.5. Patent/Trademark Analysis
- 5. Global Oil and Gas Industry in Trinidad and Tobago Analysis, Insights and Forecast, 2019-2031
- 5.1. Market Analysis, Insights and Forecast - by Location of Deployment
- 5.1.1. Onshore
- 5.1.2. Offshore
- 5.2. Market Analysis, Insights and Forecast - by Region
- 5.2.1. North America
- 5.2.2. South America
- 5.2.3. Europe
- 5.2.4. Middle East & Africa
- 5.2.5. Asia Pacific
- 5.1. Market Analysis, Insights and Forecast - by Location of Deployment
- 6. North America Oil and Gas Industry in Trinidad and Tobago Analysis, Insights and Forecast, 2019-2031
- 6.1. Market Analysis, Insights and Forecast - by Location of Deployment
- 6.1.1. Onshore
- 6.1.2. Offshore
- 6.1. Market Analysis, Insights and Forecast - by Location of Deployment
- 7. South America Oil and Gas Industry in Trinidad and Tobago Analysis, Insights and Forecast, 2019-2031
- 7.1. Market Analysis, Insights and Forecast - by Location of Deployment
- 7.1.1. Onshore
- 7.1.2. Offshore
- 7.1. Market Analysis, Insights and Forecast - by Location of Deployment
- 8. Europe Oil and Gas Industry in Trinidad and Tobago Analysis, Insights and Forecast, 2019-2031
- 8.1. Market Analysis, Insights and Forecast - by Location of Deployment
- 8.1.1. Onshore
- 8.1.2. Offshore
- 8.1. Market Analysis, Insights and Forecast - by Location of Deployment
- 9. Middle East & Africa Oil and Gas Industry in Trinidad and Tobago Analysis, Insights and Forecast, 2019-2031
- 9.1. Market Analysis, Insights and Forecast - by Location of Deployment
- 9.1.1. Onshore
- 9.1.2. Offshore
- 9.1. Market Analysis, Insights and Forecast - by Location of Deployment
- 10. Asia Pacific Oil and Gas Industry in Trinidad and Tobago Analysis, Insights and Forecast, 2019-2031
- 10.1. Market Analysis, Insights and Forecast - by Location of Deployment
- 10.1.1. Onshore
- 10.1.2. Offshore
- 10.1. Market Analysis, Insights and Forecast - by Location of Deployment
- 11. Competitive Analysis
- 11.1. Global Market Share Analysis 2024
- 11.2. Company Profiles
- 11.2.1 The National Gas Company of Trinidad and Tobago Limited
- 11.2.1.1. Overview
- 11.2.1.2. Products
- 11.2.1.3. SWOT Analysis
- 11.2.1.4. Recent Developments
- 11.2.1.5. Financials (Based on Availability)
- 11.2.2 Shell Trinidad & Tobago Limited
- 11.2.2.1. Overview
- 11.2.2.2. Products
- 11.2.2.3. SWOT Analysis
- 11.2.2.4. Recent Developments
- 11.2.2.5. Financials (Based on Availability)
- 11.2.3 BHP Group PLC *List Not Exhaustive
- 11.2.3.1. Overview
- 11.2.3.2. Products
- 11.2.3.3. SWOT Analysis
- 11.2.3.4. Recent Developments
- 11.2.3.5. Financials (Based on Availability)
- 11.2.4 BP PLC
- 11.2.4.1. Overview
- 11.2.4.2. Products
- 11.2.4.3. SWOT Analysis
- 11.2.4.4. Recent Developments
- 11.2.4.5. Financials (Based on Availability)
- 11.2.5 EOG Resources Inc
- 11.2.5.1. Overview
- 11.2.5.2. Products
- 11.2.5.3. SWOT Analysis
- 11.2.5.4. Recent Developments
- 11.2.5.5. Financials (Based on Availability)
- 11.2.1 The National Gas Company of Trinidad and Tobago Limited
List of Figures
- Figure 1: Global Oil and Gas Industry in Trinidad and Tobago Revenue Breakdown (Million, %) by Region 2024 & 2032
- Figure 2: Trinidad and Tobago Oil and Gas Industry in Trinidad and Tobago Revenue (Million), by Country 2024 & 2032
- Figure 3: Trinidad and Tobago Oil and Gas Industry in Trinidad and Tobago Revenue Share (%), by Country 2024 & 2032
- Figure 4: North America Oil and Gas Industry in Trinidad and Tobago Revenue (Million), by Location of Deployment 2024 & 2032
- Figure 5: North America Oil and Gas Industry in Trinidad and Tobago Revenue Share (%), by Location of Deployment 2024 & 2032
- Figure 6: North America Oil and Gas Industry in Trinidad and Tobago Revenue (Million), by Country 2024 & 2032
- Figure 7: North America Oil and Gas Industry in Trinidad and Tobago Revenue Share (%), by Country 2024 & 2032
- Figure 8: South America Oil and Gas Industry in Trinidad and Tobago Revenue (Million), by Location of Deployment 2024 & 2032
- Figure 9: South America Oil and Gas Industry in Trinidad and Tobago Revenue Share (%), by Location of Deployment 2024 & 2032
- Figure 10: South America Oil and Gas Industry in Trinidad and Tobago Revenue (Million), by Country 2024 & 2032
- Figure 11: South America Oil and Gas Industry in Trinidad and Tobago Revenue Share (%), by Country 2024 & 2032
- Figure 12: Europe Oil and Gas Industry in Trinidad and Tobago Revenue (Million), by Location of Deployment 2024 & 2032
- Figure 13: Europe Oil and Gas Industry in Trinidad and Tobago Revenue Share (%), by Location of Deployment 2024 & 2032
- Figure 14: Europe Oil and Gas Industry in Trinidad and Tobago Revenue (Million), by Country 2024 & 2032
- Figure 15: Europe Oil and Gas Industry in Trinidad and Tobago Revenue Share (%), by Country 2024 & 2032
- Figure 16: Middle East & Africa Oil and Gas Industry in Trinidad and Tobago Revenue (Million), by Location of Deployment 2024 & 2032
- Figure 17: Middle East & Africa Oil and Gas Industry in Trinidad and Tobago Revenue Share (%), by Location of Deployment 2024 & 2032
- Figure 18: Middle East & Africa Oil and Gas Industry in Trinidad and Tobago Revenue (Million), by Country 2024 & 2032
- Figure 19: Middle East & Africa Oil and Gas Industry in Trinidad and Tobago Revenue Share (%), by Country 2024 & 2032
- Figure 20: Asia Pacific Oil and Gas Industry in Trinidad and Tobago Revenue (Million), by Location of Deployment 2024 & 2032
- Figure 21: Asia Pacific Oil and Gas Industry in Trinidad and Tobago Revenue Share (%), by Location of Deployment 2024 & 2032
- Figure 22: Asia Pacific Oil and Gas Industry in Trinidad and Tobago Revenue (Million), by Country 2024 & 2032
- Figure 23: Asia Pacific Oil and Gas Industry in Trinidad and Tobago Revenue Share (%), by Country 2024 & 2032
List of Tables
- Table 1: Global Oil and Gas Industry in Trinidad and Tobago Revenue Million Forecast, by Region 2019 & 2032
- Table 2: Global Oil and Gas Industry in Trinidad and Tobago Revenue Million Forecast, by Location of Deployment 2019 & 2032
- Table 3: Global Oil and Gas Industry in Trinidad and Tobago Revenue Million Forecast, by Region 2019 & 2032
- Table 4: Global Oil and Gas Industry in Trinidad and Tobago Revenue Million Forecast, by Country 2019 & 2032
- Table 5: Global Oil and Gas Industry in Trinidad and Tobago Revenue Million Forecast, by Location of Deployment 2019 & 2032
- Table 6: Global Oil and Gas Industry in Trinidad and Tobago Revenue Million Forecast, by Country 2019 & 2032
- Table 7: United States Oil and Gas Industry in Trinidad and Tobago Revenue (Million) Forecast, by Application 2019 & 2032
- Table 8: Canada Oil and Gas Industry in Trinidad and Tobago Revenue (Million) Forecast, by Application 2019 & 2032
- Table 9: Mexico Oil and Gas Industry in Trinidad and Tobago Revenue (Million) Forecast, by Application 2019 & 2032
- Table 10: Global Oil and Gas Industry in Trinidad and Tobago Revenue Million Forecast, by Location of Deployment 2019 & 2032
- Table 11: Global Oil and Gas Industry in Trinidad and Tobago Revenue Million Forecast, by Country 2019 & 2032
- Table 12: Brazil Oil and Gas Industry in Trinidad and Tobago Revenue (Million) Forecast, by Application 2019 & 2032
- Table 13: Argentina Oil and Gas Industry in Trinidad and Tobago Revenue (Million) Forecast, by Application 2019 & 2032
- Table 14: Rest of South America Oil and Gas Industry in Trinidad and Tobago Revenue (Million) Forecast, by Application 2019 & 2032
- Table 15: Global Oil and Gas Industry in Trinidad and Tobago Revenue Million Forecast, by Location of Deployment 2019 & 2032
- Table 16: Global Oil and Gas Industry in Trinidad and Tobago Revenue Million Forecast, by Country 2019 & 2032
- Table 17: United Kingdom Oil and Gas Industry in Trinidad and Tobago Revenue (Million) Forecast, by Application 2019 & 2032
- Table 18: Germany Oil and Gas Industry in Trinidad and Tobago Revenue (Million) Forecast, by Application 2019 & 2032
- Table 19: France Oil and Gas Industry in Trinidad and Tobago Revenue (Million) Forecast, by Application 2019 & 2032
- Table 20: Italy Oil and Gas Industry in Trinidad and Tobago Revenue (Million) Forecast, by Application 2019 & 2032
- Table 21: Spain Oil and Gas Industry in Trinidad and Tobago Revenue (Million) Forecast, by Application 2019 & 2032
- Table 22: Russia Oil and Gas Industry in Trinidad and Tobago Revenue (Million) Forecast, by Application 2019 & 2032
- Table 23: Benelux Oil and Gas Industry in Trinidad and Tobago Revenue (Million) Forecast, by Application 2019 & 2032
- Table 24: Nordics Oil and Gas Industry in Trinidad and Tobago Revenue (Million) Forecast, by Application 2019 & 2032
- Table 25: Rest of Europe Oil and Gas Industry in Trinidad and Tobago Revenue (Million) Forecast, by Application 2019 & 2032
- Table 26: Global Oil and Gas Industry in Trinidad and Tobago Revenue Million Forecast, by Location of Deployment 2019 & 2032
- Table 27: Global Oil and Gas Industry in Trinidad and Tobago Revenue Million Forecast, by Country 2019 & 2032
- Table 28: Turkey Oil and Gas Industry in Trinidad and Tobago Revenue (Million) Forecast, by Application 2019 & 2032
- Table 29: Israel Oil and Gas Industry in Trinidad and Tobago Revenue (Million) Forecast, by Application 2019 & 2032
- Table 30: GCC Oil and Gas Industry in Trinidad and Tobago Revenue (Million) Forecast, by Application 2019 & 2032
- Table 31: North Africa Oil and Gas Industry in Trinidad and Tobago Revenue (Million) Forecast, by Application 2019 & 2032
- Table 32: South Africa Oil and Gas Industry in Trinidad and Tobago Revenue (Million) Forecast, by Application 2019 & 2032
- Table 33: Rest of Middle East & Africa Oil and Gas Industry in Trinidad and Tobago Revenue (Million) Forecast, by Application 2019 & 2032
- Table 34: Global Oil and Gas Industry in Trinidad and Tobago Revenue Million Forecast, by Location of Deployment 2019 & 2032
- Table 35: Global Oil and Gas Industry in Trinidad and Tobago Revenue Million Forecast, by Country 2019 & 2032
- Table 36: China Oil and Gas Industry in Trinidad and Tobago Revenue (Million) Forecast, by Application 2019 & 2032
- Table 37: India Oil and Gas Industry in Trinidad and Tobago Revenue (Million) Forecast, by Application 2019 & 2032
- Table 38: Japan Oil and Gas Industry in Trinidad and Tobago Revenue (Million) Forecast, by Application 2019 & 2032
- Table 39: South Korea Oil and Gas Industry in Trinidad and Tobago Revenue (Million) Forecast, by Application 2019 & 2032
- Table 40: ASEAN Oil and Gas Industry in Trinidad and Tobago Revenue (Million) Forecast, by Application 2019 & 2032
- Table 41: Oceania Oil and Gas Industry in Trinidad and Tobago Revenue (Million) Forecast, by Application 2019 & 2032
- Table 42: Rest of Asia Pacific Oil and Gas Industry in Trinidad and Tobago Revenue (Million) Forecast, by Application 2019 & 2032
Frequently Asked Questions
1. What is the projected Compound Annual Growth Rate (CAGR) of the Oil and Gas Industry in Trinidad and Tobago?
The projected CAGR is approximately < 4.40%.
2. Which companies are prominent players in the Oil and Gas Industry in Trinidad and Tobago?
Key companies in the market include The National Gas Company of Trinidad and Tobago Limited, Shell Trinidad & Tobago Limited, BHP Group PLC *List Not Exhaustive, BP PLC, EOG Resources Inc.
3. What are the main segments of the Oil and Gas Industry in Trinidad and Tobago?
The market segments include Location of Deployment.
4. Can you provide details about the market size?
The market size is estimated to be USD XX Million as of 2022.
5. What are some drivers contributing to market growth?
4.; Increasing Investment in Oil and Gas Sector4.; Supportive Government Policies.
6. What are the notable trends driving market growth?
Offshore Oil and Gas Production to Dominate the Market.
7. Are there any restraints impacting market growth?
4.; Inclination towards renewable energy.
8. Can you provide examples of recent developments in the market?
N/A
9. What pricing options are available for accessing the report?
Pricing options include single-user, multi-user, and enterprise licenses priced at USD 3800, USD 4500, and USD 5800 respectively.
10. Is the market size provided in terms of value or volume?
The market size is provided in terms of value, measured in Million.
11. Are there any specific market keywords associated with the report?
Yes, the market keyword associated with the report is "Oil and Gas Industry in Trinidad and Tobago," which aids in identifying and referencing the specific market segment covered.
12. How do I determine which pricing option suits my needs best?
The pricing options vary based on user requirements and access needs. Individual users may opt for single-user licenses, while businesses requiring broader access may choose multi-user or enterprise licenses for cost-effective access to the report.
13. Are there any additional resources or data provided in the Oil and Gas Industry in Trinidad and Tobago report?
While the report offers comprehensive insights, it's advisable to review the specific contents or supplementary materials provided to ascertain if additional resources or data are available.
14. How can I stay updated on further developments or reports in the Oil and Gas Industry in Trinidad and Tobago?
To stay informed about further developments, trends, and reports in the Oil and Gas Industry in Trinidad and Tobago, consider subscribing to industry newsletters, following relevant companies and organizations, or regularly checking reputable industry news sources and publications.
Methodology
Step 1 - Identification of Relevant Samples Size from Population Database


Step 2 - Approaches for Defining Global Market Size (Value, Volume* & Price*)

Note*: In applicable scenarios
Step 3 - Data Sources
Primary Research
- Web Analytics
- Survey Reports
- Research Institute
- Latest Research Reports
- Opinion Leaders
Secondary Research
- Annual Reports
- White Paper
- Latest Press Release
- Industry Association
- Paid Database
- Investor Presentations

Step 4 - Data Triangulation
Involves using different sources of information in order to increase the validity of a study
These sources are likely to be stakeholders in a program - participants, other researchers, program staff, other community members, and so on.
Then we put all data in single framework & apply various statistical tools to find out the dynamic on the market.
During the analysis stage, feedback from the stakeholder groups would be compared to determine areas of agreement as well as areas of divergence
