

Key Insights
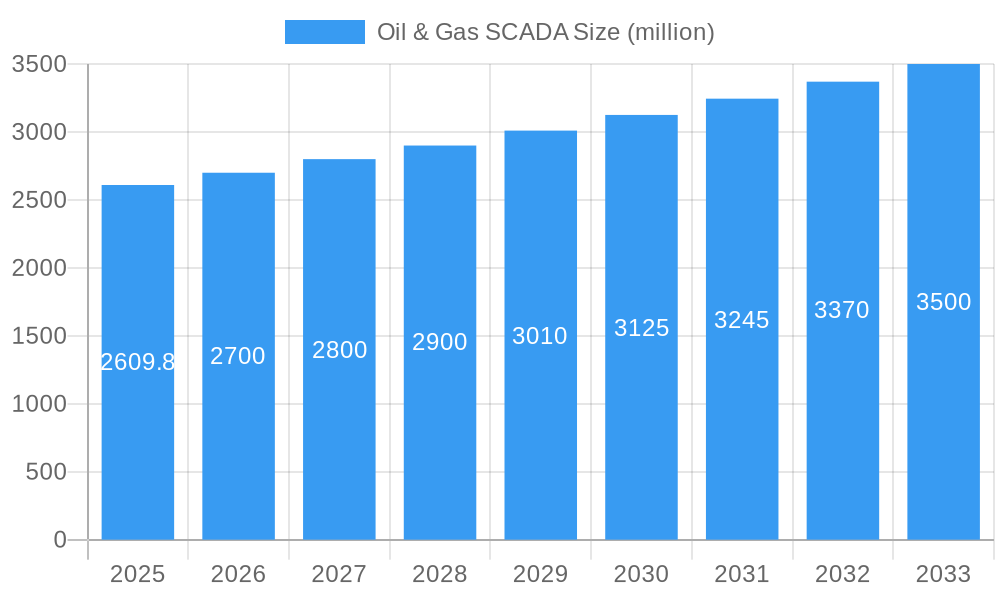
The Oil & Gas SCADA market, valued at $2609.8 million in 2025, is projected to experience steady growth, driven by increasing demand for enhanced operational efficiency, improved safety measures, and the need for real-time monitoring and control in oil and gas operations. The market's Compound Annual Growth Rate (CAGR) of 3.3% from 2019 to 2025 indicates a consistent, albeit moderate, expansion. Key drivers include the growing adoption of automation technologies, increasing investments in digitalization across the oil and gas sector, and the stringent regulatory requirements for safety and environmental compliance. Furthermore, the expanding use of advanced analytics and predictive maintenance capabilities within SCADA systems is boosting market growth. Challenges include the high initial investment costs associated with implementing SCADA systems and the need for specialized expertise for installation and maintenance. However, the long-term benefits of improved efficiency and reduced operational risks outweigh these initial hurdles, fostering market expansion.
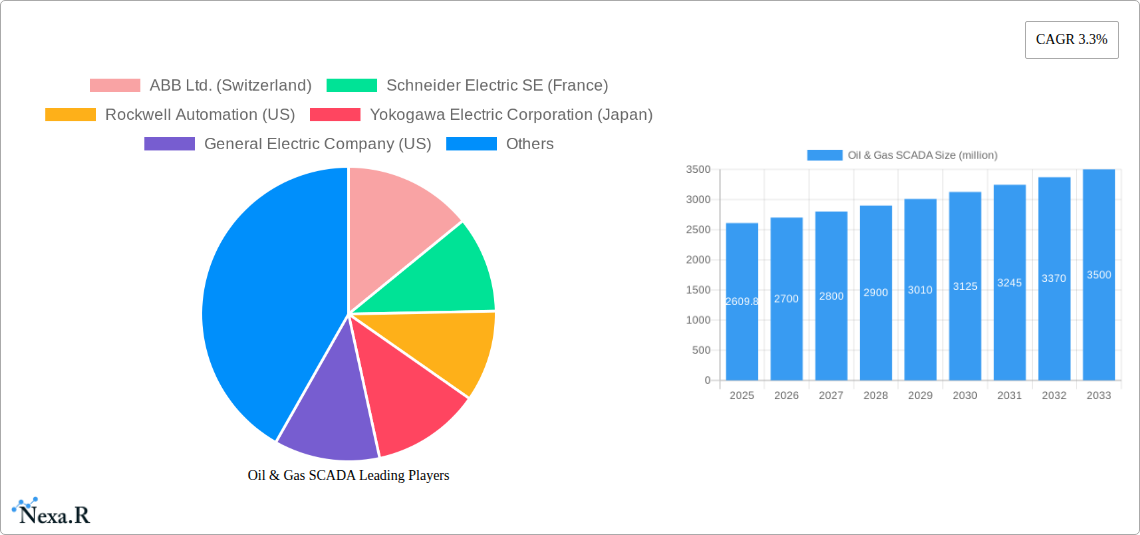
Oil & Gas SCADA Market Size (In Billion)
The market segmentation, while not explicitly detailed, likely includes variations based on component type (hardware, software, services), application (upstream, midstream, downstream), and deployment model (cloud-based, on-premise). Leading players like ABB, Schneider Electric, Rockwell Automation, and Siemens are leveraging their strong technological capabilities and established market presence to capture a significant share. The geographical distribution is likely skewed towards North America and Europe initially, with emerging markets in Asia-Pacific and the Middle East exhibiting strong growth potential driven by ongoing infrastructure development and increasing oil and gas production. The forecast period (2025-2033) suggests continued market expansion, fueled by the ongoing digital transformation within the oil and gas industry, further technological advancements, and a sustained global demand for energy.
Oil & Gas SCADA Company Market Share
This comprehensive report provides an in-depth analysis of the Oil & Gas Supervisory Control and Data Acquisition (SCADA) market, covering market dynamics, growth trends, regional dominance, product landscape, key players, and future outlook. The study period spans from 2019 to 2033, with 2025 serving as both the base and estimated year. The forecast period extends from 2025 to 2033, while the historical period encompasses 2019-2024. This report is essential for industry professionals, investors, and stakeholders seeking to understand and capitalize on opportunities within this dynamic market. The global market size in 2025 is estimated at $xx billion.
Oil & Gas SCADA Market Dynamics & Structure
The Oil & Gas SCADA market is characterized by a moderately concentrated landscape, with a few major players holding significant market share. Market concentration is approximately xx%, with the top 5 players accounting for roughly xx% of the market share in 2025. Technological innovation, driven by the increasing adoption of IoT, AI, and cloud computing, is a key driver. Stringent regulatory frameworks concerning safety and environmental compliance influence market growth and product development. Competitive substitutes such as advanced metering infrastructure (AMI) systems pose challenges, while M&A activity remains moderate. The parent market is the broader Industrial Automation market, valued at $xx billion in 2025, while the child market is specifically Oil & Gas Automation.
- Market Concentration: xx% in 2025.
- Top 5 Players Market Share: xx% in 2025.
- M&A Deal Volume (2019-2024): xx deals.
- Key Innovation Drivers: IoT, AI, Cloud Computing, Cybersecurity.
- Regulatory Factors: Environmental regulations (e.g., GHG emissions), safety standards (e.g., IEC 61850).
Oil & Gas SCADA Growth Trends & Insights
The Oil & Gas SCADA market witnessed significant growth during the historical period (2019-2024), driven by increasing automation needs and the adoption of advanced technologies. The market is projected to grow at a Compound Annual Growth Rate (CAGR) of xx% during the forecast period (2025-2033), reaching an estimated value of $xx billion by 2033. This growth is propelled by factors including rising demand for enhanced operational efficiency, improved asset management, and real-time data analytics. Market penetration is currently at xx% and is expected to increase to xx% by 2033. Technological disruptions such as the integration of IIoT and the rise of digital twins are reshaping the market dynamics, leading to improved decision-making and reduced operational costs. Consumer behavior is shifting towards more integrated and data-driven solutions, favoring vendors offering comprehensive platforms.
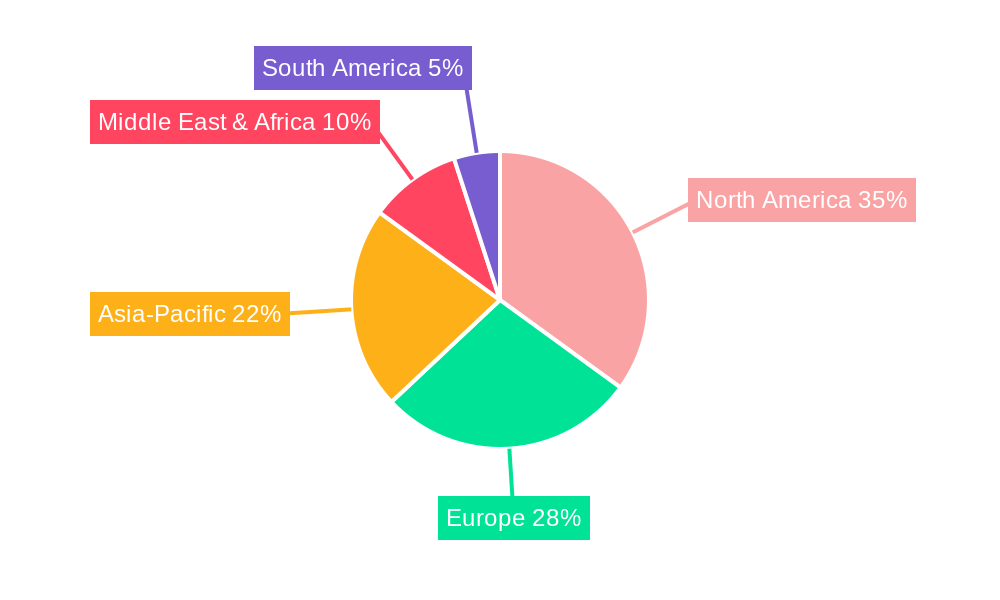
Dominant Regions, Countries, or Segments in Oil & Gas SCADA
The North American region dominated the Oil & Gas SCADA market in 2025, holding a market share of approximately xx%, followed by Europe at xx% and the Asia-Pacific region at xx%. This dominance is primarily due to the significant presence of major oil and gas companies, well-established infrastructure, and supportive regulatory environments. Within the segments, onshore oil and gas operations represent a larger market compared to offshore, reflecting easier accessibility and lower initial installation costs.
- North America: High oil and gas production, established infrastructure, and technological advancements.
- Europe: Stringent environmental regulations driving technological adoption, significant investments in renewable energy integration.
- Asia-Pacific: Rapid industrialization, growing energy demand, increasing investments in oil and gas exploration and production.
Oil & Gas SCADA Product Landscape
Oil & Gas SCADA systems are evolving rapidly, integrating advanced functionalities such as predictive maintenance, remote monitoring, and cybersecurity enhancements. Key innovations include the adoption of cloud-based platforms, edge computing technologies, and AI-powered analytics. This results in improved operational efficiency, enhanced safety measures, and reduced downtime. Unique selling propositions often center around ease of integration, scalability, and robust cybersecurity features.
Key Drivers, Barriers & Challenges in Oil & Gas SCADA
Key Drivers:
- Increased demand for enhanced operational efficiency and reduced operational expenditures.
- Growing adoption of advanced technologies such as IoT, AI, and cloud computing.
- Stringent government regulations related to environmental compliance and safety.
Key Challenges & Restraints:
- High initial investment costs for implementing SCADA systems, particularly for smaller companies.
- Cybersecurity threats and the need for robust security measures to prevent data breaches.
- Integration complexities in existing infrastructure and legacy systems. Supply chain disruptions can also affect the delivery timeline and cost.
Emerging Opportunities in Oil & Gas SCADA
Emerging opportunities lie in the integration of SCADA with other technologies, such as drones and digital twins, to further enhance efficiency and safety. The expansion into untapped markets, particularly in developing countries, offers substantial potential. Increased demand for predictive maintenance solutions and real-time data analytics presents additional avenues for growth.
Growth Accelerators in the Oil & Gas SCADA Industry
Technological breakthroughs in areas like AI, machine learning, and cloud computing are accelerating market growth. Strategic partnerships between SCADA vendors and oil & gas companies are driving innovation and market expansion. Furthermore, increased government initiatives supporting digitalization in the energy sector are creating a positive environment for market expansion.
Key Players Shaping the Oil & Gas SCADA Market
- ABB Ltd.
- Schneider Electric SE
- Rockwell Automation
- Yokogawa Electric Corporation
- General Electric Company
- Honeywell International Inc.
- CygNet Software
- Siemens AG
- Quorum Business Solutions
- Larsen & Toubro Limited
- ZTE Corporation
- PSI AG
- Mitsubishi Electric Corporation
- Orbcomm Inc.
- Iconics
- Detechtion Technologies
- eLynx Technologies, LLC
- Globalogix
- TRC Advanced Technologies Inc.
- Inductive Automation
- International Business Machines Corporation
- TechnipFMC plc
- Emerson Electric Co.
- Bentek Systems
- PetroCloud, LLC
Notable Milestones in Oil & Gas SCADA Sector
- 2020: Increased adoption of cloud-based SCADA solutions.
- 2021: Launch of several AI-powered SCADA platforms.
- 2022: Significant investments in cybersecurity for SCADA systems.
- 2023: Several mergers and acquisitions among SCADA vendors.
- 2024: Growing adoption of predictive maintenance solutions.
In-Depth Oil & Gas SCADA Market Outlook
The Oil & Gas SCADA market is poised for continued growth, driven by technological advancements, increasing digitalization efforts within the industry, and the need for improved operational efficiency and safety. Strategic partnerships, expansion into emerging markets, and the development of innovative solutions will play a crucial role in shaping the future of this market. The long-term outlook is positive, with significant potential for growth and innovation.
Oil & Gas SCADA Segmentation
-
1. Application
- 1.1. Onshore Oil & Gas
- 1.2. Offshore Oil & Gas
-
2. Types
- 2.1. Hardware
- 2.2. Software
- 2.3. Service
Oil & Gas SCADA Segmentation By Geography
-
1. North America
- 1.1. United States
- 1.2. Canada
- 1.3. Mexico
-
2. South America
- 2.1. Brazil
- 2.2. Argentina
- 2.3. Rest of South America
-
3. Europe
- 3.1. United Kingdom
- 3.2. Germany
- 3.3. France
- 3.4. Italy
- 3.5. Spain
- 3.6. Russia
- 3.7. Benelux
- 3.8. Nordics
- 3.9. Rest of Europe
-
4. Middle East & Africa
- 4.1. Turkey
- 4.2. Israel
- 4.3. GCC
- 4.4. North Africa
- 4.5. South Africa
- 4.6. Rest of Middle East & Africa
-
5. Asia Pacific
- 5.1. China
- 5.2. India
- 5.3. Japan
- 5.4. South Korea
- 5.5. ASEAN
- 5.6. Oceania
- 5.7. Rest of Asia Pacific
Oil & Gas SCADA Regional Market Share
Geographic Coverage of Oil & Gas SCADA
Oil & Gas SCADA REPORT HIGHLIGHTS
| Aspects | Details |
|---|---|
| Study Period | 2020-2034 |
| Base Year | 2025 |
| Estimated Year | 2026 |
| Forecast Period | 2026-2034 |
| Historical Period | 2020-2025 |
| Growth Rate | CAGR of 3.3% from 2020-2034 |
| Segmentation |
|
Table of Contents
- 1. Introduction
- 1.1. Research Scope
- 1.2. Market Segmentation
- 1.3. Research Objective
- 1.4. Definitions and Assumptions
- 2. Executive Summary
- 2.1. Market Snapshot
- 3. Market Dynamics
- 3.1. Market Drivers
- 3.2. Market Restrains
- 3.3. Market Trends
- 3.4. Market Opportunities
- 4. Market Factor Analysis
- 4.1. Porters Five Forces
- 4.1.1. Bargaining Power of Suppliers
- 4.1.2. Bargaining Power of Buyers
- 4.1.3. Threat of New Entrants
- 4.1.4. Threat of Substitutes
- 4.1.5. Competitive Rivalry
- 4.2. PESTEL analysis
- 4.3. BCG Analysis
- 4.3.1. Stars (High Growth, High Market Share)
- 4.3.2. Cash Cows (Low Growth, High Market Share)
- 4.3.3. Question Mark (High Growth, Low Market Share)
- 4.3.4. Dogs (Low Growth, Low Market Share)
- 4.4. Ansoff Matrix Analysis
- 4.5. Supply Chain Analysis
- 4.6. Regulatory Landscape
- 4.7. Current Market Potential and Opportunity Assessment (TAM–SAM–SOM Framework)
- 4.8. NRP Analyst Note
- 4.1. Porters Five Forces
- 5. Market Analysis, Insights and Forecast 2021-2033
- 5.1. Market Analysis, Insights and Forecast - by Application
- 5.1.1. Onshore Oil & Gas
- 5.1.2. Offshore Oil & Gas
- 5.2. Market Analysis, Insights and Forecast - by Types
- 5.2.1. Hardware
- 5.2.2. Software
- 5.2.3. Service
- 5.3. Market Analysis, Insights and Forecast - by Region
- 5.3.1. North America
- 5.3.2. South America
- 5.3.3. Europe
- 5.3.4. Middle East & Africa
- 5.3.5. Asia Pacific
- 5.1. Market Analysis, Insights and Forecast - by Application
- 6. Global Oil & Gas SCADA Analysis, Insights and Forecast, 2021-2033
- 6.1. Market Analysis, Insights and Forecast - by Application
- 6.1.1. Onshore Oil & Gas
- 6.1.2. Offshore Oil & Gas
- 6.2. Market Analysis, Insights and Forecast - by Types
- 6.2.1. Hardware
- 6.2.2. Software
- 6.2.3. Service
- 6.1. Market Analysis, Insights and Forecast - by Application
- 7. North America Oil & Gas SCADA Analysis, Insights and Forecast, 2020-2032
- 7.1. Market Analysis, Insights and Forecast - by Application
- 7.1.1. Onshore Oil & Gas
- 7.1.2. Offshore Oil & Gas
- 7.2. Market Analysis, Insights and Forecast - by Types
- 7.2.1. Hardware
- 7.2.2. Software
- 7.2.3. Service
- 7.1. Market Analysis, Insights and Forecast - by Application
- 8. South America Oil & Gas SCADA Analysis, Insights and Forecast, 2020-2032
- 8.1. Market Analysis, Insights and Forecast - by Application
- 8.1.1. Onshore Oil & Gas
- 8.1.2. Offshore Oil & Gas
- 8.2. Market Analysis, Insights and Forecast - by Types
- 8.2.1. Hardware
- 8.2.2. Software
- 8.2.3. Service
- 8.1. Market Analysis, Insights and Forecast - by Application
- 9. Europe Oil & Gas SCADA Analysis, Insights and Forecast, 2020-2032
- 9.1. Market Analysis, Insights and Forecast - by Application
- 9.1.1. Onshore Oil & Gas
- 9.1.2. Offshore Oil & Gas
- 9.2. Market Analysis, Insights and Forecast - by Types
- 9.2.1. Hardware
- 9.2.2. Software
- 9.2.3. Service
- 9.1. Market Analysis, Insights and Forecast - by Application
- 10. Middle East & Africa Oil & Gas SCADA Analysis, Insights and Forecast, 2020-2032
- 10.1. Market Analysis, Insights and Forecast - by Application
- 10.1.1. Onshore Oil & Gas
- 10.1.2. Offshore Oil & Gas
- 10.2. Market Analysis, Insights and Forecast - by Types
- 10.2.1. Hardware
- 10.2.2. Software
- 10.2.3. Service
- 10.1. Market Analysis, Insights and Forecast - by Application
- 11. Asia Pacific Oil & Gas SCADA Analysis, Insights and Forecast, 2020-2032
- 11.1. Market Analysis, Insights and Forecast - by Application
- 11.1.1. Onshore Oil & Gas
- 11.1.2. Offshore Oil & Gas
- 11.2. Market Analysis, Insights and Forecast - by Types
- 11.2.1. Hardware
- 11.2.2. Software
- 11.2.3. Service
- 11.1. Market Analysis, Insights and Forecast - by Application
- 12. Competitive Analysis
- 12.1. Company Profiles
- 12.1.1 ABB Ltd. (Switzerland)
- 12.1.1.1. Company Overview
- 12.1.1.2. Products
- 12.1.1.3. Company Financials
- 12.1.1.4. SWOT Analysis
- 12.1.2 Schneider Electric SE (France)
- 12.1.2.1. Company Overview
- 12.1.2.2. Products
- 12.1.2.3. Company Financials
- 12.1.2.4. SWOT Analysis
- 12.1.3 Rockwell Automation (US)
- 12.1.3.1. Company Overview
- 12.1.3.2. Products
- 12.1.3.3. Company Financials
- 12.1.3.4. SWOT Analysis
- 12.1.4 Yokogawa Electric Corporation (Japan)
- 12.1.4.1. Company Overview
- 12.1.4.2. Products
- 12.1.4.3. Company Financials
- 12.1.4.4. SWOT Analysis
- 12.1.5 General Electric Company (US)
- 12.1.5.1. Company Overview
- 12.1.5.2. Products
- 12.1.5.3. Company Financials
- 12.1.5.4. SWOT Analysis
- 12.1.6 Honeywell International Inc. (US)
- 12.1.6.1. Company Overview
- 12.1.6.2. Products
- 12.1.6.3. Company Financials
- 12.1.6.4. SWOT Analysis
- 12.1.7 CygNet Software (US)
- 12.1.7.1. Company Overview
- 12.1.7.2. Products
- 12.1.7.3. Company Financials
- 12.1.7.4. SWOT Analysis
- 12.1.8 Siemens AG (Germany)
- 12.1.8.1. Company Overview
- 12.1.8.2. Products
- 12.1.8.3. Company Financials
- 12.1.8.4. SWOT Analysis
- 12.1.9 Quorum Business Solutions (US)
- 12.1.9.1. Company Overview
- 12.1.9.2. Products
- 12.1.9.3. Company Financials
- 12.1.9.4. SWOT Analysis
- 12.1.10 Larsen & Toubro Limited (India)
- 12.1.10.1. Company Overview
- 12.1.10.2. Products
- 12.1.10.3. Company Financials
- 12.1.10.4. SWOT Analysis
- 12.1.11 ZTE Corporation (China)
- 12.1.11.1. Company Overview
- 12.1.11.2. Products
- 12.1.11.3. Company Financials
- 12.1.11.4. SWOT Analysis
- 12.1.12 PSI AG (Germany)
- 12.1.12.1. Company Overview
- 12.1.12.2. Products
- 12.1.12.3. Company Financials
- 12.1.12.4. SWOT Analysis
- 12.1.13 Mitsubishi Electric Corporation (Japan)
- 12.1.13.1. Company Overview
- 12.1.13.2. Products
- 12.1.13.3. Company Financials
- 12.1.13.4. SWOT Analysis
- 12.1.14 Orbcomm Inc. (US)
- 12.1.14.1. Company Overview
- 12.1.14.2. Products
- 12.1.14.3. Company Financials
- 12.1.14.4. SWOT Analysis
- 12.1.15 Iconics (US)
- 12.1.15.1. Company Overview
- 12.1.15.2. Products
- 12.1.15.3. Company Financials
- 12.1.15.4. SWOT Analysis
- 12.1.16 Detechtion Technologies (US)
- 12.1.16.1. Company Overview
- 12.1.16.2. Products
- 12.1.16.3. Company Financials
- 12.1.16.4. SWOT Analysis
- 12.1.17 eLynx Technologies
- 12.1.17.1. Company Overview
- 12.1.17.2. Products
- 12.1.17.3. Company Financials
- 12.1.17.4. SWOT Analysis
- 12.1.18 LLC (US)
- 12.1.18.1. Company Overview
- 12.1.18.2. Products
- 12.1.18.3. Company Financials
- 12.1.18.4. SWOT Analysis
- 12.1.19 Globalogix (US)
- 12.1.19.1. Company Overview
- 12.1.19.2. Products
- 12.1.19.3. Company Financials
- 12.1.19.4. SWOT Analysis
- 12.1.20 TRC Advanced Technologies Inc. (US)
- 12.1.20.1. Company Overview
- 12.1.20.2. Products
- 12.1.20.3. Company Financials
- 12.1.20.4. SWOT Analysis
- 12.1.21 Inductive Automation (US)
- 12.1.21.1. Company Overview
- 12.1.21.2. Products
- 12.1.21.3. Company Financials
- 12.1.21.4. SWOT Analysis
- 12.1.22 International Business Machines Corporation (US)
- 12.1.22.1. Company Overview
- 12.1.22.2. Products
- 12.1.22.3. Company Financials
- 12.1.22.4. SWOT Analysis
- 12.1.23 TechnipFMC plc (UK)
- 12.1.23.1. Company Overview
- 12.1.23.2. Products
- 12.1.23.3. Company Financials
- 12.1.23.4. SWOT Analysis
- 12.1.24 Emerson Electric Co. (US)
- 12.1.24.1. Company Overview
- 12.1.24.2. Products
- 12.1.24.3. Company Financials
- 12.1.24.4. SWOT Analysis
- 12.1.25 Bentek Systems (Canada)
- 12.1.25.1. Company Overview
- 12.1.25.2. Products
- 12.1.25.3. Company Financials
- 12.1.25.4. SWOT Analysis
- 12.1.26 PetroCloud
- 12.1.26.1. Company Overview
- 12.1.26.2. Products
- 12.1.26.3. Company Financials
- 12.1.26.4. SWOT Analysis
- 12.1.27 LLC (US)
- 12.1.27.1. Company Overview
- 12.1.27.2. Products
- 12.1.27.3. Company Financials
- 12.1.27.4. SWOT Analysis
- 12.1.1 ABB Ltd. (Switzerland)
- 12.2. Market Entropy
- 12.2.1 Company's Key Areas Served
- 12.2.2 Recent Developments
- 12.3. Company Market Share Analysis 2025
- 12.3.1 Top 5 Companies Market Share Analysis
- 12.3.2 Top 3 Companies Market Share Analysis
- 12.4. List of Potential Customers
- 13. Research Methodology
List of Figures
- Figure 1: Global Oil & Gas SCADA Revenue Breakdown (million, %) by Region 2025 & 2033
- Figure 2: North America Oil & Gas SCADA Revenue (million), by Application 2025 & 2033
- Figure 3: North America Oil & Gas SCADA Revenue Share (%), by Application 2025 & 2033
- Figure 4: North America Oil & Gas SCADA Revenue (million), by Types 2025 & 2033
- Figure 5: North America Oil & Gas SCADA Revenue Share (%), by Types 2025 & 2033
- Figure 6: North America Oil & Gas SCADA Revenue (million), by Country 2025 & 2033
- Figure 7: North America Oil & Gas SCADA Revenue Share (%), by Country 2025 & 2033
- Figure 8: South America Oil & Gas SCADA Revenue (million), by Application 2025 & 2033
- Figure 9: South America Oil & Gas SCADA Revenue Share (%), by Application 2025 & 2033
- Figure 10: South America Oil & Gas SCADA Revenue (million), by Types 2025 & 2033
- Figure 11: South America Oil & Gas SCADA Revenue Share (%), by Types 2025 & 2033
- Figure 12: South America Oil & Gas SCADA Revenue (million), by Country 2025 & 2033
- Figure 13: South America Oil & Gas SCADA Revenue Share (%), by Country 2025 & 2033
- Figure 14: Europe Oil & Gas SCADA Revenue (million), by Application 2025 & 2033
- Figure 15: Europe Oil & Gas SCADA Revenue Share (%), by Application 2025 & 2033
- Figure 16: Europe Oil & Gas SCADA Revenue (million), by Types 2025 & 2033
- Figure 17: Europe Oil & Gas SCADA Revenue Share (%), by Types 2025 & 2033
- Figure 18: Europe Oil & Gas SCADA Revenue (million), by Country 2025 & 2033
- Figure 19: Europe Oil & Gas SCADA Revenue Share (%), by Country 2025 & 2033
- Figure 20: Middle East & Africa Oil & Gas SCADA Revenue (million), by Application 2025 & 2033
- Figure 21: Middle East & Africa Oil & Gas SCADA Revenue Share (%), by Application 2025 & 2033
- Figure 22: Middle East & Africa Oil & Gas SCADA Revenue (million), by Types 2025 & 2033
- Figure 23: Middle East & Africa Oil & Gas SCADA Revenue Share (%), by Types 2025 & 2033
- Figure 24: Middle East & Africa Oil & Gas SCADA Revenue (million), by Country 2025 & 2033
- Figure 25: Middle East & Africa Oil & Gas SCADA Revenue Share (%), by Country 2025 & 2033
- Figure 26: Asia Pacific Oil & Gas SCADA Revenue (million), by Application 2025 & 2033
- Figure 27: Asia Pacific Oil & Gas SCADA Revenue Share (%), by Application 2025 & 2033
- Figure 28: Asia Pacific Oil & Gas SCADA Revenue (million), by Types 2025 & 2033
- Figure 29: Asia Pacific Oil & Gas SCADA Revenue Share (%), by Types 2025 & 2033
- Figure 30: Asia Pacific Oil & Gas SCADA Revenue (million), by Country 2025 & 2033
- Figure 31: Asia Pacific Oil & Gas SCADA Revenue Share (%), by Country 2025 & 2033
List of Tables
- Table 1: Global Oil & Gas SCADA Revenue million Forecast, by Application 2020 & 2033
- Table 2: Global Oil & Gas SCADA Revenue million Forecast, by Types 2020 & 2033
- Table 3: Global Oil & Gas SCADA Revenue million Forecast, by Region 2020 & 2033
- Table 4: Global Oil & Gas SCADA Revenue million Forecast, by Application 2020 & 2033
- Table 5: Global Oil & Gas SCADA Revenue million Forecast, by Types 2020 & 2033
- Table 6: Global Oil & Gas SCADA Revenue million Forecast, by Country 2020 & 2033
- Table 7: United States Oil & Gas SCADA Revenue (million) Forecast, by Application 2020 & 2033
- Table 8: Canada Oil & Gas SCADA Revenue (million) Forecast, by Application 2020 & 2033
- Table 9: Mexico Oil & Gas SCADA Revenue (million) Forecast, by Application 2020 & 2033
- Table 10: Global Oil & Gas SCADA Revenue million Forecast, by Application 2020 & 2033
- Table 11: Global Oil & Gas SCADA Revenue million Forecast, by Types 2020 & 2033
- Table 12: Global Oil & Gas SCADA Revenue million Forecast, by Country 2020 & 2033
- Table 13: Brazil Oil & Gas SCADA Revenue (million) Forecast, by Application 2020 & 2033
- Table 14: Argentina Oil & Gas SCADA Revenue (million) Forecast, by Application 2020 & 2033
- Table 15: Rest of South America Oil & Gas SCADA Revenue (million) Forecast, by Application 2020 & 2033
- Table 16: Global Oil & Gas SCADA Revenue million Forecast, by Application 2020 & 2033
- Table 17: Global Oil & Gas SCADA Revenue million Forecast, by Types 2020 & 2033
- Table 18: Global Oil & Gas SCADA Revenue million Forecast, by Country 2020 & 2033
- Table 19: United Kingdom Oil & Gas SCADA Revenue (million) Forecast, by Application 2020 & 2033
- Table 20: Germany Oil & Gas SCADA Revenue (million) Forecast, by Application 2020 & 2033
- Table 21: France Oil & Gas SCADA Revenue (million) Forecast, by Application 2020 & 2033
- Table 22: Italy Oil & Gas SCADA Revenue (million) Forecast, by Application 2020 & 2033
- Table 23: Spain Oil & Gas SCADA Revenue (million) Forecast, by Application 2020 & 2033
- Table 24: Russia Oil & Gas SCADA Revenue (million) Forecast, by Application 2020 & 2033
- Table 25: Benelux Oil & Gas SCADA Revenue (million) Forecast, by Application 2020 & 2033
- Table 26: Nordics Oil & Gas SCADA Revenue (million) Forecast, by Application 2020 & 2033
- Table 27: Rest of Europe Oil & Gas SCADA Revenue (million) Forecast, by Application 2020 & 2033
- Table 28: Global Oil & Gas SCADA Revenue million Forecast, by Application 2020 & 2033
- Table 29: Global Oil & Gas SCADA Revenue million Forecast, by Types 2020 & 2033
- Table 30: Global Oil & Gas SCADA Revenue million Forecast, by Country 2020 & 2033
- Table 31: Turkey Oil & Gas SCADA Revenue (million) Forecast, by Application 2020 & 2033
- Table 32: Israel Oil & Gas SCADA Revenue (million) Forecast, by Application 2020 & 2033
- Table 33: GCC Oil & Gas SCADA Revenue (million) Forecast, by Application 2020 & 2033
- Table 34: North Africa Oil & Gas SCADA Revenue (million) Forecast, by Application 2020 & 2033
- Table 35: South Africa Oil & Gas SCADA Revenue (million) Forecast, by Application 2020 & 2033
- Table 36: Rest of Middle East & Africa Oil & Gas SCADA Revenue (million) Forecast, by Application 2020 & 2033
- Table 37: Global Oil & Gas SCADA Revenue million Forecast, by Application 2020 & 2033
- Table 38: Global Oil & Gas SCADA Revenue million Forecast, by Types 2020 & 2033
- Table 39: Global Oil & Gas SCADA Revenue million Forecast, by Country 2020 & 2033
- Table 40: China Oil & Gas SCADA Revenue (million) Forecast, by Application 2020 & 2033
- Table 41: India Oil & Gas SCADA Revenue (million) Forecast, by Application 2020 & 2033
- Table 42: Japan Oil & Gas SCADA Revenue (million) Forecast, by Application 2020 & 2033
- Table 43: South Korea Oil & Gas SCADA Revenue (million) Forecast, by Application 2020 & 2033
- Table 44: ASEAN Oil & Gas SCADA Revenue (million) Forecast, by Application 2020 & 2033
- Table 45: Oceania Oil & Gas SCADA Revenue (million) Forecast, by Application 2020 & 2033
- Table 46: Rest of Asia Pacific Oil & Gas SCADA Revenue (million) Forecast, by Application 2020 & 2033
Frequently Asked Questions
1. What is the projected Compound Annual Growth Rate (CAGR) of the Oil & Gas SCADA?
The projected CAGR is approximately 3.3%.
2. Which companies are prominent players in the Oil & Gas SCADA?
Key companies in the market include ABB Ltd. (Switzerland), Schneider Electric SE (France), Rockwell Automation (US), Yokogawa Electric Corporation (Japan), General Electric Company (US), Honeywell International Inc. (US), CygNet Software (US), Siemens AG (Germany), Quorum Business Solutions (US), Larsen & Toubro Limited (India), ZTE Corporation (China), PSI AG (Germany), Mitsubishi Electric Corporation (Japan), Orbcomm Inc. (US), Iconics (US), Detechtion Technologies (US), eLynx Technologies, LLC (US), Globalogix (US), TRC Advanced Technologies Inc. (US), Inductive Automation (US), International Business Machines Corporation (US), TechnipFMC plc (UK), Emerson Electric Co. (US), Bentek Systems (Canada), PetroCloud, LLC (US).
3. What are the main segments of the Oil & Gas SCADA?
The market segments include Application, Types.
4. Can you provide details about the market size?
The market size is estimated to be USD 2609.8 million as of 2022.
5. What are some drivers contributing to market growth?
N/A
6. What are the notable trends driving market growth?
N/A
7. Are there any restraints impacting market growth?
N/A
8. Can you provide examples of recent developments in the market?
N/A
9. What pricing options are available for accessing the report?
Pricing options include single-user, multi-user, and enterprise licenses priced at USD 4900.00, USD 7350.00, and USD 9800.00 respectively.
10. Is the market size provided in terms of value or volume?
The market size is provided in terms of value, measured in million.
11. Are there any specific market keywords associated with the report?
Yes, the market keyword associated with the report is "Oil & Gas SCADA," which aids in identifying and referencing the specific market segment covered.
12. How do I determine which pricing option suits my needs best?
The pricing options vary based on user requirements and access needs. Individual users may opt for single-user licenses, while businesses requiring broader access may choose multi-user or enterprise licenses for cost-effective access to the report.
13. Are there any additional resources or data provided in the Oil & Gas SCADA report?
While the report offers comprehensive insights, it's advisable to review the specific contents or supplementary materials provided to ascertain if additional resources or data are available.
14. How can I stay updated on further developments or reports in the Oil & Gas SCADA?
To stay informed about further developments, trends, and reports in the Oil & Gas SCADA, consider subscribing to industry newsletters, following relevant companies and organizations, or regularly checking reputable industry news sources and publications.
Methodology
Step 1 - Identification of Relevant Samples Size from Population Database


Step 2 - Approaches for Defining Global Market Size (Value, Volume* & Price*)

Note*: In applicable scenarios
Step 3 - Data Sources
Primary Research
- Web Analytics
- Survey Reports
- Research Institute
- Latest Research Reports
- Opinion Leaders
Secondary Research
- Annual Reports
- White Paper
- Latest Press Release
- Industry Association
- Paid Database
- Investor Presentations

Step 4 - Data Triangulation
Involves using different sources of information in order to increase the validity of a study
These sources are likely to be stakeholders in a program - participants, other researchers, program staff, other community members, and so on.
Then we put all data in single framework & apply various statistical tools to find out the dynamic on the market.
During the analysis stage, feedback from the stakeholder groups would be compared to determine areas of agreement as well as areas of divergence