

Key Insights
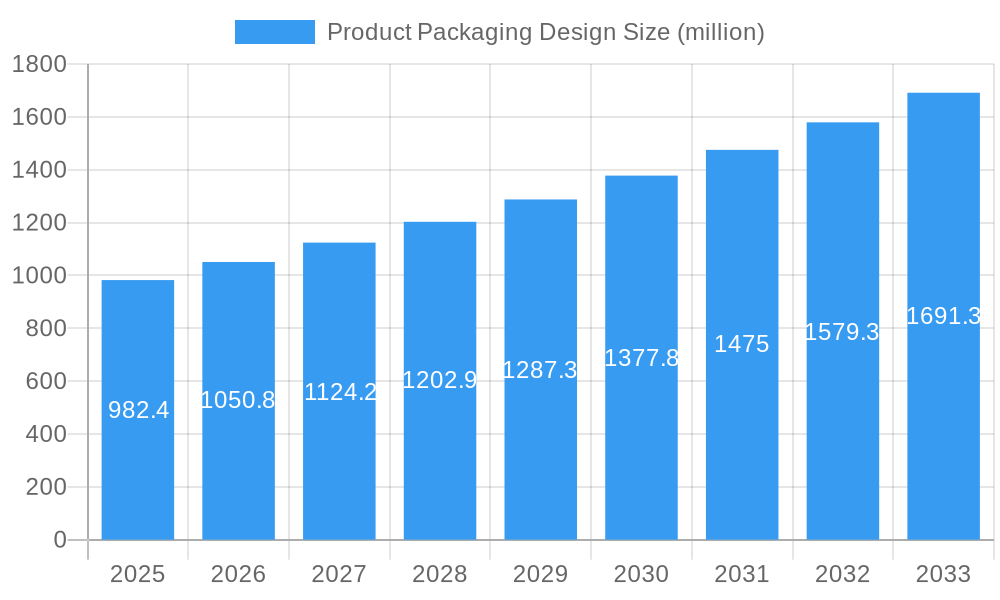
The product packaging design market is experiencing robust growth, projected to reach $982.4 million in 2025 and maintain a Compound Annual Growth Rate (CAGR) of 6.9% from 2025 to 2033. This expansion is fueled by several key factors. E-commerce's continued surge necessitates visually appealing and protective packaging to enhance the unboxing experience and minimize damage during shipping. Brand owners are increasingly recognizing the strategic importance of packaging as a powerful marketing tool, investing in innovative designs to differentiate their products on crowded shelves and resonate with consumers on an emotional level. Sustainability concerns are also driving demand for eco-friendly packaging materials and designs, pushing designers to explore biodegradable and recyclable options. The market's competitive landscape is characterized by a diverse range of agencies, from established giants like Turner Duckworth and Ruckus Marketing to smaller, specialized boutiques like Murmur Creative and Slice Design. This variety caters to businesses of all sizes and across diverse industries, fueling market expansion.
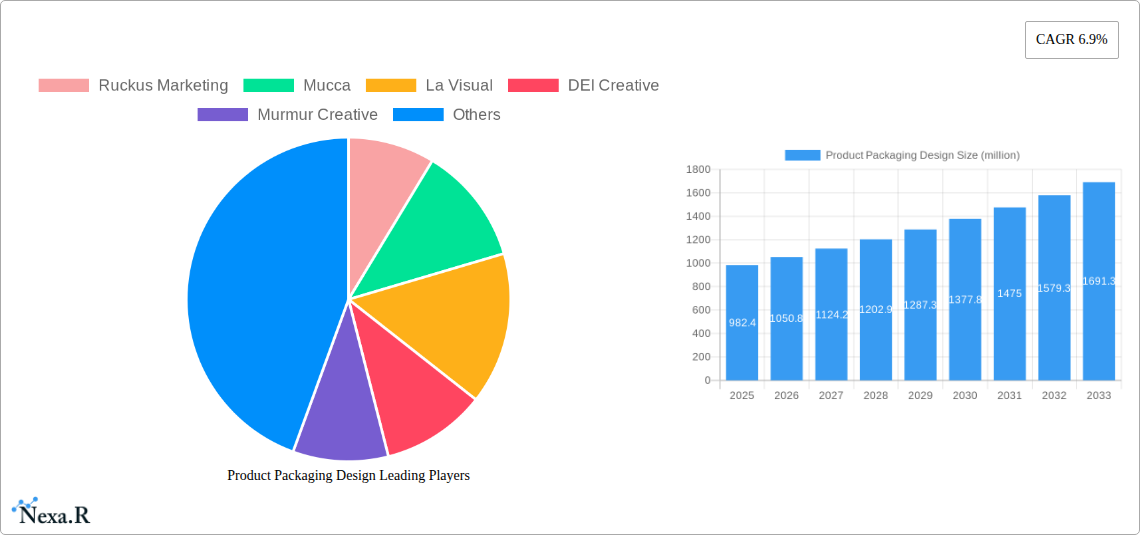
Product Packaging Design Market Size (In Million)
The projected growth trajectory suggests significant opportunities for businesses specializing in product packaging design. Companies are likely to focus on enhancing their digital capabilities to meet the growing needs of e-commerce clients, incorporate sustainable design principles into their offerings, and leverage data analytics to optimize packaging designs based on consumer preferences and market trends. The competitive nature of the market will necessitate continuous innovation and adaptation, emphasizing the importance of creative expertise, efficient project management, and strong client relationships. Regional variations in market growth will likely reflect differences in consumer preferences, e-commerce penetration rates, and regulatory environments. Future growth will depend on factors including the ongoing evolution of e-commerce, the increasing focus on sustainability, and the creative ingenuity of designers to meet changing consumer expectations.
Product Packaging Design Company Market Share
Product Packaging Design Market Report: 2019-2033
This comprehensive report delivers an in-depth analysis of the Product Packaging Design market, encompassing market dynamics, growth trends, regional segmentation, product landscape, key players, and future outlook. The study period spans from 2019 to 2033, with 2025 serving as the base and estimated year. The forecast period extends from 2025 to 2033, while the historical period covers 2019-2024. This report is invaluable for industry professionals, investors, and anyone seeking a comprehensive understanding of this dynamic market. The report analyzes the parent market of Packaging Materials and the child market of Luxury Goods Packaging to provide a nuanced perspective.
Product Packaging Design Market Dynamics & Structure
The Product Packaging Design market, valued at xx million units in 2025, exhibits a moderately concentrated structure, with a few dominant players and numerous smaller agencies vying for market share. Technological innovation, particularly in sustainable materials and digital printing, is a significant growth driver. Stringent regulatory frameworks concerning material sourcing and waste reduction influence design choices. The rise of e-commerce intensifies the demand for visually appealing and protective packaging. Competitive substitutes include generic packaging solutions and in-house design teams, while M&A activity remains relatively low, with approximately xx deals recorded in the historical period. End-user demographics are diverse, ranging from FMCG companies to luxury brands, significantly impacting design trends.
- Market Concentration: Moderately concentrated, with top 5 players holding approximately xx% market share in 2025.
- Technological Innovation: Focus on sustainable materials (e.g., recycled paperboard, biodegradable plastics), augmented reality (AR) integration, and personalized packaging experiences.
- Regulatory Frameworks: Growing emphasis on reducing plastic waste, improving recyclability, and adhering to labeling requirements.
- Competitive Substitutes: Generic packaging, in-house design teams, posing pricing pressure on specialized agencies.
- M&A Activity: xx M&A deals during 2019-2024, indicating a moderate level of consolidation.
- End-User Demographics: Significant diversity across various industries, affecting packaging design trends and preferences.
Product Packaging Design Growth Trends & Insights
The Product Packaging Design market experienced robust growth during the historical period (2019-2024), primarily driven by the increasing demand for premium packaging, particularly in the luxury goods and food & beverage sectors. The market is projected to maintain a CAGR of xx% during the forecast period (2025-2033), reaching an estimated value of xx million units by 2033. This growth is attributed to the rising adoption of sustainable packaging solutions, technological advancements in packaging design software and printing techniques, and shifting consumer preferences towards visually appealing and functional packaging. Increased emphasis on brand storytelling through packaging design also contributes to market growth. Market penetration is expected to increase from xx% in 2025 to xx% in 2033, primarily in developing economies. Technological disruptions, such as the rise of e-commerce and personalized packaging, are reshaping the industry.
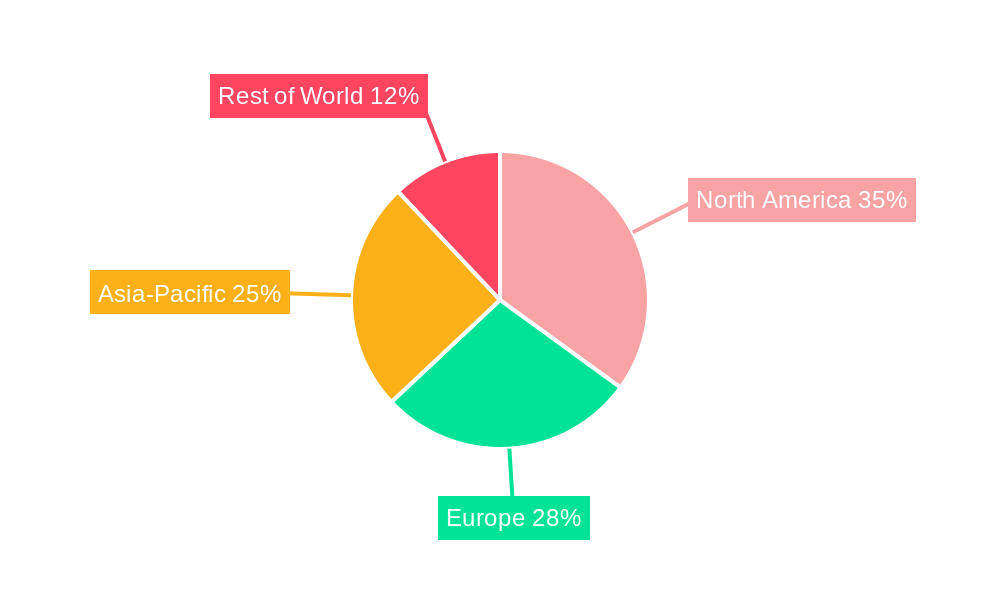
Dominant Regions, Countries, or Segments in Product Packaging Design
North America currently holds the largest market share in the Product Packaging Design market, driven by high consumer spending, a strong presence of major brands, and significant technological advancements. Europe follows as a key region, characterized by stringent environmental regulations that promote sustainable packaging. Asia-Pacific is witnessing rapid growth, fueled by rising disposable incomes and increasing demand for premium products. Within segments, the luxury goods packaging segment exhibits high growth potential owing to its premium pricing and design complexity.
- North America: High consumer spending, strong brand presence, advanced technologies.
- Europe: Stringent environmental regulations driving demand for sustainable packaging.
- Asia-Pacific: Rapid growth due to increasing disposable incomes and premium product demand.
- Luxury Goods Packaging: Premium pricing and complex designs drive significant growth.
Product Packaging Design Product Landscape
The Product Packaging Design market encompasses a wide range of services, including structural design, graphic design, and prototyping. Product innovations focus on sustainable materials, advanced printing techniques (e.g., 3D printing), and interactive packaging features. Key performance indicators (KPIs) include design turnaround time, cost-effectiveness, and environmental impact. Unique selling propositions often involve specialized expertise in specific industry segments or innovative packaging solutions.
Key Drivers, Barriers & Challenges in Product Packaging Design
Key Drivers:
- Rising consumer demand for premium and sustainable packaging.
- Advancements in printing and material technologies.
- Growth of e-commerce driving demand for effective shipping packaging.
Challenges & Restraints:
- Fluctuations in raw material prices.
- Stringent environmental regulations increasing compliance costs.
- Intense competition from both established and new entrants. This leads to a reduction in average profit margins by approximately xx% in 2025 compared to 2019.
Emerging Opportunities in Product Packaging Design
- Growing demand for personalized and customized packaging.
- Expansion into new markets with evolving consumer preferences (e.g., eco-conscious consumers).
- Development of innovative packaging solutions for emerging product categories.
Growth Accelerators in the Product Packaging Design Industry
Technological advancements in materials science, printing technologies, and design software are key catalysts for long-term growth. Strategic partnerships between packaging designers and material suppliers enhance innovation and efficiency. Expansion into new geographical markets and diversification into new industry segments further accelerate market expansion.
Key Players Shaping the Product Packaging Design Market
- Ruckus Marketing
- Mucca
- La Visual
- DEI Creative
- Murmur Creative
- Turner Duckworth
- Pulp+Wire
- 99designs
- Bulletproof
- Chase Design Group
- Force Majeure
- Moxie Sozo
- Ultra Creative
- Hunter Design
- SmashBrand
- Depot Creative
- Column
- DePersico Creative
- Slice Design
Notable Milestones in Product Packaging Design Sector
- 2020: Increased adoption of sustainable packaging materials across multiple industries.
- 2021: Several major brands launched innovative packaging with integrated AR features.
- 2022: Significant investments in research and development of biodegradable packaging solutions.
- 2023: Several mergers and acquisitions within the product packaging design sector.
- 2024: New regulations on plastic packaging implemented in several countries.
In-Depth Product Packaging Design Market Outlook
The Product Packaging Design market is poised for sustained growth, driven by evolving consumer preferences, technological advancements, and increasing focus on sustainability. Strategic opportunities lie in developing innovative packaging solutions, expanding into untapped markets, and forging strategic partnerships to leverage collaborative innovation. The market's future hinges on embracing sustainable practices and meeting the evolving demands of a discerning consumer base.
Product Packaging Design Segmentation
-
1. Application
- 1.1. Large Companies
- 1.2. SMEs
-
2. Types
- 2.1. Food & Beverage Packaging Design
- 2.2. Cosmetics Packaging Design
- 2.3. Liquor & Tobacco Packaging Design
- 2.4. Others Packaging Design
Product Packaging Design Segmentation By Geography
-
1. North America
- 1.1. United States
- 1.2. Canada
- 1.3. Mexico
-
2. South America
- 2.1. Brazil
- 2.2. Argentina
- 2.3. Rest of South America
-
3. Europe
- 3.1. United Kingdom
- 3.2. Germany
- 3.3. France
- 3.4. Italy
- 3.5. Spain
- 3.6. Russia
- 3.7. Benelux
- 3.8. Nordics
- 3.9. Rest of Europe
-
4. Middle East & Africa
- 4.1. Turkey
- 4.2. Israel
- 4.3. GCC
- 4.4. North Africa
- 4.5. South Africa
- 4.6. Rest of Middle East & Africa
-
5. Asia Pacific
- 5.1. China
- 5.2. India
- 5.3. Japan
- 5.4. South Korea
- 5.5. ASEAN
- 5.6. Oceania
- 5.7. Rest of Asia Pacific
Product Packaging Design Regional Market Share
Geographic Coverage of Product Packaging Design
Product Packaging Design REPORT HIGHLIGHTS
| Aspects | Details |
|---|---|
| Study Period | 2020-2034 |
| Base Year | 2025 |
| Estimated Year | 2026 |
| Forecast Period | 2026-2034 |
| Historical Period | 2020-2025 |
| Growth Rate | CAGR of 3.55% from 2020-2034 |
| Segmentation |
|
Table of Contents
- 1. Introduction
- 1.1. Research Scope
- 1.2. Market Segmentation
- 1.3. Research Objective
- 1.4. Definitions and Assumptions
- 2. Executive Summary
- 2.1. Market Snapshot
- 3. Market Dynamics
- 3.1. Market Drivers
- 3.2. Market Restrains
- 3.3. Market Trends
- 3.4. Market Opportunities
- 4. Market Factor Analysis
- 4.1. Porters Five Forces
- 4.1.1. Bargaining Power of Suppliers
- 4.1.2. Bargaining Power of Buyers
- 4.1.3. Threat of New Entrants
- 4.1.4. Threat of Substitutes
- 4.1.5. Competitive Rivalry
- 4.2. PESTEL analysis
- 4.3. BCG Analysis
- 4.3.1. Stars (High Growth, High Market Share)
- 4.3.2. Cash Cows (Low Growth, High Market Share)
- 4.3.3. Question Mark (High Growth, Low Market Share)
- 4.3.4. Dogs (Low Growth, Low Market Share)
- 4.4. Ansoff Matrix Analysis
- 4.5. Supply Chain Analysis
- 4.6. Regulatory Landscape
- 4.7. Current Market Potential and Opportunity Assessment (TAM–SAM–SOM Framework)
- 4.8. NRP Analyst Note
- 4.1. Porters Five Forces
- 5. Market Analysis, Insights and Forecast 2021-2033
- 5.1. Market Analysis, Insights and Forecast - by Application
- 5.1.1. Large Companies
- 5.1.2. SMEs
- 5.2. Market Analysis, Insights and Forecast - by Types
- 5.2.1. Food & Beverage Packaging Design
- 5.2.2. Cosmetics Packaging Design
- 5.2.3. Liquor & Tobacco Packaging Design
- 5.2.4. Others Packaging Design
- 5.3. Market Analysis, Insights and Forecast - by Region
- 5.3.1. North America
- 5.3.2. South America
- 5.3.3. Europe
- 5.3.4. Middle East & Africa
- 5.3.5. Asia Pacific
- 5.1. Market Analysis, Insights and Forecast - by Application
- 6. Global Product Packaging Design Analysis, Insights and Forecast, 2021-2033
- 6.1. Market Analysis, Insights and Forecast - by Application
- 6.1.1. Large Companies
- 6.1.2. SMEs
- 6.2. Market Analysis, Insights and Forecast - by Types
- 6.2.1. Food & Beverage Packaging Design
- 6.2.2. Cosmetics Packaging Design
- 6.2.3. Liquor & Tobacco Packaging Design
- 6.2.4. Others Packaging Design
- 6.1. Market Analysis, Insights and Forecast - by Application
- 7. North America Product Packaging Design Analysis, Insights and Forecast, 2020-2032
- 7.1. Market Analysis, Insights and Forecast - by Application
- 7.1.1. Large Companies
- 7.1.2. SMEs
- 7.2. Market Analysis, Insights and Forecast - by Types
- 7.2.1. Food & Beverage Packaging Design
- 7.2.2. Cosmetics Packaging Design
- 7.2.3. Liquor & Tobacco Packaging Design
- 7.2.4. Others Packaging Design
- 7.1. Market Analysis, Insights and Forecast - by Application
- 8. South America Product Packaging Design Analysis, Insights and Forecast, 2020-2032
- 8.1. Market Analysis, Insights and Forecast - by Application
- 8.1.1. Large Companies
- 8.1.2. SMEs
- 8.2. Market Analysis, Insights and Forecast - by Types
- 8.2.1. Food & Beverage Packaging Design
- 8.2.2. Cosmetics Packaging Design
- 8.2.3. Liquor & Tobacco Packaging Design
- 8.2.4. Others Packaging Design
- 8.1. Market Analysis, Insights and Forecast - by Application
- 9. Europe Product Packaging Design Analysis, Insights and Forecast, 2020-2032
- 9.1. Market Analysis, Insights and Forecast - by Application
- 9.1.1. Large Companies
- 9.1.2. SMEs
- 9.2. Market Analysis, Insights and Forecast - by Types
- 9.2.1. Food & Beverage Packaging Design
- 9.2.2. Cosmetics Packaging Design
- 9.2.3. Liquor & Tobacco Packaging Design
- 9.2.4. Others Packaging Design
- 9.1. Market Analysis, Insights and Forecast - by Application
- 10. Middle East & Africa Product Packaging Design Analysis, Insights and Forecast, 2020-2032
- 10.1. Market Analysis, Insights and Forecast - by Application
- 10.1.1. Large Companies
- 10.1.2. SMEs
- 10.2. Market Analysis, Insights and Forecast - by Types
- 10.2.1. Food & Beverage Packaging Design
- 10.2.2. Cosmetics Packaging Design
- 10.2.3. Liquor & Tobacco Packaging Design
- 10.2.4. Others Packaging Design
- 10.1. Market Analysis, Insights and Forecast - by Application
- 11. Asia Pacific Product Packaging Design Analysis, Insights and Forecast, 2020-2032
- 11.1. Market Analysis, Insights and Forecast - by Application
- 11.1.1. Large Companies
- 11.1.2. SMEs
- 11.2. Market Analysis, Insights and Forecast - by Types
- 11.2.1. Food & Beverage Packaging Design
- 11.2.2. Cosmetics Packaging Design
- 11.2.3. Liquor & Tobacco Packaging Design
- 11.2.4. Others Packaging Design
- 11.1. Market Analysis, Insights and Forecast - by Application
- 12. Competitive Analysis
- 12.1. Company Profiles
- 12.1.1 Ruckus Marketing
- 12.1.1.1. Company Overview
- 12.1.1.2. Products
- 12.1.1.3. Company Financials
- 12.1.1.4. SWOT Analysis
- 12.1.2 Mucca
- 12.1.2.1. Company Overview
- 12.1.2.2. Products
- 12.1.2.3. Company Financials
- 12.1.2.4. SWOT Analysis
- 12.1.3 La Visual
- 12.1.3.1. Company Overview
- 12.1.3.2. Products
- 12.1.3.3. Company Financials
- 12.1.3.4. SWOT Analysis
- 12.1.4 DEI Creative
- 12.1.4.1. Company Overview
- 12.1.4.2. Products
- 12.1.4.3. Company Financials
- 12.1.4.4. SWOT Analysis
- 12.1.5 Murmur Creative
- 12.1.5.1. Company Overview
- 12.1.5.2. Products
- 12.1.5.3. Company Financials
- 12.1.5.4. SWOT Analysis
- 12.1.6 Turner Duckworth
- 12.1.6.1. Company Overview
- 12.1.6.2. Products
- 12.1.6.3. Company Financials
- 12.1.6.4. SWOT Analysis
- 12.1.7 Pulp+Wire
- 12.1.7.1. Company Overview
- 12.1.7.2. Products
- 12.1.7.3. Company Financials
- 12.1.7.4. SWOT Analysis
- 12.1.8 99designs
- 12.1.8.1. Company Overview
- 12.1.8.2. Products
- 12.1.8.3. Company Financials
- 12.1.8.4. SWOT Analysis
- 12.1.9 Bulletproof
- 12.1.9.1. Company Overview
- 12.1.9.2. Products
- 12.1.9.3. Company Financials
- 12.1.9.4. SWOT Analysis
- 12.1.10 Chase Design Group
- 12.1.10.1. Company Overview
- 12.1.10.2. Products
- 12.1.10.3. Company Financials
- 12.1.10.4. SWOT Analysis
- 12.1.11 Force Majeure
- 12.1.11.1. Company Overview
- 12.1.11.2. Products
- 12.1.11.3. Company Financials
- 12.1.11.4. SWOT Analysis
- 12.1.12 Moxie Sozo
- 12.1.12.1. Company Overview
- 12.1.12.2. Products
- 12.1.12.3. Company Financials
- 12.1.12.4. SWOT Analysis
- 12.1.13 Ultra Creative
- 12.1.13.1. Company Overview
- 12.1.13.2. Products
- 12.1.13.3. Company Financials
- 12.1.13.4. SWOT Analysis
- 12.1.14 Hunter Design
- 12.1.14.1. Company Overview
- 12.1.14.2. Products
- 12.1.14.3. Company Financials
- 12.1.14.4. SWOT Analysis
- 12.1.15 SmashBrand
- 12.1.15.1. Company Overview
- 12.1.15.2. Products
- 12.1.15.3. Company Financials
- 12.1.15.4. SWOT Analysis
- 12.1.16 SmashBrand
- 12.1.16.1. Company Overview
- 12.1.16.2. Products
- 12.1.16.3. Company Financials
- 12.1.16.4. SWOT Analysis
- 12.1.17 Depot Creative
- 12.1.17.1. Company Overview
- 12.1.17.2. Products
- 12.1.17.3. Company Financials
- 12.1.17.4. SWOT Analysis
- 12.1.18 Column
- 12.1.18.1. Company Overview
- 12.1.18.2. Products
- 12.1.18.3. Company Financials
- 12.1.18.4. SWOT Analysis
- 12.1.19 DePersico Creative
- 12.1.19.1. Company Overview
- 12.1.19.2. Products
- 12.1.19.3. Company Financials
- 12.1.19.4. SWOT Analysis
- 12.1.20 Slice Design
- 12.1.20.1. Company Overview
- 12.1.20.2. Products
- 12.1.20.3. Company Financials
- 12.1.20.4. SWOT Analysis
- 12.1.1 Ruckus Marketing
- 12.2. Market Entropy
- 12.2.1 Company's Key Areas Served
- 12.2.2 Recent Developments
- 12.3. Company Market Share Analysis 2025
- 12.3.1 Top 5 Companies Market Share Analysis
- 12.3.2 Top 3 Companies Market Share Analysis
- 12.4. List of Potential Customers
- 13. Research Methodology
List of Figures
- Figure 1: Global Product Packaging Design Revenue Breakdown (undefined, %) by Region 2025 & 2033
- Figure 2: North America Product Packaging Design Revenue (undefined), by Application 2025 & 2033
- Figure 3: North America Product Packaging Design Revenue Share (%), by Application 2025 & 2033
- Figure 4: North America Product Packaging Design Revenue (undefined), by Types 2025 & 2033
- Figure 5: North America Product Packaging Design Revenue Share (%), by Types 2025 & 2033
- Figure 6: North America Product Packaging Design Revenue (undefined), by Country 2025 & 2033
- Figure 7: North America Product Packaging Design Revenue Share (%), by Country 2025 & 2033
- Figure 8: South America Product Packaging Design Revenue (undefined), by Application 2025 & 2033
- Figure 9: South America Product Packaging Design Revenue Share (%), by Application 2025 & 2033
- Figure 10: South America Product Packaging Design Revenue (undefined), by Types 2025 & 2033
- Figure 11: South America Product Packaging Design Revenue Share (%), by Types 2025 & 2033
- Figure 12: South America Product Packaging Design Revenue (undefined), by Country 2025 & 2033
- Figure 13: South America Product Packaging Design Revenue Share (%), by Country 2025 & 2033
- Figure 14: Europe Product Packaging Design Revenue (undefined), by Application 2025 & 2033
- Figure 15: Europe Product Packaging Design Revenue Share (%), by Application 2025 & 2033
- Figure 16: Europe Product Packaging Design Revenue (undefined), by Types 2025 & 2033
- Figure 17: Europe Product Packaging Design Revenue Share (%), by Types 2025 & 2033
- Figure 18: Europe Product Packaging Design Revenue (undefined), by Country 2025 & 2033
- Figure 19: Europe Product Packaging Design Revenue Share (%), by Country 2025 & 2033
- Figure 20: Middle East & Africa Product Packaging Design Revenue (undefined), by Application 2025 & 2033
- Figure 21: Middle East & Africa Product Packaging Design Revenue Share (%), by Application 2025 & 2033
- Figure 22: Middle East & Africa Product Packaging Design Revenue (undefined), by Types 2025 & 2033
- Figure 23: Middle East & Africa Product Packaging Design Revenue Share (%), by Types 2025 & 2033
- Figure 24: Middle East & Africa Product Packaging Design Revenue (undefined), by Country 2025 & 2033
- Figure 25: Middle East & Africa Product Packaging Design Revenue Share (%), by Country 2025 & 2033
- Figure 26: Asia Pacific Product Packaging Design Revenue (undefined), by Application 2025 & 2033
- Figure 27: Asia Pacific Product Packaging Design Revenue Share (%), by Application 2025 & 2033
- Figure 28: Asia Pacific Product Packaging Design Revenue (undefined), by Types 2025 & 2033
- Figure 29: Asia Pacific Product Packaging Design Revenue Share (%), by Types 2025 & 2033
- Figure 30: Asia Pacific Product Packaging Design Revenue (undefined), by Country 2025 & 2033
- Figure 31: Asia Pacific Product Packaging Design Revenue Share (%), by Country 2025 & 2033
List of Tables
- Table 1: Global Product Packaging Design Revenue undefined Forecast, by Application 2020 & 2033
- Table 2: Global Product Packaging Design Revenue undefined Forecast, by Types 2020 & 2033
- Table 3: Global Product Packaging Design Revenue undefined Forecast, by Region 2020 & 2033
- Table 4: Global Product Packaging Design Revenue undefined Forecast, by Application 2020 & 2033
- Table 5: Global Product Packaging Design Revenue undefined Forecast, by Types 2020 & 2033
- Table 6: Global Product Packaging Design Revenue undefined Forecast, by Country 2020 & 2033
- Table 7: United States Product Packaging Design Revenue (undefined) Forecast, by Application 2020 & 2033
- Table 8: Canada Product Packaging Design Revenue (undefined) Forecast, by Application 2020 & 2033
- Table 9: Mexico Product Packaging Design Revenue (undefined) Forecast, by Application 2020 & 2033
- Table 10: Global Product Packaging Design Revenue undefined Forecast, by Application 2020 & 2033
- Table 11: Global Product Packaging Design Revenue undefined Forecast, by Types 2020 & 2033
- Table 12: Global Product Packaging Design Revenue undefined Forecast, by Country 2020 & 2033
- Table 13: Brazil Product Packaging Design Revenue (undefined) Forecast, by Application 2020 & 2033
- Table 14: Argentina Product Packaging Design Revenue (undefined) Forecast, by Application 2020 & 2033
- Table 15: Rest of South America Product Packaging Design Revenue (undefined) Forecast, by Application 2020 & 2033
- Table 16: Global Product Packaging Design Revenue undefined Forecast, by Application 2020 & 2033
- Table 17: Global Product Packaging Design Revenue undefined Forecast, by Types 2020 & 2033
- Table 18: Global Product Packaging Design Revenue undefined Forecast, by Country 2020 & 2033
- Table 19: United Kingdom Product Packaging Design Revenue (undefined) Forecast, by Application 2020 & 2033
- Table 20: Germany Product Packaging Design Revenue (undefined) Forecast, by Application 2020 & 2033
- Table 21: France Product Packaging Design Revenue (undefined) Forecast, by Application 2020 & 2033
- Table 22: Italy Product Packaging Design Revenue (undefined) Forecast, by Application 2020 & 2033
- Table 23: Spain Product Packaging Design Revenue (undefined) Forecast, by Application 2020 & 2033
- Table 24: Russia Product Packaging Design Revenue (undefined) Forecast, by Application 2020 & 2033
- Table 25: Benelux Product Packaging Design Revenue (undefined) Forecast, by Application 2020 & 2033
- Table 26: Nordics Product Packaging Design Revenue (undefined) Forecast, by Application 2020 & 2033
- Table 27: Rest of Europe Product Packaging Design Revenue (undefined) Forecast, by Application 2020 & 2033
- Table 28: Global Product Packaging Design Revenue undefined Forecast, by Application 2020 & 2033
- Table 29: Global Product Packaging Design Revenue undefined Forecast, by Types 2020 & 2033
- Table 30: Global Product Packaging Design Revenue undefined Forecast, by Country 2020 & 2033
- Table 31: Turkey Product Packaging Design Revenue (undefined) Forecast, by Application 2020 & 2033
- Table 32: Israel Product Packaging Design Revenue (undefined) Forecast, by Application 2020 & 2033
- Table 33: GCC Product Packaging Design Revenue (undefined) Forecast, by Application 2020 & 2033
- Table 34: North Africa Product Packaging Design Revenue (undefined) Forecast, by Application 2020 & 2033
- Table 35: South Africa Product Packaging Design Revenue (undefined) Forecast, by Application 2020 & 2033
- Table 36: Rest of Middle East & Africa Product Packaging Design Revenue (undefined) Forecast, by Application 2020 & 2033
- Table 37: Global Product Packaging Design Revenue undefined Forecast, by Application 2020 & 2033
- Table 38: Global Product Packaging Design Revenue undefined Forecast, by Types 2020 & 2033
- Table 39: Global Product Packaging Design Revenue undefined Forecast, by Country 2020 & 2033
- Table 40: China Product Packaging Design Revenue (undefined) Forecast, by Application 2020 & 2033
- Table 41: India Product Packaging Design Revenue (undefined) Forecast, by Application 2020 & 2033
- Table 42: Japan Product Packaging Design Revenue (undefined) Forecast, by Application 2020 & 2033
- Table 43: South Korea Product Packaging Design Revenue (undefined) Forecast, by Application 2020 & 2033
- Table 44: ASEAN Product Packaging Design Revenue (undefined) Forecast, by Application 2020 & 2033
- Table 45: Oceania Product Packaging Design Revenue (undefined) Forecast, by Application 2020 & 2033
- Table 46: Rest of Asia Pacific Product Packaging Design Revenue (undefined) Forecast, by Application 2020 & 2033
Frequently Asked Questions
1. What is the projected Compound Annual Growth Rate (CAGR) of the Product Packaging Design?
The projected CAGR is approximately 3.55%.
2. Which companies are prominent players in the Product Packaging Design?
Key companies in the market include Ruckus Marketing, Mucca, La Visual, DEI Creative, Murmur Creative, Turner Duckworth, Pulp+Wire, 99designs, Bulletproof, Chase Design Group, Force Majeure, Moxie Sozo, Ultra Creative, Hunter Design, SmashBrand, SmashBrand, Depot Creative, Column, DePersico Creative, Slice Design.
3. What are the main segments of the Product Packaging Design?
The market segments include Application, Types.
4. Can you provide details about the market size?
The market size is estimated to be USD XXX N/A as of 2022.
5. What are some drivers contributing to market growth?
N/A
6. What are the notable trends driving market growth?
N/A
7. Are there any restraints impacting market growth?
N/A
8. Can you provide examples of recent developments in the market?
N/A
9. What pricing options are available for accessing the report?
Pricing options include single-user, multi-user, and enterprise licenses priced at USD 4900.00, USD 7350.00, and USD 9800.00 respectively.
10. Is the market size provided in terms of value or volume?
The market size is provided in terms of value, measured in N/A.
11. Are there any specific market keywords associated with the report?
Yes, the market keyword associated with the report is "Product Packaging Design," which aids in identifying and referencing the specific market segment covered.
12. How do I determine which pricing option suits my needs best?
The pricing options vary based on user requirements and access needs. Individual users may opt for single-user licenses, while businesses requiring broader access may choose multi-user or enterprise licenses for cost-effective access to the report.
13. Are there any additional resources or data provided in the Product Packaging Design report?
While the report offers comprehensive insights, it's advisable to review the specific contents or supplementary materials provided to ascertain if additional resources or data are available.
14. How can I stay updated on further developments or reports in the Product Packaging Design?
To stay informed about further developments, trends, and reports in the Product Packaging Design, consider subscribing to industry newsletters, following relevant companies and organizations, or regularly checking reputable industry news sources and publications.
Methodology
Step 1 - Identification of Relevant Samples Size from Population Database


Step 2 - Approaches for Defining Global Market Size (Value, Volume* & Price*)

Note*: In applicable scenarios
Step 3 - Data Sources
Primary Research
- Web Analytics
- Survey Reports
- Research Institute
- Latest Research Reports
- Opinion Leaders
Secondary Research
- Annual Reports
- White Paper
- Latest Press Release
- Industry Association
- Paid Database
- Investor Presentations

Step 4 - Data Triangulation
Involves using different sources of information in order to increase the validity of a study
These sources are likely to be stakeholders in a program - participants, other researchers, program staff, other community members, and so on.
Then we put all data in single framework & apply various statistical tools to find out the dynamic on the market.
During the analysis stage, feedback from the stakeholder groups would be compared to determine areas of agreement as well as areas of divergence