

Key Insights
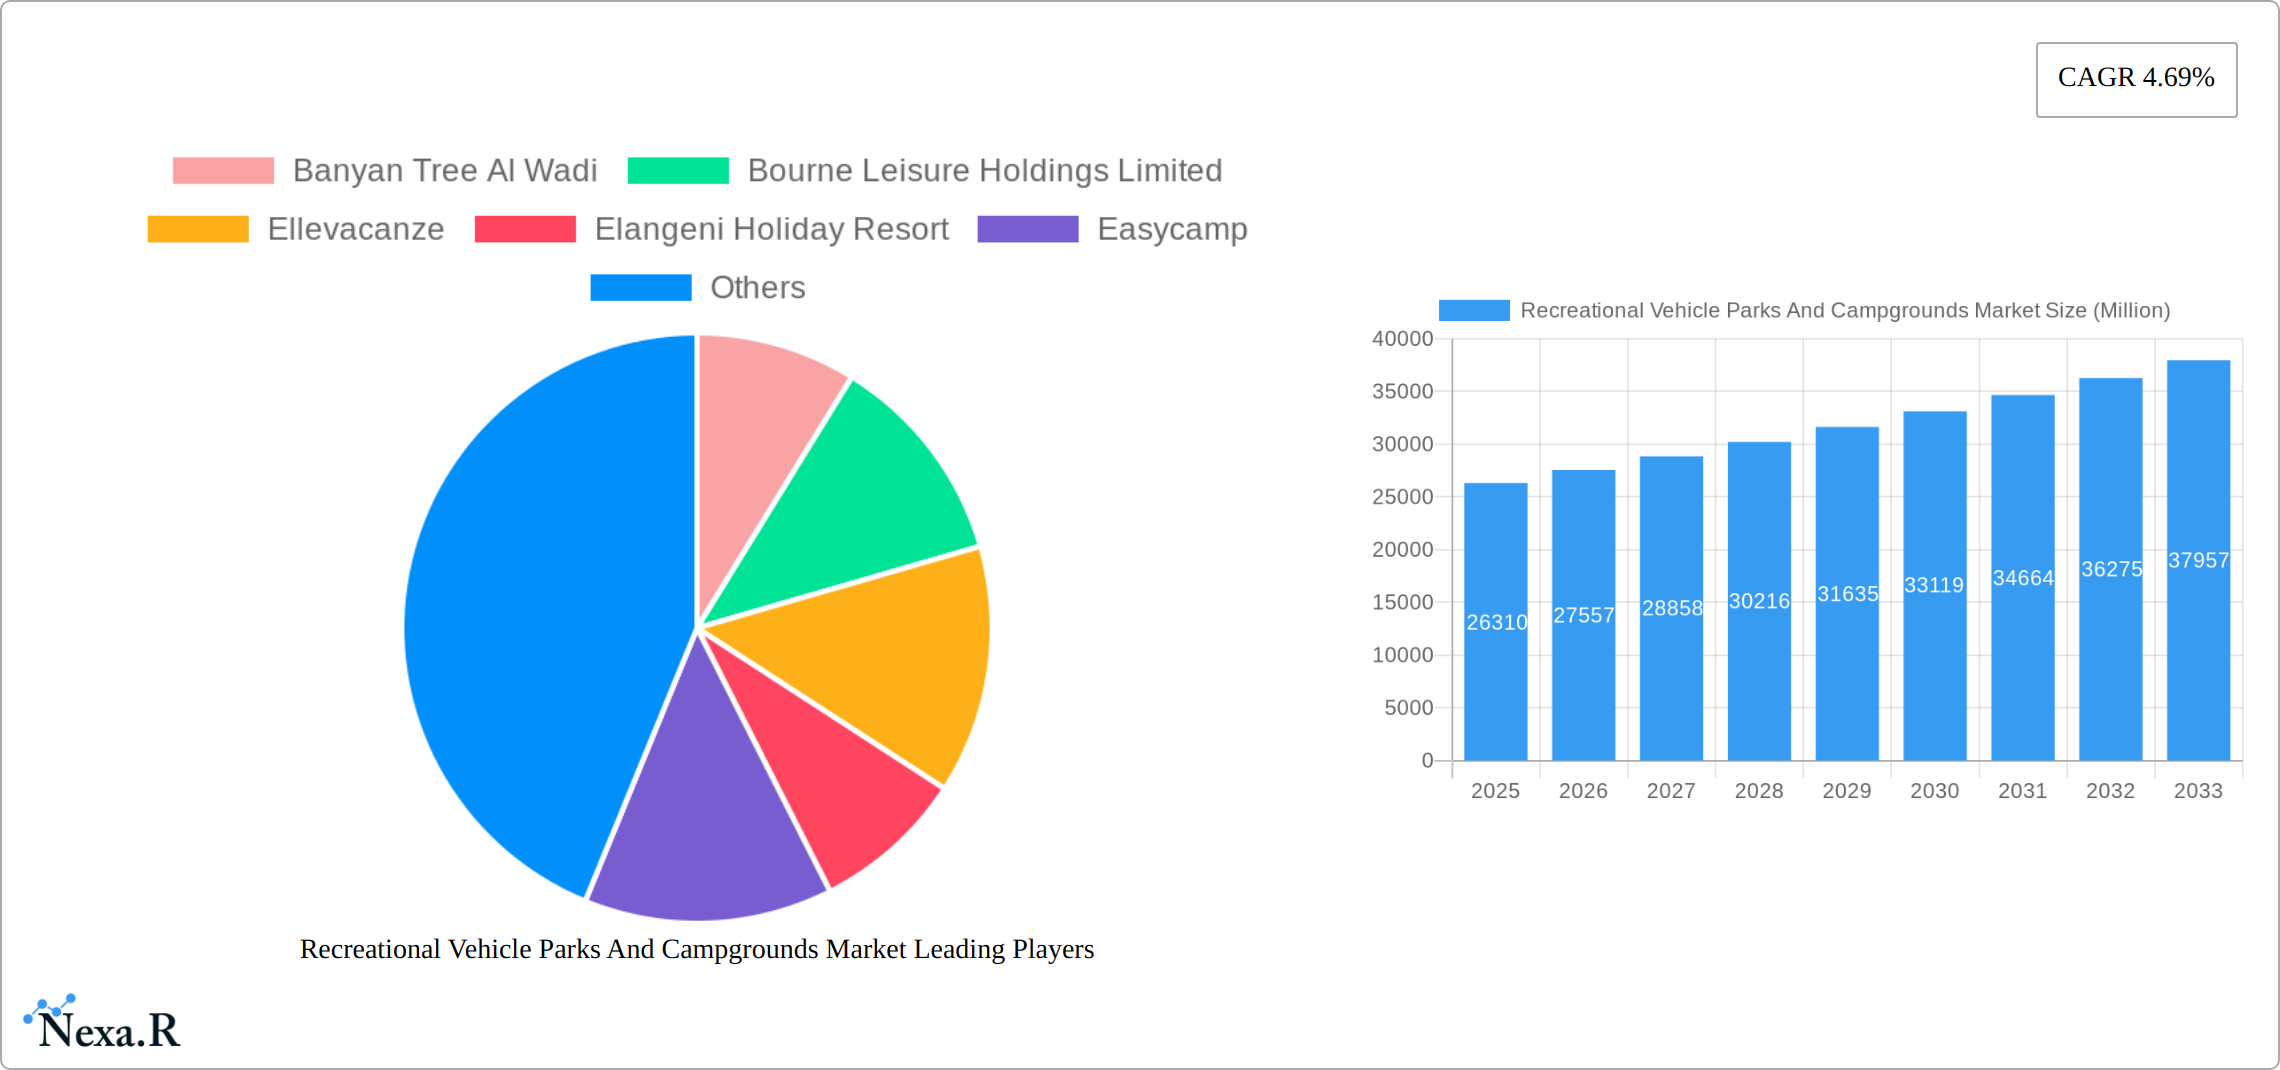
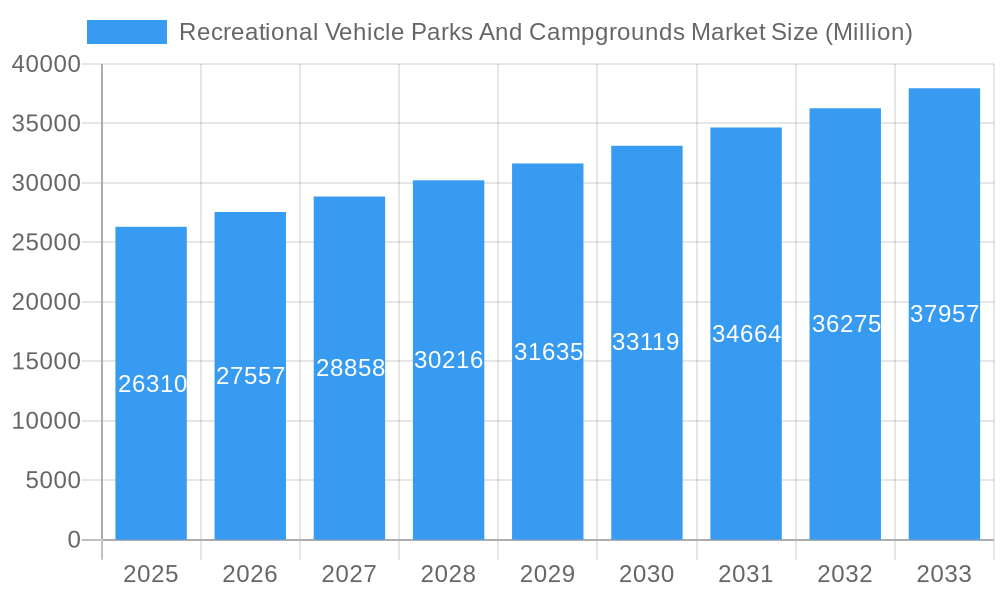
The Recreational Vehicle (RV) Parks and Campgrounds market, valued at $26.31 billion in 2025, is projected to experience robust growth, driven by a rising preference for outdoor recreation and experiential travel. A Compound Annual Growth Rate (CAGR) of 4.69% from 2025 to 2033 indicates a significant expansion of this market, fueled by several key factors. Increased disposable incomes, particularly among millennials and Gen X, are contributing to higher spending on leisure activities, including RV camping. The growing popularity of glamping (glamorous camping), offering luxurious amenities within a natural setting, further stimulates market demand. Technological advancements, such as improved RV technology and online booking platforms, enhance convenience and accessibility, driving market growth. The market is segmented by vehicle type (motorhomes, trailers), price point (standard, luxury), and end-use (individual, fleet owners). The luxury segment is expected to witness faster growth due to increasing demand for upscale camping experiences. Geographical expansion is also contributing, with North America and Europe currently holding significant market shares, while Asia-Pacific is poised for substantial growth in the coming years. However, potential restraints include seasonality, environmental concerns, and the impact of economic downturns on discretionary spending. Nevertheless, the overall outlook remains positive, with the RV parks and campgrounds market expected to continue its upward trajectory in the forecast period.
Recreational Vehicle Parks And Campgrounds Market Market Size (In Billion)
The competitive landscape is dynamic, with a mix of established players and emerging businesses. Large operators manage multiple RV parks and campgrounds, offering various amenities and services. Smaller, independent businesses focus on niche markets, catering to specific demographics or offering unique experiences. The industry's growth necessitates strategic partnerships, innovative offerings, and sustainable practices to meet increasing demand while mitigating environmental impact. This includes investments in infrastructure development, technological integration, and responsible tourism initiatives. The industry is also witnessing a shift towards personalized experiences, with customized packages and tailored services gaining prominence. This trend, coupled with the expanding adoption of digital marketing and online booking platforms, is reshaping the consumer journey and driving market expansion. The increasing focus on safety and security within RV parks and campgrounds further enhances consumer confidence and boosts market growth.
Recreational Vehicle Parks And Campgrounds Market Company Market Share
Recreational Vehicle Parks and Campgrounds Market: A Comprehensive Report (2019-2033)
This comprehensive report provides an in-depth analysis of the Recreational Vehicle (RV) Parks and Campgrounds market, encompassing market dynamics, growth trends, regional dominance, product landscape, key players, and future outlook. The study period covers 2019-2033, with 2025 as the base and estimated year. This report is invaluable for industry professionals, investors, and anyone seeking to understand this dynamic market segment. The parent market is the tourism and hospitality industry, while the child market includes RV rentals, camping gear, and related services.
Recreational Vehicle Parks And Campgrounds Market Market Dynamics & Structure
The RV Parks and Campgrounds market is characterized by a dynamic interplay of forces, exhibiting a moderately fragmented structure. This landscape is shaped by a blend of established national operators and a substantial number of agile, independent businesses. Market concentration is significantly influenced by strategic location, the breadth and depth of service portfolios, and the strength of brand equity. Key growth engines include relentless technological innovation, particularly evident in the development of sophisticated reservation systems, the integration of advanced park amenities such as high-speed Wi-Fi and electric vehicle charging infrastructure, and a growing emphasis on sustainable operational practices. Furthermore, the market is meticulously navigated through stringent regulatory frameworks governing environmental stewardship and safety standards, which directly impact operational expenditures and strategic investment decisions. The competitive arena is further diversified by the presence of viable alternatives like vacation rental properties and traditional lodging options, each vying for market share. A notable demographic shift is underway, with younger generations increasingly seeking immersive outdoor experiences, and a burgeoning interest in unique, comfort-driven accommodations such as glamping. The mergers and acquisitions (M&A) landscape reflects this evolution, witnessing consistent activity as larger entities strategically integrate smaller parks to bolster their geographic footprint and enhance their service offerings.
- Market Concentration: Moderately fragmented, with approximately 35-45% market share held by the top 5 players (estimated 2024). This indicates a healthy balance between large-scale operators and independent ventures.
- Technological Innovation: A robust focus on digitalization is transforming operations through advanced reservation platforms and park management software. Simultaneously, there's a significant investment in sustainable practices (e.g., renewable energy, waste management) and enhanced guest amenities, including ubiquitous high-speed Wi-Fi and EV charging stations.
- Regulatory Framework: Evolving environmental regulations and increasingly stringent safety standards necessitate continuous adaptation and investment, influencing operational models and capital allocation.
- Competitive Substitutes: The market actively competes with vacation rentals and traditional hotels, pushing RV park operators to differentiate through unique experiences and superior amenities.
- End-User Demographics: A significant growth driver is the influx of younger demographics (Millennials and Gen Z) seeking authentic outdoor adventures. The demand for "glamping" and other curated, comfortable camping experiences is also on a steep upward trajectory.
- M&A Trends: Approximately 20-30 significant M&A deals were recorded in the last 5 years, with a strong strategic emphasis on acquiring properties in high-demand tourist destinations and expanding into underserved geographic regions.
Recreational Vehicle Parks And Campgrounds Market Growth Trends & Insights
The RV Parks and Campgrounds market experienced robust growth during the historical period (2019-2024), driven by increased leisure travel, rising disposable incomes, and the growing popularity of outdoor recreation. The market size reached xx Million in 2024, and is projected to reach xx Million by 2033, exhibiting a CAGR of xx% during the forecast period (2025-2033). This growth is fuelled by technological disruptions, including online booking platforms and improved park amenities, as well as shifts in consumer behaviour towards experiential travel. Increased demand for luxury RV parks and glamping experiences is also significantly contributing to market expansion. The market penetration rate for RV Parks and Campgrounds in the overall tourism sector is estimated at xx% in 2024, anticipated to increase to xx% by 2033.
Dominant Regions, Countries, or Segments in Recreational Vehicle Parks And Campgrounds Market
North America currently dominates the RV Parks and Campgrounds market, driven by high RV ownership rates and a well-established infrastructure for RV travel. The US specifically shows significant market share, with strong demand in states like California, Florida, and Texas. Europe also presents a substantial market, with growth driven by increasing interest in sustainable tourism and outdoor activities. Within market segmentation:
- By Vehicle Type: Motorhomes hold a larger market share compared to trailers, primarily due to greater convenience and self-sufficiency.
- By Price: The luxury segment is experiencing faster growth compared to the standard segment, reflecting increasing consumer spending on premium travel experiences.
- By End-Use: Individual users constitute the majority of the market, although fleet owners (rental companies, etc.) contribute a significant portion.
Key Drivers:
- Strong infrastructure and established RV culture in North America.
- Rising disposable incomes and increasing leisure travel.
- Growing popularity of outdoor recreation and experiential travel.
- Government initiatives promoting sustainable tourism.
Recreational Vehicle Parks And Campgrounds Market Product Landscape
The RV Parks and Campgrounds market offers a diverse and evolving spectrum of products and services, ranging from fundamental, well-maintained campsites to opulent RV resorts boasting an extensive array of premium amenities. The current wave of innovation is keenly focused on elevating the guest experience through tangible improvements and novel offerings. This includes ubiquitous, high-speed Wi-Fi connectivity, the strategic deployment of electric vehicle (EV) charging stations to cater to the growing EV market, and the expansion of unique, comfort-oriented "glamping" options that blend the allure of the outdoors with modern luxury. Technological advancements are at the forefront, with sophisticated reservation systems and integrated park management software streamlining operational workflows, enhancing efficiency, and significantly improving the overall customer service experience. The critical selling propositions for parks in this competitive landscape are a combination of prime location, a comprehensive suite of desirable amenities, and the delivery of a memorable, enriching overall guest experience.
Key Drivers, Barriers & Challenges in Recreational Vehicle Parks And Campgrounds Market
Key Drivers:
- Rising disposable incomes and increased leisure time fuel demand for outdoor recreational activities.
- Growing popularity of sustainable and eco-friendly tourism options.
- Technological advancements that enhance the camping experience.
Key Challenges:
- Land scarcity and zoning regulations limit expansion opportunities.
- Seasonal demand fluctuations impact profitability.
- Intense competition from alternative accommodation options.
- Supply chain disruptions impacting the availability of materials and equipment. (estimated impact: xx% reduction in new park developments in 2024)
Emerging Opportunities in Recreational Vehicle Parks And Campgrounds Market
- Glamping: The rising popularity of luxury camping experiences presents significant growth opportunities.
- Sustainable Tourism: Focus on eco-friendly practices appeals to environmentally conscious travelers.
- Technological Integration: Smart park management systems and innovative amenities enhance the guest experience.
- International Expansion: Untapped markets in developing countries offer significant potential.
Growth Accelerators in the Recreational Vehicle Parks And Campgrounds Market Industry
The Recreational Vehicle Parks and Campgrounds industry is experiencing robust growth propelled by several key accelerators. Foremost among these are technological advancements that are revolutionizing operations and guest experiences, including the implementation of smart park management systems, cutting-edge reservation and booking platforms, and the integration of sustainable infrastructure solutions that appeal to eco-conscious travelers. Strategic partnerships and collaborations are proving instrumental, with RV parks forging alliances with complementary businesses such as RV rental companies, local tour operators, and adventure activity providers. These partnerships broaden the scope of services offered, creating more comprehensive and attractive travel packages for visitors. Furthermore, expansion into emerging markets that are experiencing a surge in tourism and a rising middle class presents substantial untapped potential for market penetration and growth. The increasing interest in outdoor recreation, driven by a desire for connection with nature and experiential travel, continues to fuel demand across all segments of the market.
Key Players Shaping the Recreational Vehicle Parks And Campgrounds Market Market
- Equity Lifestyle Properties, Inc.
- Sun Communities, Inc.
- Boomerang Parks
- Discovery Parks Private Limited
- Bourne Leisure Holdings Limited
- Top Parks
- Kampgrounds of America, Inc. (KOA)
- The Camping and Caravanning Club
- Hyatt Vacation Ownership
- Outdoorsy
Notable Milestones in Recreational Vehicle Parks And Campgrounds Market Sector
- December 2022: Alaskan Anglers RV Park unveils the largest full-service RV park in Ninilchik, Alaska.
- January 2022: Ford and Erwin Hymer Group (EHG) establish a framework agreement for the delivery of customer-ready motorhomes.
In-Depth Recreational Vehicle Parks And Campgrounds Market Market Outlook
The Recreational Vehicle Parks and Campgrounds market is on a trajectory for sustained and significant growth in the foreseeable future. This expansion will be primarily fueled by the evolving preferences of consumers, who are increasingly prioritizing outdoor experiences and flexible travel options. Technological advancements will continue to play a pivotal role, driving operational efficiencies and enhancing the guest journey through innovative digital solutions and smart park infrastructure. The growing global consciousness around sustainability will also shape the market, with an emphasis on eco-friendly practices and responsible tourism becoming a key differentiator and a critical factor for long-term success. Strategic partnerships and collaborations are expected to intensify, creating more integrated and appealing travel ecosystems. Furthermore, expansion into new and emerging geographic regions with burgeoning tourism sectors presents substantial opportunities for market leaders to capture new customer segments. The ongoing trend of market consolidation is anticipated to continue, with larger, well-capitalized operators strategically acquiring smaller, independent parks to achieve economies of scale, broaden their geographic reach, and strengthen their brand presence. Ultimately, the market's ability to adapt to changing consumer demands, embrace technological innovation, and prioritize sustainable operations will be paramount in maximizing growth potential and securing a competitive advantage in the years ahead.
Recreational Vehicle Parks And Campgrounds Market Segmentation
-
1. Vehicle Type
-
1.1. Motorhomes
- 1.1.1. Class A
- 1.1.2. Class B
- 1.1.3. Class C
- 1.1.4. Rockstar Motorhomes
-
1.2. Trailers
- 1.2.1. 5th Wheel Trailers
- 1.2.2. Travel Trailers
- 1.2.3. Tent Trailer
- 1.2.4. Retro Trailer
-
1.1. Motorhomes
-
2. Price
- 2.1. Standard
- 2.2. Luxury
-
3. End-Use
- 3.1. Individual
- 3.2. Fleet Owners
Recreational Vehicle Parks And Campgrounds Market Segmentation By Geography
- 1. North America
- 2. Europe
- 3. Asia Pacific
- 4. Latin America
- 5. Middle East
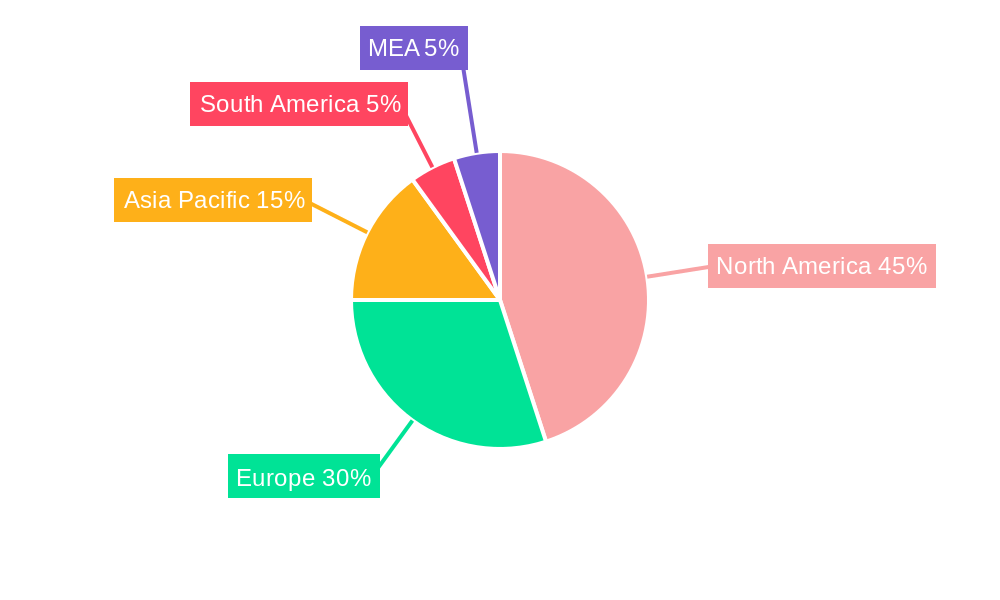
Recreational Vehicle Parks And Campgrounds Market Regional Market Share
Geographic Coverage of Recreational Vehicle Parks And Campgrounds Market
Recreational Vehicle Parks And Campgrounds Market REPORT HIGHLIGHTS
| Aspects | Details |
|---|---|
| Study Period | 2020-2034 |
| Base Year | 2025 |
| Estimated Year | 2026 |
| Forecast Period | 2026-2034 |
| Historical Period | 2020-2025 |
| Growth Rate | CAGR of 4.69% from 2020-2034 |
| Segmentation |
|
Table of Contents
- 1. Introduction
- 1.1. Research Scope
- 1.2. Market Segmentation
- 1.3. Research Objective
- 1.4. Definitions and Assumptions
- 2. Executive Summary
- 2.1. Market Snapshot
- 3. Market Dynamics
- 3.1. Market Drivers
- 3.2. Market Restrains
- 3.3. Market Trends
- 3.4. Market Opportunities
- 4. Market Factor Analysis
- 4.1. Porters Five Forces
- 4.1.1. Bargaining Power of Suppliers
- 4.1.2. Bargaining Power of Buyers
- 4.1.3. Threat of New Entrants
- 4.1.4. Threat of Substitutes
- 4.1.5. Competitive Rivalry
- 4.2. PESTEL analysis
- 4.3. BCG Analysis
- 4.3.1. Stars (High Growth, High Market Share)
- 4.3.2. Cash Cows (Low Growth, High Market Share)
- 4.3.3. Question Mark (High Growth, Low Market Share)
- 4.3.4. Dogs (Low Growth, Low Market Share)
- 4.4. Ansoff Matrix Analysis
- 4.5. Supply Chain Analysis
- 4.6. Regulatory Landscape
- 4.7. Current Market Potential and Opportunity Assessment (TAM–SAM–SOM Framework)
- 4.8. NRP Analyst Note
- 4.1. Porters Five Forces
- 5. Market Analysis, Insights and Forecast 2021-2033
- 5.1. Market Analysis, Insights and Forecast - by Vehicle Type
- 5.1.1. Motorhomes
- 5.1.1.1. Class A
- 5.1.1.2. Class B
- 5.1.1.3. Class C
- 5.1.1.4. Rockstar Motorhomes
- 5.1.2. Trailers
- 5.1.2.1. 5th Wheel Trailers
- 5.1.2.2. Travel Trailers
- 5.1.2.3. Tent Trailer
- 5.1.2.4. Retro Trailer
- 5.1.1. Motorhomes
- 5.2. Market Analysis, Insights and Forecast - by Price
- 5.2.1. Standard
- 5.2.2. Luxury
- 5.3. Market Analysis, Insights and Forecast - by End-Use
- 5.3.1. Individual
- 5.3.2. Fleet Owners
- 5.4. Market Analysis, Insights and Forecast - by Region
- 5.4.1. North America
- 5.4.2. Europe
- 5.4.3. Asia Pacific
- 5.4.4. Latin America
- 5.4.5. Middle East
- 5.1. Market Analysis, Insights and Forecast - by Vehicle Type
- 6. Global Recreational Vehicle Parks And Campgrounds Market Analysis, Insights and Forecast, 2021-2033
- 6.1. Market Analysis, Insights and Forecast - by Vehicle Type
- 6.1.1. Motorhomes
- 6.1.1.1. Class A
- 6.1.1.2. Class B
- 6.1.1.3. Class C
- 6.1.1.4. Rockstar Motorhomes
- 6.1.2. Trailers
- 6.1.2.1. 5th Wheel Trailers
- 6.1.2.2. Travel Trailers
- 6.1.2.3. Tent Trailer
- 6.1.2.4. Retro Trailer
- 6.1.1. Motorhomes
- 6.2. Market Analysis, Insights and Forecast - by Price
- 6.2.1. Standard
- 6.2.2. Luxury
- 6.3. Market Analysis, Insights and Forecast - by End-Use
- 6.3.1. Individual
- 6.3.2. Fleet Owners
- 6.1. Market Analysis, Insights and Forecast - by Vehicle Type
- 7. North America Recreational Vehicle Parks And Campgrounds Market Analysis, Insights and Forecast, 2020-2032
- 7.1. Market Analysis, Insights and Forecast - by Vehicle Type
- 7.1.1. Motorhomes
- 7.1.1.1. Class A
- 7.1.1.2. Class B
- 7.1.1.3. Class C
- 7.1.1.4. Rockstar Motorhomes
- 7.1.2. Trailers
- 7.1.2.1. 5th Wheel Trailers
- 7.1.2.2. Travel Trailers
- 7.1.2.3. Tent Trailer
- 7.1.2.4. Retro Trailer
- 7.1.1. Motorhomes
- 7.2. Market Analysis, Insights and Forecast - by Price
- 7.2.1. Standard
- 7.2.2. Luxury
- 7.3. Market Analysis, Insights and Forecast - by End-Use
- 7.3.1. Individual
- 7.3.2. Fleet Owners
- 7.1. Market Analysis, Insights and Forecast - by Vehicle Type
- 8. Europe Recreational Vehicle Parks And Campgrounds Market Analysis, Insights and Forecast, 2020-2032
- 8.1. Market Analysis, Insights and Forecast - by Vehicle Type
- 8.1.1. Motorhomes
- 8.1.1.1. Class A
- 8.1.1.2. Class B
- 8.1.1.3. Class C
- 8.1.1.4. Rockstar Motorhomes
- 8.1.2. Trailers
- 8.1.2.1. 5th Wheel Trailers
- 8.1.2.2. Travel Trailers
- 8.1.2.3. Tent Trailer
- 8.1.2.4. Retro Trailer
- 8.1.1. Motorhomes
- 8.2. Market Analysis, Insights and Forecast - by Price
- 8.2.1. Standard
- 8.2.2. Luxury
- 8.3. Market Analysis, Insights and Forecast - by End-Use
- 8.3.1. Individual
- 8.3.2. Fleet Owners
- 8.1. Market Analysis, Insights and Forecast - by Vehicle Type
- 9. Asia Pacific Recreational Vehicle Parks And Campgrounds Market Analysis, Insights and Forecast, 2020-2032
- 9.1. Market Analysis, Insights and Forecast - by Vehicle Type
- 9.1.1. Motorhomes
- 9.1.1.1. Class A
- 9.1.1.2. Class B
- 9.1.1.3. Class C
- 9.1.1.4. Rockstar Motorhomes
- 9.1.2. Trailers
- 9.1.2.1. 5th Wheel Trailers
- 9.1.2.2. Travel Trailers
- 9.1.2.3. Tent Trailer
- 9.1.2.4. Retro Trailer
- 9.1.1. Motorhomes
- 9.2. Market Analysis, Insights and Forecast - by Price
- 9.2.1. Standard
- 9.2.2. Luxury
- 9.3. Market Analysis, Insights and Forecast - by End-Use
- 9.3.1. Individual
- 9.3.2. Fleet Owners
- 9.1. Market Analysis, Insights and Forecast - by Vehicle Type
- 10. Latin America Recreational Vehicle Parks And Campgrounds Market Analysis, Insights and Forecast, 2020-2032
- 10.1. Market Analysis, Insights and Forecast - by Vehicle Type
- 10.1.1. Motorhomes
- 10.1.1.1. Class A
- 10.1.1.2. Class B
- 10.1.1.3. Class C
- 10.1.1.4. Rockstar Motorhomes
- 10.1.2. Trailers
- 10.1.2.1. 5th Wheel Trailers
- 10.1.2.2. Travel Trailers
- 10.1.2.3. Tent Trailer
- 10.1.2.4. Retro Trailer
- 10.1.1. Motorhomes
- 10.2. Market Analysis, Insights and Forecast - by Price
- 10.2.1. Standard
- 10.2.2. Luxury
- 10.3. Market Analysis, Insights and Forecast - by End-Use
- 10.3.1. Individual
- 10.3.2. Fleet Owners
- 10.1. Market Analysis, Insights and Forecast - by Vehicle Type
- 11. Middle East Recreational Vehicle Parks And Campgrounds Market Analysis, Insights and Forecast, 2020-2032
- 11.1. Market Analysis, Insights and Forecast - by Vehicle Type
- 11.1.1. Motorhomes
- 11.1.1.1. Class A
- 11.1.1.2. Class B
- 11.1.1.3. Class C
- 11.1.1.4. Rockstar Motorhomes
- 11.1.2. Trailers
- 11.1.2.1. 5th Wheel Trailers
- 11.1.2.2. Travel Trailers
- 11.1.2.3. Tent Trailer
- 11.1.2.4. Retro Trailer
- 11.1.1. Motorhomes
- 11.2. Market Analysis, Insights and Forecast - by Price
- 11.2.1. Standard
- 11.2.2. Luxury
- 11.3. Market Analysis, Insights and Forecast - by End-Use
- 11.3.1. Individual
- 11.3.2. Fleet Owners
- 11.1. Market Analysis, Insights and Forecast - by Vehicle Type
- 12. Competitive Analysis
- 12.1. Company Profiles
- 12.1.1 Banyan Tree Al Wadi
- 12.1.1.1. Company Overview
- 12.1.1.2. Products
- 12.1.1.3. Company Financials
- 12.1.1.4. SWOT Analysis
- 12.1.2 Bourne Leisure Holdings Limited
- 12.1.2.1. Company Overview
- 12.1.2.2. Products
- 12.1.2.3. Company Financials
- 12.1.2.4. SWOT Analysis
- 12.1.3 Ellevacanze
- 12.1.3.1. Company Overview
- 12.1.3.2. Products
- 12.1.3.3. Company Financials
- 12.1.3.4. SWOT Analysis
- 12.1.4 Elangeni Holiday Resort
- 12.1.4.1. Company Overview
- 12.1.4.2. Products
- 12.1.4.3. Company Financials
- 12.1.4.4. SWOT Analysis
- 12.1.5 Easycamp
- 12.1.5.1. Company Overview
- 12.1.5.2. Products
- 12.1.5.3. Company Financials
- 12.1.5.4. SWOT Analysis
- 12.1.6 Camping Pod Lasem
- 12.1.6.1. Company Overview
- 12.1.6.2. Products
- 12.1.6.3. Company Financials
- 12.1.6.4. SWOT Analysis
- 12.1.7 Equity Lifestyle Properties**List Not Exhaustive
- 12.1.7.1. Company Overview
- 12.1.7.2. Products
- 12.1.7.3. Company Financials
- 12.1.7.4. SWOT Analysis
- 12.1.8 Camping Flamboyant
- 12.1.8.1. Company Overview
- 12.1.8.2. Products
- 12.1.8.3. Company Financials
- 12.1.8.4. SWOT Analysis
- 12.1.9 Discovery Parks Private Limited
- 12.1.9.1. Company Overview
- 12.1.9.2. Products
- 12.1.9.3. Company Financials
- 12.1.9.4. SWOT Analysis
- 12.1.10 Alaskan Anglers RV Park
- 12.1.10.1. Company Overview
- 12.1.10.2. Products
- 12.1.10.3. Company Financials
- 12.1.10.4. SWOT Analysis
- 12.1.1 Banyan Tree Al Wadi
- 12.2. Market Entropy
- 12.2.1 Company's Key Areas Served
- 12.2.2 Recent Developments
- 12.3. Company Market Share Analysis 2025
- 12.3.1 Top 5 Companies Market Share Analysis
- 12.3.2 Top 3 Companies Market Share Analysis
- 12.4. List of Potential Customers
- 13. Research Methodology
List of Figures
- Figure 1: Global Recreational Vehicle Parks And Campgrounds Market Revenue Breakdown (Million, %) by Region 2025 & 2033
- Figure 2: North America Recreational Vehicle Parks And Campgrounds Market Revenue (Million), by Vehicle Type 2025 & 2033
- Figure 3: North America Recreational Vehicle Parks And Campgrounds Market Revenue Share (%), by Vehicle Type 2025 & 2033
- Figure 4: North America Recreational Vehicle Parks And Campgrounds Market Revenue (Million), by Price 2025 & 2033
- Figure 5: North America Recreational Vehicle Parks And Campgrounds Market Revenue Share (%), by Price 2025 & 2033
- Figure 6: North America Recreational Vehicle Parks And Campgrounds Market Revenue (Million), by End-Use 2025 & 2033
- Figure 7: North America Recreational Vehicle Parks And Campgrounds Market Revenue Share (%), by End-Use 2025 & 2033
- Figure 8: North America Recreational Vehicle Parks And Campgrounds Market Revenue (Million), by Country 2025 & 2033
- Figure 9: North America Recreational Vehicle Parks And Campgrounds Market Revenue Share (%), by Country 2025 & 2033
- Figure 10: Europe Recreational Vehicle Parks And Campgrounds Market Revenue (Million), by Vehicle Type 2025 & 2033
- Figure 11: Europe Recreational Vehicle Parks And Campgrounds Market Revenue Share (%), by Vehicle Type 2025 & 2033
- Figure 12: Europe Recreational Vehicle Parks And Campgrounds Market Revenue (Million), by Price 2025 & 2033
- Figure 13: Europe Recreational Vehicle Parks And Campgrounds Market Revenue Share (%), by Price 2025 & 2033
- Figure 14: Europe Recreational Vehicle Parks And Campgrounds Market Revenue (Million), by End-Use 2025 & 2033
- Figure 15: Europe Recreational Vehicle Parks And Campgrounds Market Revenue Share (%), by End-Use 2025 & 2033
- Figure 16: Europe Recreational Vehicle Parks And Campgrounds Market Revenue (Million), by Country 2025 & 2033
- Figure 17: Europe Recreational Vehicle Parks And Campgrounds Market Revenue Share (%), by Country 2025 & 2033
- Figure 18: Asia Pacific Recreational Vehicle Parks And Campgrounds Market Revenue (Million), by Vehicle Type 2025 & 2033
- Figure 19: Asia Pacific Recreational Vehicle Parks And Campgrounds Market Revenue Share (%), by Vehicle Type 2025 & 2033
- Figure 20: Asia Pacific Recreational Vehicle Parks And Campgrounds Market Revenue (Million), by Price 2025 & 2033
- Figure 21: Asia Pacific Recreational Vehicle Parks And Campgrounds Market Revenue Share (%), by Price 2025 & 2033
- Figure 22: Asia Pacific Recreational Vehicle Parks And Campgrounds Market Revenue (Million), by End-Use 2025 & 2033
- Figure 23: Asia Pacific Recreational Vehicle Parks And Campgrounds Market Revenue Share (%), by End-Use 2025 & 2033
- Figure 24: Asia Pacific Recreational Vehicle Parks And Campgrounds Market Revenue (Million), by Country 2025 & 2033
- Figure 25: Asia Pacific Recreational Vehicle Parks And Campgrounds Market Revenue Share (%), by Country 2025 & 2033
- Figure 26: Latin America Recreational Vehicle Parks And Campgrounds Market Revenue (Million), by Vehicle Type 2025 & 2033
- Figure 27: Latin America Recreational Vehicle Parks And Campgrounds Market Revenue Share (%), by Vehicle Type 2025 & 2033
- Figure 28: Latin America Recreational Vehicle Parks And Campgrounds Market Revenue (Million), by Price 2025 & 2033
- Figure 29: Latin America Recreational Vehicle Parks And Campgrounds Market Revenue Share (%), by Price 2025 & 2033
- Figure 30: Latin America Recreational Vehicle Parks And Campgrounds Market Revenue (Million), by End-Use 2025 & 2033
- Figure 31: Latin America Recreational Vehicle Parks And Campgrounds Market Revenue Share (%), by End-Use 2025 & 2033
- Figure 32: Latin America Recreational Vehicle Parks And Campgrounds Market Revenue (Million), by Country 2025 & 2033
- Figure 33: Latin America Recreational Vehicle Parks And Campgrounds Market Revenue Share (%), by Country 2025 & 2033
- Figure 34: Middle East Recreational Vehicle Parks And Campgrounds Market Revenue (Million), by Vehicle Type 2025 & 2033
- Figure 35: Middle East Recreational Vehicle Parks And Campgrounds Market Revenue Share (%), by Vehicle Type 2025 & 2033
- Figure 36: Middle East Recreational Vehicle Parks And Campgrounds Market Revenue (Million), by Price 2025 & 2033
- Figure 37: Middle East Recreational Vehicle Parks And Campgrounds Market Revenue Share (%), by Price 2025 & 2033
- Figure 38: Middle East Recreational Vehicle Parks And Campgrounds Market Revenue (Million), by End-Use 2025 & 2033
- Figure 39: Middle East Recreational Vehicle Parks And Campgrounds Market Revenue Share (%), by End-Use 2025 & 2033
- Figure 40: Middle East Recreational Vehicle Parks And Campgrounds Market Revenue (Million), by Country 2025 & 2033
- Figure 41: Middle East Recreational Vehicle Parks And Campgrounds Market Revenue Share (%), by Country 2025 & 2033
List of Tables
- Table 1: Global Recreational Vehicle Parks And Campgrounds Market Revenue Million Forecast, by Vehicle Type 2020 & 2033
- Table 2: Global Recreational Vehicle Parks And Campgrounds Market Revenue Million Forecast, by Price 2020 & 2033
- Table 3: Global Recreational Vehicle Parks And Campgrounds Market Revenue Million Forecast, by End-Use 2020 & 2033
- Table 4: Global Recreational Vehicle Parks And Campgrounds Market Revenue Million Forecast, by Region 2020 & 2033
- Table 5: Global Recreational Vehicle Parks And Campgrounds Market Revenue Million Forecast, by Vehicle Type 2020 & 2033
- Table 6: Global Recreational Vehicle Parks And Campgrounds Market Revenue Million Forecast, by Price 2020 & 2033
- Table 7: Global Recreational Vehicle Parks And Campgrounds Market Revenue Million Forecast, by End-Use 2020 & 2033
- Table 8: Global Recreational Vehicle Parks And Campgrounds Market Revenue Million Forecast, by Country 2020 & 2033
- Table 9: Global Recreational Vehicle Parks And Campgrounds Market Revenue Million Forecast, by Vehicle Type 2020 & 2033
- Table 10: Global Recreational Vehicle Parks And Campgrounds Market Revenue Million Forecast, by Price 2020 & 2033
- Table 11: Global Recreational Vehicle Parks And Campgrounds Market Revenue Million Forecast, by End-Use 2020 & 2033
- Table 12: Global Recreational Vehicle Parks And Campgrounds Market Revenue Million Forecast, by Country 2020 & 2033
- Table 13: Global Recreational Vehicle Parks And Campgrounds Market Revenue Million Forecast, by Vehicle Type 2020 & 2033
- Table 14: Global Recreational Vehicle Parks And Campgrounds Market Revenue Million Forecast, by Price 2020 & 2033
- Table 15: Global Recreational Vehicle Parks And Campgrounds Market Revenue Million Forecast, by End-Use 2020 & 2033
- Table 16: Global Recreational Vehicle Parks And Campgrounds Market Revenue Million Forecast, by Country 2020 & 2033
- Table 17: Global Recreational Vehicle Parks And Campgrounds Market Revenue Million Forecast, by Vehicle Type 2020 & 2033
- Table 18: Global Recreational Vehicle Parks And Campgrounds Market Revenue Million Forecast, by Price 2020 & 2033
- Table 19: Global Recreational Vehicle Parks And Campgrounds Market Revenue Million Forecast, by End-Use 2020 & 2033
- Table 20: Global Recreational Vehicle Parks And Campgrounds Market Revenue Million Forecast, by Country 2020 & 2033
- Table 21: Global Recreational Vehicle Parks And Campgrounds Market Revenue Million Forecast, by Vehicle Type 2020 & 2033
- Table 22: Global Recreational Vehicle Parks And Campgrounds Market Revenue Million Forecast, by Price 2020 & 2033
- Table 23: Global Recreational Vehicle Parks And Campgrounds Market Revenue Million Forecast, by End-Use 2020 & 2033
- Table 24: Global Recreational Vehicle Parks And Campgrounds Market Revenue Million Forecast, by Country 2020 & 2033
Frequently Asked Questions
1. What is the projected Compound Annual Growth Rate (CAGR) of the Recreational Vehicle Parks And Campgrounds Market?
The projected CAGR is approximately 4.69%.
2. Which companies are prominent players in the Recreational Vehicle Parks And Campgrounds Market?
Key companies in the market include Banyan Tree Al Wadi, Bourne Leisure Holdings Limited, Ellevacanze, Elangeni Holiday Resort, Easycamp, Camping Pod Lasem, Equity Lifestyle Properties**List Not Exhaustive, Camping Flamboyant, Discovery Parks Private Limited, Alaskan Anglers RV Park.
3. What are the main segments of the Recreational Vehicle Parks And Campgrounds Market?
The market segments include Vehicle Type, Price, End-Use.
4. Can you provide details about the market size?
The market size is estimated to be USD 26.31 Million as of 2022.
5. What are some drivers contributing to market growth?
Increase in the Number of Restaurants and Bars in the Industry; Increase in the Number of Tourist Attractions and Activities.
6. What are the notable trends driving market growth?
Operating Overnight Recreational Camps Segment Booming the Market.
7. Are there any restraints impacting market growth?
Inadequate Research and Development. Unpredictability of the Market.
8. Can you provide examples of recent developments in the market?
December 2022: The company unveiled the largest full-service RV park in Ninilchik, Alaskan Angler. Spacious, flat sites with helpful staff and all the necessary support services are nearby rivers and beaches.,
9. What pricing options are available for accessing the report?
Pricing options include single-user, multi-user, and enterprise licenses priced at USD 4750, USD 5250, and USD 8750 respectively.
10. Is the market size provided in terms of value or volume?
The market size is provided in terms of value, measured in Million.
11. Are there any specific market keywords associated with the report?
Yes, the market keyword associated with the report is "Recreational Vehicle Parks And Campgrounds Market," which aids in identifying and referencing the specific market segment covered.
12. How do I determine which pricing option suits my needs best?
The pricing options vary based on user requirements and access needs. Individual users may opt for single-user licenses, while businesses requiring broader access may choose multi-user or enterprise licenses for cost-effective access to the report.
13. Are there any additional resources or data provided in the Recreational Vehicle Parks And Campgrounds Market report?
While the report offers comprehensive insights, it's advisable to review the specific contents or supplementary materials provided to ascertain if additional resources or data are available.
14. How can I stay updated on further developments or reports in the Recreational Vehicle Parks And Campgrounds Market?
To stay informed about further developments, trends, and reports in the Recreational Vehicle Parks And Campgrounds Market, consider subscribing to industry newsletters, following relevant companies and organizations, or regularly checking reputable industry news sources and publications.
Methodology
Step 1 - Identification of Relevant Samples Size from Population Database


Step 2 - Approaches for Defining Global Market Size (Value, Volume* & Price*)

Note*: In applicable scenarios
Step 3 - Data Sources
Primary Research
- Web Analytics
- Survey Reports
- Research Institute
- Latest Research Reports
- Opinion Leaders
Secondary Research
- Annual Reports
- White Paper
- Latest Press Release
- Industry Association
- Paid Database
- Investor Presentations

Step 4 - Data Triangulation
Involves using different sources of information in order to increase the validity of a study
These sources are likely to be stakeholders in a program - participants, other researchers, program staff, other community members, and so on.
Then we put all data in single framework & apply various statistical tools to find out the dynamic on the market.
During the analysis stage, feedback from the stakeholder groups would be compared to determine areas of agreement as well as areas of divergence